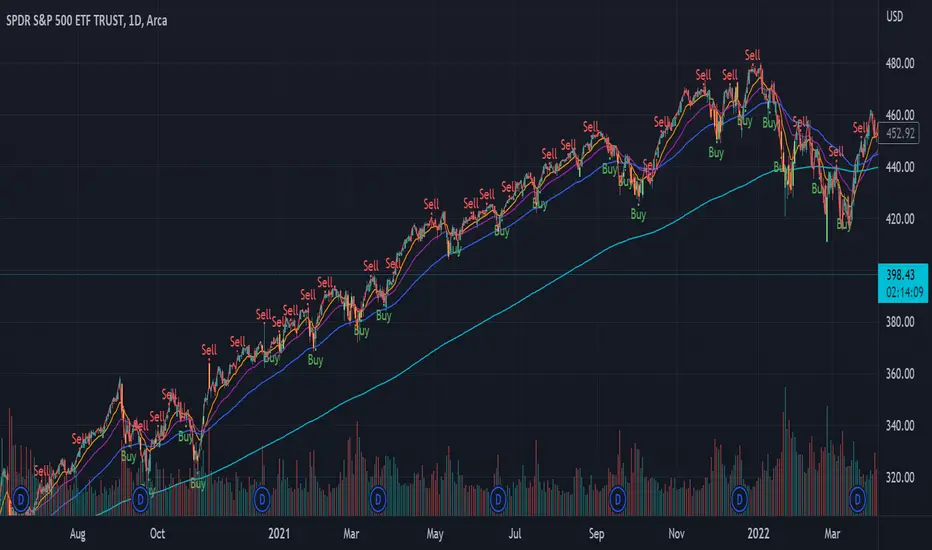
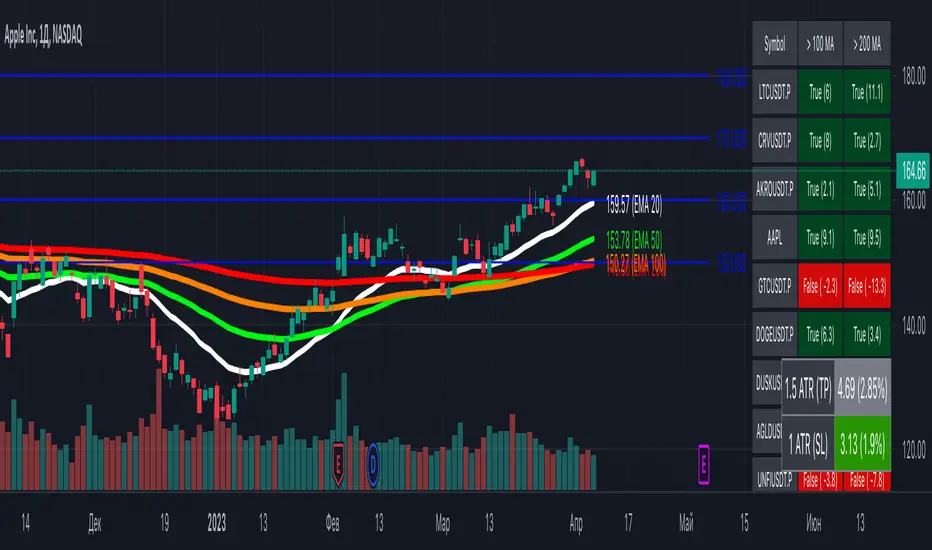
[MiV] MA Screener v1.0In my trading I stick to the following strategy: I buy an asset above the 100/200 moving average and then sell it.
The most problematic thing in all this is to look for assets that are above the 100 or 200 moving average, and to assess how "far" the price is from that moving average.
In fact, to solve this problem I created this indicator.
It works with 30 different assets and displays the state of its two moving averages, whether the price is higher or not, and how much higher the price is from that level.
Moving_average
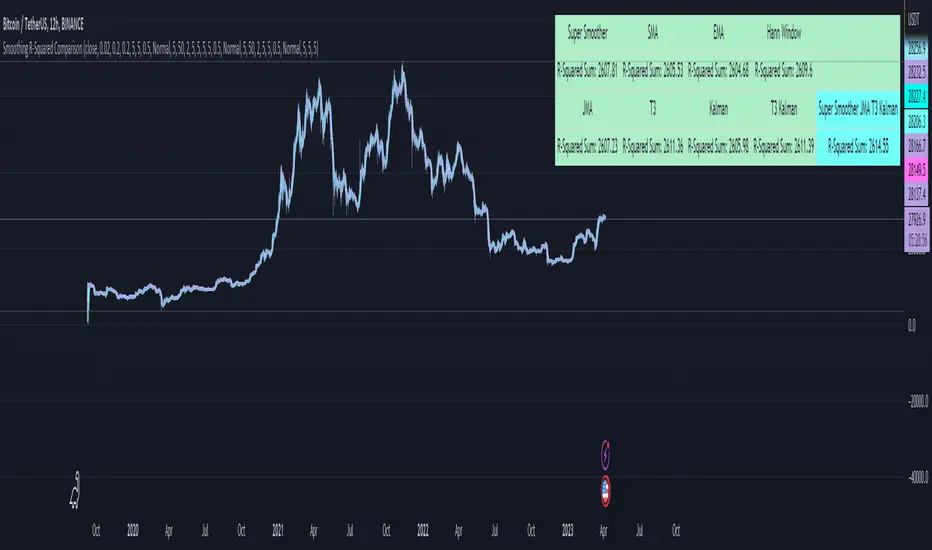
Smoothing R-Squared ComparisonIntroduction
Heyo guys, here I made a comparison between my favorised smoothing algorithms.
I chose the R-Squared value as rating factor to accomplish the comparison.
The indicator is non-repainting.
Description
In technical analysis, traders often use moving averages to smooth out the noise in price data and identify trends. While moving averages are a useful tool, they can also obscure important information about the underlying relationship between the price and the smoothed price.
One way to evaluate this relationship is by calculating the R-squared value, which represents the proportion of the variance in the price that can be explained by the smoothed price in a linear regression model.
This PineScript code implements a smoothing R-squared comparison indicator.
It provides a comparison of different smoothing techniques such as Kalman filter, T3, JMA, EMA, SMA, Super Smoother and some special combinations of them.
The Kalman filter is a mathematical algorithm that uses a series of measurements observed over time, containing statistical noise and other inaccuracies, and produces estimates of unknown variables that tend to be more accurate than those based on a single measurement.
The input parameters for the Kalman filter include the process noise covariance and the measurement noise covariance, which help to adjust the sensitivity of the filter to changes in the input data.
The T3 smoothing technique is a popular method used in technical analysis to remove noise from a signal.
The input parameters for the T3 smoothing method include the length of the window used for smoothing, the type of smoothing used (Normal or New), and the smoothing factor used to adjust the sensitivity to changes in the input data.
The JMA smoothing technique is another popular method used in technical analysis to remove noise from a signal.
The input parameters for the JMA smoothing method include the length of the window used for smoothing, the phase used to shift the input data before applying the smoothing algorithm, and the power used to adjust the sensitivity of the JMA to changes in the input data.
The EMA and SMA techniques are also popular methods used in technical analysis to remove noise from a signal.
The input parameters for the EMA and SMA techniques include the length of the window used for smoothing.
The indicator displays a comparison of the R-squared values for each smoothing technique, which provides an indication of how well the technique is fitting the data.
Higher R-squared values indicate a better fit. By adjusting the input parameters for each smoothing technique, the user can compare the effectiveness of different techniques in removing noise from the input data.
Usage
You can use it to find the best fitting smoothing method for the timeframe you usually use.
Just apply it on your preferred timeframe and look for the highlighted table cell.
Conclusion
It seems like the T3 works best on timeframes under 4H.
There's where I am active, so I will use this one more in the future.
Thank you for checking this out. Enjoy your day and leave me a like or comment. 🧙♂️
---
Credits to:
▪@loxx – T3
▪@balipour – Super Smoother
▪ChatGPT – Wrote 80 % of this article and helped with the research
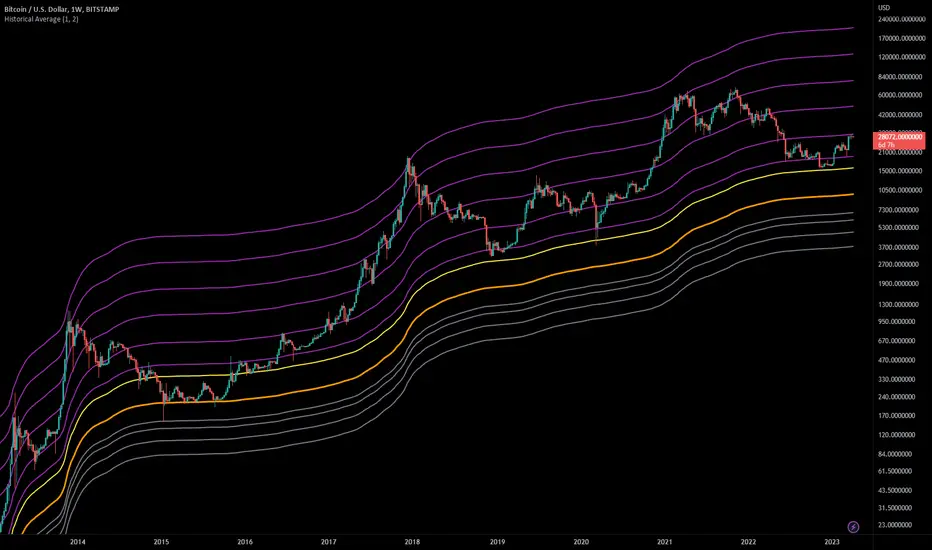
Historical AverageThis indicator calculates the sum of all past candles for each new candle.
For the second candle of the chart, the indicator shows the average of the first two candles. For the 10th candle, it's the average of the last ten candles.
Simple Moving Averages (SMAa) calculate the average of a specific timeframe (e.g. SMA200 for the last 200 candles). The historical moving average is an SMA 2 at the second candle, an SMA3 for the third candle, an SMA10 for the tenth, an SMA200 for the 200th candle etc.
Settings:
You can set the multiplier to move the Historical Moving Average along the price axis.
You can show two Historical Moving Averages with different multipliers.
You can add fibonacci multipliers to the Historical Moving Average.
This indicator works best on charts with a lot of historical data.
Recommended charts:
INDEX:BTCUSD
BLX
But you can use it e.g. on DJI or any other chart as well.
Colorful Moving Averageswhat is Colorful Moving Averages?
This indicator allows you to use your favorite moving averages in their advanced form.
what it does?
It gives you easy access to the following information with a single indicator: the direction and momentum of the price,
rate of change of momentum (acceleration),
time-dependent change in momentum,
and all the other information a moving average provides.
it paints the selected moving average type according to the momentum it has, and also shows the momentum and acceleration values in a table. colors are interpreted as follows: the color of the moving average is red, the momentum is negative; A green color means the momentum is positive, and a yellow color means the momentum is 0. As the momentum changes, the moving average takes on different shades of these 3 colors. how it actually works can be easily understood at a glance.
"Δ" sign indicates momentum compressed between 100 and -100.
"Γ" sign indicates the momentum of the momentum, that is the acceleration. its values are compressed between 100 and -100.
how it does it?
it uses this formulas:
how to use it?
First, select the moving average type you want to use. then set the length and source. Now, with a single indicator, you can observe both the distance of the price from the mean, its instantaneous momentum relative to the last candle by looking at the symbol "Δ", the current change of momentum by looking at the symbol "Γ", and the time-dependent change in its momentum by looking at the colors. you can also see the maximum and minimum points where the momentum is equal to 0.

Mason’s Line IndicatorThe Macon Strategy is an idea conceived by Didier Darcet , co-founder of Gavekal Intelligence Software. Inspired by the Water Level, an instrument used by masons to check the horizontality or verticality of a wall. This method aims to measure the psychology of financial markets and determine if the market is balanced or tilting towards an unfavorable side, focusing on the behavioral risk of markets rather than economic or political factors.
The strategy examines the satisfaction and frustration of investors based on the distance between the low and high points of the market over a period of one year. Investor satisfaction is influenced by the current price of the index and the path taken to reach that price. The distance to the low point provides satisfaction, while the distance to the high point generates frustration. The balance between the two dictates investors’ desire to hold or sell their positions.
To refine the strategy, it is important to consider the opinion of a group of investors rather than just one individual. The members of a hypothetical investor club invest successively throughout the past year. The overall satisfaction of the market on a given day is a democratic expression of all participants.
If the overall satisfaction is below 50%, investors are frustrated and sell their positions. If it is above, they are satisfied and hold their positions. The position of the group of investors relative to the high and low points represents the position of the air bubble in the water level. Market performance is measured day by day based on participant satisfaction or dissatisfaction.
In conclusion, memory, emotions, and decision-making ability are closely linked, and their interaction influences investment decisions. The Macon Strategy highlights the importance of the behavioral dimension in understanding financial market dynamics. By studying investor behavior through this strategy, it is possible to better anticipate market trends and make more informed investment decisions.
Presentation of the Mason’s Line Indicator:
The main strategy of this indicator is to measure the average satisfaction of investors based on the position of an imaginary air bubble in a tube delimited by the market’s highs and lows over a given period. After calculating the satisfaction level, it is then normalized between 0 and 1, and a moving average can be used to visualize trends.
Key features:
Calculation of highs and lows over a user-defined period.
Determination of the position of the air bubble in the tube based on the closing price.
Calculation of the average satisfaction of investors over a selected period.
Normalization of the average satisfaction between 0 and 1.
Visualization of normalized or non-normalized average satisfaction levels, as well as their corresponding moving averages.
User parameters:
Period for min and max (days) : Sets the period over which highs and lows will be calculated (1 to 365 days).
Period for average satisfaction (days) : Determines the period over which the average satisfaction of investors will be calculated (1 to 365 days).
Period for SMA : Sets the period of the simple moving average used to smooth the data (1 to 1000 days).
Bubble_value : Adjustment of the air bubble value, ranging from 0 to 1, in increments of 0.025.
Normalized average satisfaction : Option to choose whether to display the normalized or non-normalized average satisfaction.
Please note that the Mason’s Line Indicator is not a guarantee of future market performance and should be used in conjunction with proper risk management. Always ensure that you have a thorough understanding of the indicator’s methodology and its limitations before making any investment decisions. Additionally, past performance is not indicative of future results.

Rainbow Collection - VioletMoving averages come in all shapes and types. The most basic type is the simple moving average which is simply the sum divided by the quantity. Therefore, the simple moving average is the sum of the values divided by their number.
In technical analysis, you generally use moving averages to understand the underlying trend and to find trading signals. In the case of the Violet indicator, we are using a Hull moving average which is a special variation based on different weights to minimize lag.
The Violet indicator is therefore used as follows:
* A bullish signal is generated whenever the close price surpasses the 20-period Hull moving average while the previous close prices from periods were all below their respective Hull moving average of the period.
*A bearish signal is generated whenever the close price breaks the 20-period Hull moving average while the previous close prices from periods were all above their respective Hull moving average of the period.
The aim of the Violet indicator is to capture reversals as early as possible through a combination of lagged conditions based on the Fibonacci sequence.

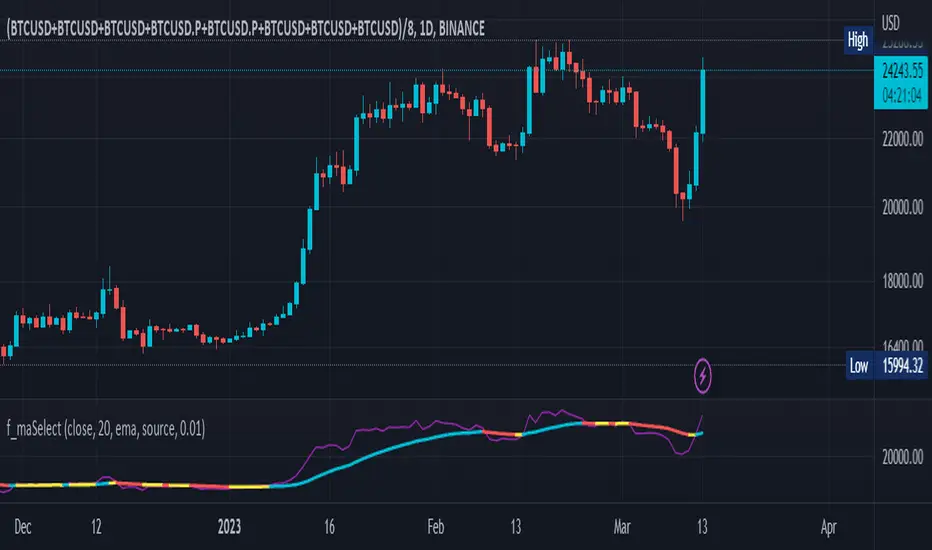
f_maSelectLibrary "f_maSelect"
Easy to use drop-in facade function to lots of different moving average calculations, including some that are not natively available in PineScript v5 such as Zero-Lag EMA. Simply call f_maSelect(series float serie, simple string ma_type="sma", ma_length=14) instead of a ta.*ma() call and you get access to all MAs offered by PineScript and more.
zema(src, len)
Zero-lag EMA (ZLMA)
Parameters:
src : Input series
len : Lookback period
Returns: Series smoothed with ZLMA
approximate_sma(x, ma_length)
Approximate Standard Moving Average, which substracts the average instead of popping the oldest element, hence losing the base frequency and is why it is approximative. For some reason, this appears to give the same results as a standard RMA
Parameters:
x : Input series.
ma_length : Lookback period.
Returns: Approximate SMA series.
f_maSelect(serie, ma_type, ma_length)
Generalized moving average selector
Parameters:
serie : Input series
ma_type : String describing which moving average to use
ma_length : Lookback period
Returns: Serie smoothed with the selected moving average.
generalized_dev(src, length, avg, lmode)
Generalized deviation calculation: Whereas other Bollinger Bands often just change the basis but not the stdev calculation, the correct way to change the basis is to also change it inside the stdev calculation.
Parameters:
src : Series to use (default: close)
length : Lookback period
avg : Average basis to use to calculate the standard deviation
lmode : L1 or L2 regularization? (ie, lmode=1 uses abs() to cutoff negative values hence it calculates the Mean Absolute Deviation as does the ta.dev(), lmode=2 uses sum of squares hence it calculates the true Standard Deviation as the ta.stdev() function does). See also the research works of everget:
Returns: stdev Standard deviation series
generalized_dev_discount(src, length, avg, lmode, temporal_discount)
Standard deviation calculation but with different probabilities assigned to each bar, with newer bars having more weights en.wikipedia.org
Parameters:
src : Series to use (default: close)
length : Lookback period
avg : Average basis to use to calculate the standard deviation
lmode : L1 or L2 regularization? (ie, lmode=1 uses abs() to cutoff negative values hence it calculates the Mean Absolute Deviation as does the ta.dev(), lmode=2 uses sum of squares hence it calculates the true Standard Deviation as the ta.stdev() function does). See also the research works of everget:
temporal_discount : Probabilistic gamma factor to discount old values in favor of new ones, higher value = more weight to newer bars
Returns: stdev Standard deviation series
median_absdev(src, length, median)
Median Absolute Deviation
Parameters:
src : Input series
length : Lookback period
median : Median already calculated on the input series
Returns: mad, the median absolute deviation value
Blocky's EMA RibbonA classic EMA ribbon setup.
The script uses eight EMAs, with default lengths ranging from 21 to 55 periods, with an additional EMA with a default length of 200 periods.
The lengths of the EMAs can be customized, when customizing, the shortest time frame should be first and the longest time frame last.
The ribbons gradient strength is calculated based on the EMA's sequence, and their separation.
The color and transparency are set based on the calculated strength. The bolder the color, the stronger the strength.
Use the opacity multiplier to increase/decrease the strength of the gradient. BITSTAMP:BTCUSD
Short Term Bubble RiskThis risk indicator uses the extension of the closing price to the 20W SMA and displays a color-coded risk oscillator. The higher the oscillator is, the greater the short-term risk and vice-versa. This indicator has historically worked well for estimating the short-term risk of Bitcoin and Ethereum on a weekly timeframe.

Rainbow Moving AverageA Rainbow Moving Average script. There are many like it, but this one is mine. It is designed to be easy to read without too much noise in the number of lines and shading, with the moving average to be some of the commonly used ones. Using commonly referenced moving average values help us to understand "the crowd" and what moving average or trend lines they might be looking at. The default values are derived from hourly charts, but work well on any time frame.
The moving average function is simple to change so you can use it for any moving average type that you like, including volume-weighted.
Inspired by my daughter's love of rainbows, she has approved the colors.

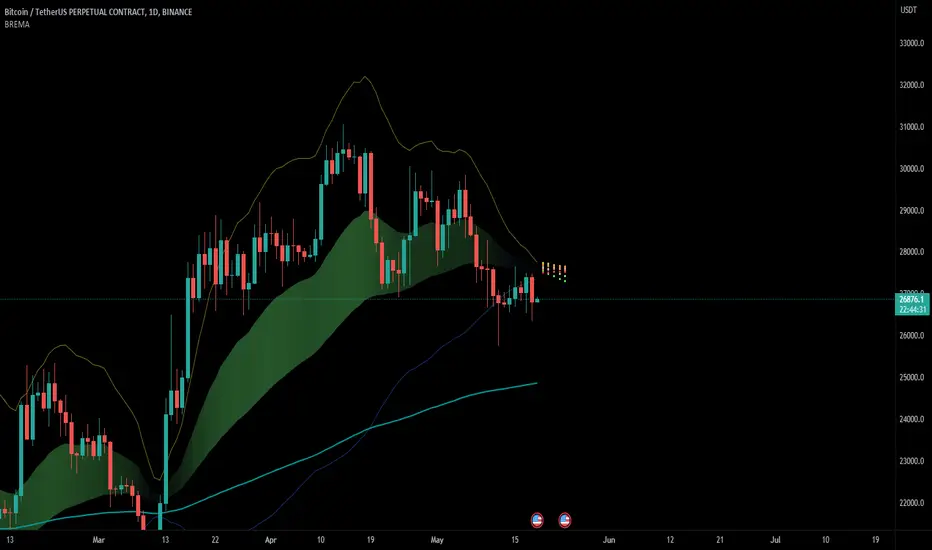
Rekt Edge Reversion BandRekt Edge Reversion band is a technical indicator that utilizes a combination of moving averages and standard deviations to determine optimal entry and exit points in the market. By comparing the current price to its moving average, the indicator identifies potential trends and determines how you can position around them by plotting buy/sell signals and two channels based on user input parameters. The user can choose between Simple Moving Average ( SMA ) or Exponential Moving Average ( EMA ) and select the moving average period, the unit of separation, the multiples of the unit, and other important parameters. The indicator's inputs can be adjusted to suit different trading styles, and it can be used on any time frame. The indicator can be used to identify potential trend reversals or breakouts (or breakdowns) when the price moves outside of the channels. The indicators potential use cases include identifying overbought or oversold conditions. With its ability to provide a clear signal on when to enter and exit a trade, this indicator is a popular tool among traders looking to make more informed and profitable trading decisions. This indicator can also be used in conjunction with other technical analysis tools to confirm or invalidate trading signals.

Customizable Moving Average RibbonThis indicator is a highly customizable moving average ribbon with some unique features.
This script can utilize multiple unique sources, including a non-repainting renko closing price. Renko charts focus solely on price movement and minimize the impacts of time and the extra noise time creates. Employing the renko close helps smooth out the MA ribbon. Insignificant price movements will not cause a change in the plotted lines of the indicator unless a new threshold is breached or a "brick" is created. This is highly useful for quickly identifying consolidation areas or overall flat price movement.
There are two methods for selecting the box size when utilizing the renko source. Box size is critical for the overall function and efficacy of the plots you will visually see with this indicator. Box size is set automatically using the Average True Range "ATR" or manually using the "Traditional" setting. The simplest way to determine a manual box size is to take the ATR of the given instrument and round it to the nearest decimal place. As an example, if the ATR for the asset is 0.18, you would round that number to 0.2 and utilize this as your traditional box size.
The MA ribbon contains eleven adjustable moving average lines. Users can choose to turn off as many as they would like. Users can also adjust the length of the individual moving averages and the source for all moving averages. There are nine types of moving averages to choose from for the ribbon. The MA options are:
Exponential Moving Average = 'EMA'
Double Exponential Moving Average= 'DEMA'
Triple Exponential Moving Average = 'TEMA'
Simple Moving Average = 'SMA'
Relative Moving Average = 'RMA'
Volume Weighted Moving Average = 'VWMA'
Weighted Moving Average = 'WMA'
Smoothed Simple Moving Average = 'SSMA'
Hull Moving Average = 'HULL'
We believe that the ribbons features, including the line color change, help quickly identify trends and give users optimum customization. Users can select from five different color schemes including:
Green/Red
Purple/White
White/Blue
Silver / Orange
Teal/ Orange

MA Band Distance Monitor'MA Band Distance Monitor' indicator is a simple tool for traders who rely on moving averages to make trading decisions. This indicator plots two moving averages of your choice (you can select the type of the moving average), and fills the space between them, creating a "band".
The indicator also generates a table that displays the current price distance from both the fast and slow moving averages, as well as the average of the two. This allows you to quickly assess the strength of the trend and potential entry or exit points.
In addition, the table also shows the average price distance from one to another MA and also the current distance between them, allowing you to compare the current price action to the historical average. This information can help you identify potential trend reversals and assess the overall health of the market.
*** Slow length input must be greater than fast length input, otherwise indicator will produce faulty results

Wunder Volatility botWunder Volatility bot
We have used the Average True Range (ATR) in many of its trading versions.
1. ATR with MA. This indicator includes the ATR as well as the simple moving average, which helps to restore the expected market.
2. We apply percentage based ATR to determine how volatile the market is and whether to buy or sell at that time. For trading, we will filter the market and make trades only within the specified range. This range will adjust depending on the asset, so you will need to change the settings if you are trading multiple assets.
3. A function for calculating risk on the portfolio (your deposit) has been added to the Wunder Volatility bot script. When this option is enabled, you get a calculation of the entry amount in dollars relative to your Stop Loss. In the settings, you can select the risk percentage on your portfolio. The loss will be calculated from the amount that will be displayed on the chart.
For example, if your deposit is $1000 and you set the risk to 1%, with a Stop Loss of 5%, the entry volume will be $200. The loss at SL will be $10.10, which is your 1% risk or 1% of the deposit.
**Important!** The risk per trade must be less than the Stop Loss value. If the risk is greater than SL, then you should use leverage.
The amount of funds entering the trade is calculated in dollars. This option was created if you want to send the dollar amount from Tradingview to the exchange. However, putting your volume in dollars you get the incorrect net profit and drawdown indication in the backtest results, as TradingView calculates the backtest volume in contracts.
To display the correct net profit and drawdown values in Tradingview Backtest results, use the ”Volume in contract” option.

VHF Adaptive Linear Regression KAMAIntroduction
Heyo, in this indicator I decided to add VHF adaptivness, linear regression and smoothing to a KAMA in order to squeeze all out of it.
KAMA:
Developed by Perry Kaufman, Kaufman's Adaptive Moving Average (KAMA) is a moving average designed to account for market noise or volatility. KAMA will closely follow prices when the price swings are relatively small and the noise is low. KAMA will adjust when the price swings widen and follow prices from a greater distance. This trend-following indicator can be used to identify the overall trend, time turning points and filter price movements.
VHF:
Vertical Horizontal Filter (VHF) was created by Adam White to identify trending and ranging markets. VHF measures the level of trend activity, similar to ADX DI. Vertical Horizontal Filter does not, itself, generate trading signals, but determines whether signals are taken from trend or momentum indicators. Using this trend information, one is then able to derive an average cycle length.
Linear Regression Curve:
A line that best fits the prices specified over a user-defined time period.
This is very good to eliminate bad crosses of KAMA and the pric.
Usage
You can use this indicator on every timeframe I think. I mostly tested it on 1 min, 5 min and 15 min.
Signals
Enter Long -> crossover(close, kama) and crossover(kama, kama )
Enter Short -> crossunder(close, kama) and crossunder(kama, kama )
Thanks for checking this out!
--
Credits to
▪️@cheatcountry – Hann Window Smoohing
▪️@loxx – VHF and T3
▪️@LucF – Gradient
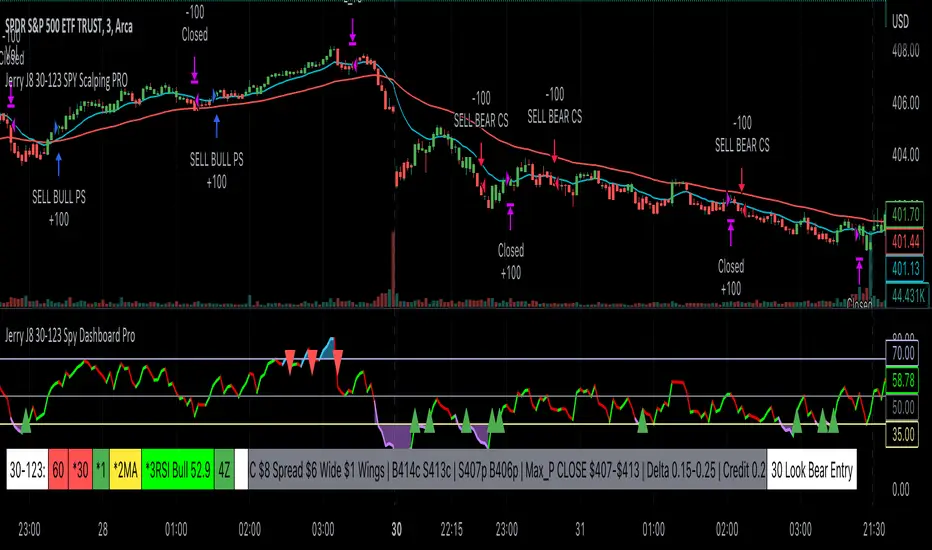
Jerry J8 30-123 Spy Dashboard ProPlease watch the J8 Scalping Tutorial Video below for a walkthrough on how these indicators work.
This script is used in conjunction with Jerry J8 30-123 SPY Scalping PRO” Indicator(which creates the buy and sell orders as a strategy). The Dashboard shows the 4 main criteria statuses from the strategy. I find the dashboard makes scalping the SPY much easier.
This study project is designed for scalping options that expire daily with bull put and bear call credit spreads on a 3 minute chart. The name 30_123 is a reference to 4 main criteria being met to give a green light for a potential trade. The criteria:
* 30 = 30 minute trend
* 1 = 3 minute trend
* 2 = Moving average criteria
* 3 = RSI criteria
4 = Secondary trend. Bonus if in sync but not a requirement.
* The strategy also utilizes momentum as a criteria but this is not shown on the dashboard.
This indicator is designed to trade options that expire daily including the SPY, IWM, QQQ, and NDX. However, it can be used with multiple symbols on a 3 minute chart.
When the 30_123 conditions are all green with all criteria are met a bull signal is created.
When the 30_123 conditions are all red with all criteria are met a bear signal is created.
This study is the dashboard that is designed to show how the main J8 strategy indicator is working and it shows which criteria have been met. Additionally there are multiple user INPUTS that you can adjust for the 4 main criteria plus inputs to help you with your credit spread criteria.
For example, if the SPY is at 400 we could have an order to sell a BULL PUT CREDIT SPREAD and I would likely sell the 398p and buy the 397p; The 398p delta would be approximately -.2. The spread position profits with any close over 398 and/or can be closed early with a bullish price move. IMPORTANT: If the SPY closed the day at $399 on the chart it would look like a loss based on the buy and sell orders but the spread would be a full profit since the close was above 398.
---- IRON CONDOR
For the SPY ticker only an iron condor label is generated when the SPY is trading sideways and meets specified criteria. When the criteria is met the Iron Condor label appears and it provides a recommendation for what option to buy and sell. The iron condor recommendations can be adjusted with user inputs.
This Indicator dashboard shows the criteria labels and colors the criteria as green if bullish and red if bearish. When the criteria are not met the dashboard shows “NO CLEAR SIGNAL”. There is also a label that shows whether you are looking for bullish or bearish positions based on the 30 minute trend.
The chart shown on the indicator is the RSI and for this indicator an RSI over 50 is bullish and under 50 is bearish. The line color shows the RSI trend. RSI OB (overbought) and OS (oversold) areas are shaded. The RSI can remain in an OB or OS state for a prolonged period and while some people use OB and OS as a reversal signal I use it as a strong trend indication and recognize it will not last forever. You can SET the OB and OS levels with inputs.
---- USER INPUTS
Paint Bars: Turns on/off the candle coloring. Default is OFF.
Iron Condor Settings: Defaults are what I use and can be used as a guide.
Criteria: Trend, moving averages, and RSI settings can all be adjusted.
---- SETUP & HINTS
Add "Jerry J8 30-123 SPY Scalping PRO” indicator to show bull and bear signals
Add "Jerry J8 MACD Optimal Entry Zone” indicator to show best MACD range for entry
I also like to add "Jerry Momentum Dream" indicator to see the momentum
With this indicator we’re looking for the 30, 1, 2, and 3 criteria to be met which increases our likelihood of success. IMPORTANT. Never automatically enter a position without reviewing the other indicators and drawing your own conclusions. You want to choose the entries that are the most appealing to you that take into account volume, time of day, and risk/reward. Positions should be closed based on your risk/reward goals.
Indicators are not a magic pill and should be used to support trading decisions, not to make them for you. Past performance is not a guarantee of future returns. The results of individual stocks/indexes with any strategy do not constitute proof they will repeat in the future.
DISCLAIMER: The information contained in our scripts/indicators/ideas does not constitute financial advice or a solicitation to buy or sell any securities of any type. Trading and investing in the stock market and cryptocurrencies involves substantial risk of loss and is not suitable for every investor. I’m NOT a financial adviser. All trading strategies are used at your own risk.
Please Use the AUTHOR’s INSTRUCTIONS link below for more information.
NOTE: The PERFORMANCE SUMMARY below does not accurately reflect the trading strategy because the entry orders generated in the strategy are based on the stock price and our actual order is a credit spread that is profitable even if the price moves against us a little bit. What could show as a loss in the strategy could be a profit in the credit spread.

Jerry J8 30-123 SPY Scalping PROPlease watch the J8 Scalping Tutorial Video below for a walkthrough on how these indicators work.
---- STRATEGY
This study project is designed for scalping options that expire daily with bull put and bear call credit spreads on a 3 minute chart. The name 30_123 is a reference to 4 main criteria being met to give a green light for a potential trade. The 4 main criteria:
*30 = 30 minute trend
*1 = 3 minute trend
*2 = Moving average criteria
*3 = RSI criteria
4 = Secondary trend. Bonus if in sync but not a requirement.
* The strategy also utilizes momentum as a criteria.
This indicator is designed to trade options that expire daily including the SPY, IWM, QQQ, and NDX.
When 30_123 conditions are all green and all criteria are met a bull signal is created.
When 30_123 conditions are all red and criteria are met a bear signal is created.
The bull and bear signals are based on the stock/index price; BUT the actual orders are for option spreads that are normally based on a delta of approximately .15 to .25.
For example, if the SPY is at 400 we could have an order to sell a BULL PUT CREDIT SPREAD and I would likely sell the 398p and buy the 397p; The 398p delta would be approximately -.2. The spread position profits with any close over 398 and/or can be closed early with a bullish price move. IMPORTANT: If the SPY closed the day at $399 on the chart it would look like a loss based on the buy and sell orders but the spread would be a full profit since the close was above 398.
This script is used in conjunction with Jerry J8 30-123 Spy Scalping Dashboard Pro indicator which is the dashboard to give a visual for the 4 main criteria and makes things easier to understand.
---- TRADING TIME FRAME
The default time frame is 10:00 - 15:57 and can be controlled by the user. I do not enter trades in the first 30 minutes since that can be a very volatile period and you can easily configure the indicator and trading time frame based on how you trade.
---- MAJOR USER INPUTS
Paint Bars: Turns on/off the candle coloring for the trend
Exits: Open orders can be closed with 3 different exit criteria and all should be left on. These exits are needed to provide multiple entry signals throughout the day. However, you want to close the spreads based on your own criteria and not on the indicator.
Criteria: Trend, moving averages, RSI settings, and trading time frames can all be adjusted.
---- SETUP & HINTS
Add "Jerry J8 30-123 Spy Scalping Dashboard Pro” indicator to show J8 criteria dashboard
Add "Jerry J8 MACD Optimal Entry Zone” indicator to show best range of entry
I also like to add "Jerry Momentum Dream" indicator to see the momentum
With this indicator we’re looking for the 30, 1, 2, and 3 criteria to be met which increases our likelihood of success. IMPORTANT. Never automatically enter a position without reviewing the other indicators and drawing our own conclusions. You want to choose the entries that are the most appealing to you that take into account volume, time of day, and risk/reward. Positions should be closed based on your risk/reward goals.
Indicators are not a magic pill and should be used to support trading decisions, not to make them for you. Past performance is not a guarantee of future returns. The results of individual stocks/indexes with any strategy do not constitute proof they will repeat in the future.
DISCLAIMER: The information contained in our scripts/indicators/ideas does not constitute financial advice or a solicitation to buy or sell any securities of any type. Trading and investing in the stock market and cryptocurrencies involves substantial risk of loss and is not suitable for every investor. I’m NOT a financial adviser. All trading strategies are used at your own risk.
Please Use the AUTHOR’s INSTRUCTIONS link below for more information.
NOTE: The PERFORMANCE SUMMARY below does not accurately reflect the trading strategy because the entry orders generated in the strategy are based on the stock price and our actual order is a credit spread that is profitable even if the price moves against us a little bit. What could show as a loss in the strategy could be a profit in the credit spread.
Setup Max e Min Larry WilliansLarry Williams used this system to win the trading championship
Hello friends, I bring a script with a trading strategy to be used in futures such as Index, Forex and Commodities. Developed by famous trader Larry Williams.
In them we use two 3-period Simple Moving Averages (Arithmetic) (one with the high price, the other with the low price), and a 21-period Moving Average (Arithmetic) to determine the trend. This will form an average channel with the prices of the maximums and minimums of the last three candles.
Best time charts use the strategy: from 5 minutes to 60 minutes.
This strategy is quite simple. The 21 Moving Average will color according to the trend (Green for bullish, Red for bearish and Gray for transitions). The Script will signal the entry according to the trend by the colors of the candles and also by the signal:
When green, the buy will be on the crossing of the lower Moving Average crossing the candlestick, and the exit will be on the crossing of the candlestick on the next Upper Moving Average.
When red, the sell will be at the crossing of the Upper Moving Average crossing the candlestick, and the exit will be at the crossing of the candlestick on the next Lower Moving Average.
When the Script signals the candle with a purple X, it means that the trend is changing and the entire open operation must be closed.
This system has no Stop, so be careful when using it.
Na linguagem do autor:
Larry Williams usou esse sistema ganhar campeonato de trade
Olá amigos, trago um script com uma estratégia de trade pra ser usada em futuros como Índice, Forex e Commodities. Desenvolvido pelo famoso trader Larry Willians.
Neles usamos duas Médias Móveis Simples (Aritmética) de 3 períodos (uma com o preço da máxima, outra com o preço da mínima), e uma Média Móvel (Aritmética) de 21 períodos para determinar a tendência. Nisso vai formar uma canal de médias com os preços das máximas e mínimas dos últimos três candles.
Melhores tempos gráficos usar a estratégia: de 5 minutos até 60 minutos.
Essa estratégia é bem simples. A Média Móvel de 21 irá colorir de acordo com a tendência (Green pra alta, Red para baixa e Gray para transições). O Script irá sinalizar a entrada de acordo com a tendência pela cores dos candles e também pela sinalização:
Quando green, a compra será no cruzamento da Média Móvel inferior cruzando o candle, e a saida será no cruzamento do candle na Média Móvel Superior seguinte.
Quando red, a venda será no cruzamento da Média Móvel Superior cruzando o candle, e a saida será no cruzamento do candle na Média Móvel Inferior seguinte.
Quando o Script sinaliza o candle com X purple, significa que a tendência está em mudança e deve ser fechada toda a operação em aberto.
Este sistema não possui Stop, portando cuidado quanto a seu uso.

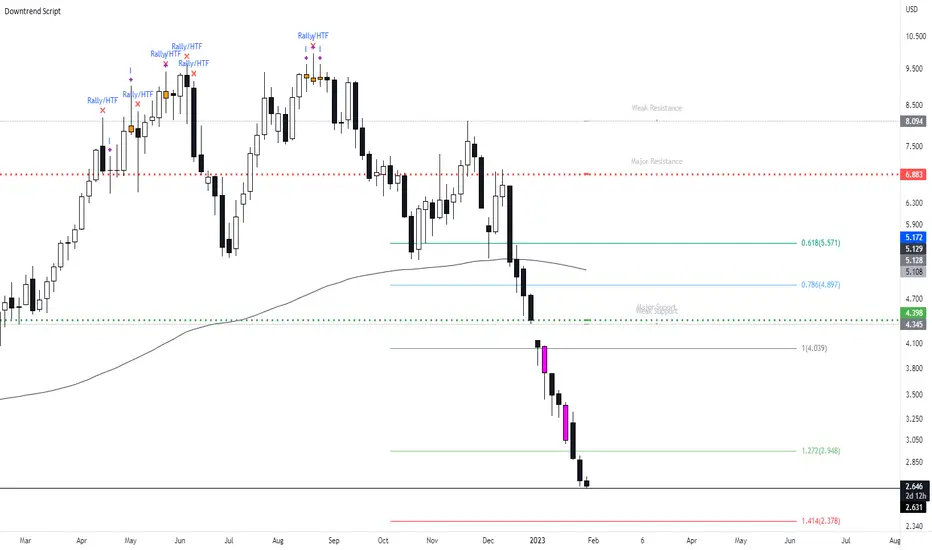
New Bearish Downtrend Script - Perfect for Short SellingIts been a while since i last uploaded a script, what i have for you today is a script which works very efficiently for downtrends and spotting reversals. This is a script i use on a weekly basis when looking to short sell.
This script includes :
Updated** Rally Candles for HTF and LTF ( End of Impulsive move signal) - The psychology of the candle when used with market information can be viewed as a end or near to the end of a big impulsive leg - when this candle occurs in BEARISH CONDITIONS, we can assume price is likely to move away short term.
Major and Minor Support Levels HTF (Areas of interest)
The Psychology on these levels is price will do something at these key levels - it takes in the last quarter price action of High Open Low Close to generate the price levels and when price comes into these areas we are likely to see a bounce or rejection from this area.
Bearish Breakout Volume Candle - This candle will paint a Purple colour bar when volume breaks above the 7day average - this shows strong momentum in the market and will usually be seen when price is in a downtrend with strong momentum.. However when this does occur we can expect a short term bounce or base so don't trade the volume bar alone.
Indecision Candles - Psychology of this candle is to show exhaustion in the trend and ideally what to see this candle appear with Rally Candles at key areas for stronger set up. When the trend is moving up, the bearish doji can appear - i tend to look at this situation as a pause in the trend.
200 EMA
Everything in this script has alert conditions to provide an edge in the markets
This is an example of how the script will look on the HTF I'm using the Daily Timeframe for reference on TSLA
This is an example of how the script looks like on the LTF, price hit the Major Resistance twice and failed to hit the 3rd time and on each leg of the impulse, the chart portrayed the LTF Rally Candles
Heres an example on how to use both Major Resistance ( Area of Interest) Rally Candle and Volume Breakout as a trade set up idea - This setup idea was on Crude Oil last week and into this week.
When added to confluences such as Supply Zones, Mitigation Levels, Quasimodo patterns etc... this will enhance the script.
I will answer any questions if i haven't made the script clear or take any requests to improve the script.
Also will be uploading the Bullish Uptrend Script soon.
Moving Average DistanceLook at the chart bars as they relate to distance from a specified moving average.
You can pick from SMA/EMA/etc.

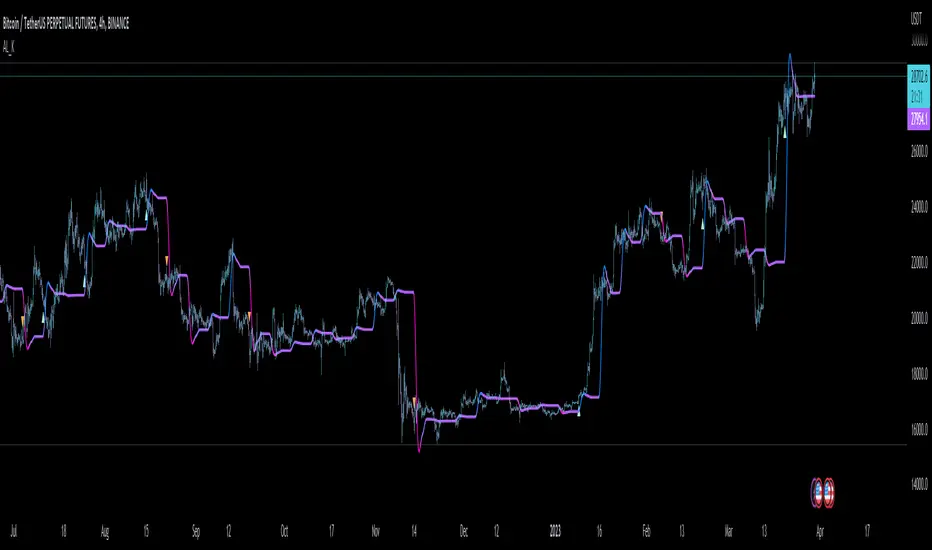
Fibonacci Step IndicatorThe Fibonacci Step Indicator assumes irregularity in calculating a moving average. It is measured as the mean of the previous lows and highs situated at Fibonacci past periods. For example, the mean of the lows from 2, 3, 5, 8, etc. periods ago form the Fibonacci step indicator.
The indicator uses the formula for the first twelve Fibonacci numbers on highs and lows so that it creates a moving support/resistance zone. Afterwards, the zone is stabilized by taking the highest highs of the upper indicator and the lowest lows of the lower indicator part.
The indicator is used as a trend following way. It can be compared to the Ichimoku Kinko Hyo cloud (without the future projection). The zone form a support and resistance area. During ranging periods, the market will fluctuate within the area which is a bad time to follow the trend (if any).

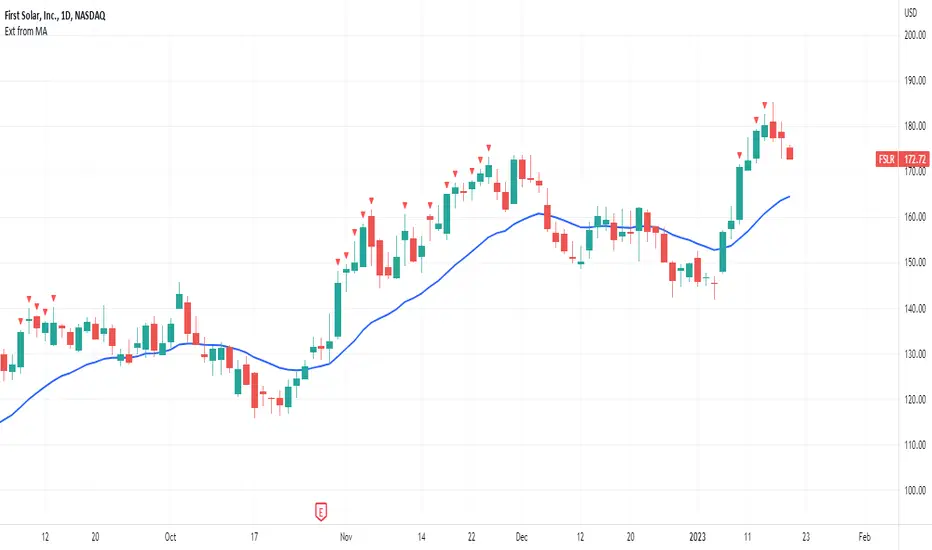
Extended from Moving AverageThis indicator helps avoid chasing extended stocks by showing every time a stock is too far extended from a selected moving average.
Features:
✔️ selectable moving average and source (high, low, close)
✔️ choose to plot or hide the moving average
✔️ selectable distance to be considered too extended
Power Indicator - EMAs + VWAP + Volume BarThe Power Indicator is intended to return some exponential moving average, vwap, volume bar, and others. With this compilation, you will be able to use them as one indicator in Trading View.
The components are:
- EMA9 - Exponential Moving Average of 9 days
- EMA21 - Exponential Moving Average of 21 days
- EMA50 - Exponential Moving Average of 50 days
- EMA200 - Exponential Moving Average of 200 days
- Volume Bar - This indicator provides the volume of the candle and its strength by showing different colors. It's a way to check expressive volume in one bar.
- Vwap line
- Indicator
If you have any questions, let me know!