RedK K-MACD : a MACD with some more musclesMoving Averages are probably the most commonly used analysis tools, and MACD is possibly the first charting indicator a trader gets to learn about.
MACD Basic concept
----------------------------
Without repeating all the tons of documentation about what MACD does, let's quickly re-visit the MACD concept from a 10-mile altitude (note we're keen on simplifying here rather than being technically accurate - so please forgive the use of any "common lingos")
- MACD goal is to represent the distance between 2 Moving Averages (MAs) - one fast and one slow, relatively - as an unrestricted zero-based oscillator.
- The value of the main MACD line is the distance, or the displacement between the 2 MA's
- usually a signal line is used (which is another MA of that distance value) to enable better visualization of the change (and rate of change, since this is all depicted on a time axis) of that displacement - this represents price momentum (price movement in the recent period versus movements for a relatively longer period).
- the difference between the main MACD line and its signal is then represented as a histogram above and below the zero line. in this case, that histogram is really redundant, since it shows a value that is already represented visually by the main line and its signal line.
How K-MACD is different
---------------------------------
K-MACD takes that simple concept of the classic MACD and expands around it - the idea is to use the same simple approach to representing price momentum while bringing in more insight to price moves in the short, medium and long terms, ability to represent more than 2 MA's and to enable better identification of tradeable patterns (like Volatility Contraction and others) - while still keeping things simple and visually clean.
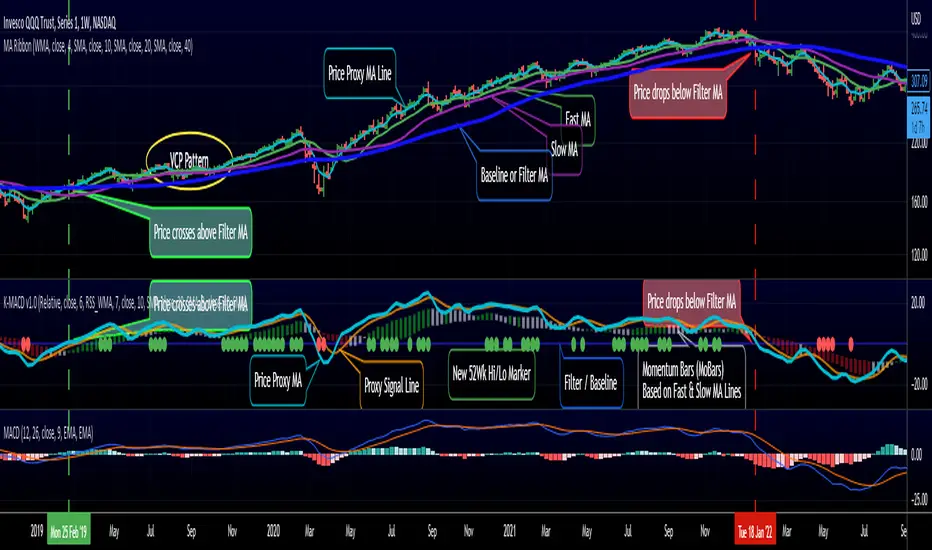
K-MACD is an indicator that allows us to view how price moves against 3 moving averages: a fast / slow pair, and a "market" Filter or Baseline (very long) that will be used as a flag for Bear/Bull market mode. Many traders and trading literature use the 200 day (40 week) SMA as that key filter
so in total, there are 4 MA lines in K-MACD (excluding the "orange" signal line):
* Price Proxy: Which is a very fast moving average that will represent the price itself - let's use a WMA(3) or something close to that here - there will be a signal line to enable better visualization of this similar to a classic MACD - that's the orange line
* Fast & Slow MA's : Use whatever represents the "medium term" momentum for your trading - Some traders use 20 and 50, others use 10 and 20 .. if on your price chart, you keep using a pair of MA's for this, use the same settings in K-MACD - these will be represented by the 3-color Momentum Bars that fluctuate above and below the baseline
* Filter/Baseline MA: Should be your long (Bullish/Bearish Mode) MA. so 100 or 200 or any other value you consider your market to be bearish below and bullish above. on K-MACD this is actually the blue zero line - everything else is "relative" to it
Review the sample chart which explains various elements and the "price chart" setup that K-MACD represents. With K-MACD you can clean up your chart from those various Moving Averages - or use a different set than the ones you already have K-MACD represent - or other indicators (like ATR channels..etc)
Other "muscles" in the K-MACD
---------------------------------------------
- Relative vs Classic Calculation Mode
A key issue with the classic MACD is that the displacement between the 2 moving averages is represented as "absolute or direct" values - as the price of the underlying increases with time, you can't really use these values to make useful comparison between the past and now (see below example) - also you can't use them to compare 2 different instruments.
- The "Relative" calculation option in K-MACD addresses that issue by relating all "distances" to the Baseline MA as percentage (above or below) - you can see this clear when you look at the above chart the far left versus the far right and compare K-MACD with the classic MACD - the Classic option is still available
- More MA "type" options for all MA lines: choose between SMA, EMA, WMA, and RSS_WMA (which i use a lot in my trading and is my default for the Price Proxy)
- More Alerts: a total or 9 alerts (in 3 groups) are available with K-MACD (Momentum above or below baseline, Price Proxy crossing signal line, and Price Proxy crossing baseline)
- New 52 week High / Low markers: These will show as Green/red circles on the zero line in K-MACD. this will only work for 1D timeframe and above, i'm just using a simple approach and would like to keep it that way.
- i know i added some more features not covered above :) -- if you have questions about any of the settings, feel free to ask below
Closing thoughts
-------------------------
K-MACD is a combination of couple of indicators i published in the past (xMACD and Mo_Bars) - so you can go back and read about them if needed - I then added improvements to accommodate ideas from swing trading literature and common practices that i plan to focus on in future. So K-MACD is really part of my own trading setup.
I assume here that most traders are familiar with what a MACD is - so kept this post short - if you thing we should expand more about the concepts covered here let me know in the comments - i can make some separate posts with examples and more details.
I hope many fellow traders find this work useful - and feel free let me know in comments below if you do.
Movingaveragecrossover
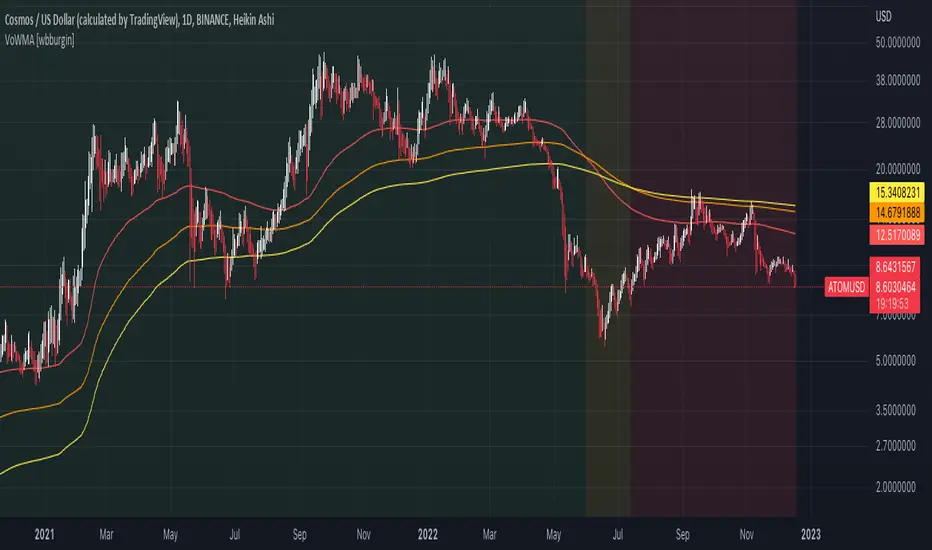
Volatility-Weighted Moving Average SystemThis simple script creates a moving average system weighted by volatility. The moving averages are less sensitive to price action than the typical moving averages we use, and their crossovers can be used to identify extended trends.
I've colored the background depending on trend. Ideally in the future, I'll draw long or short signals on-chart depending on the width between the bands, which works as a faster indicator of trend-change than crossover does.
Hope you all enjoy. Happy holidays.
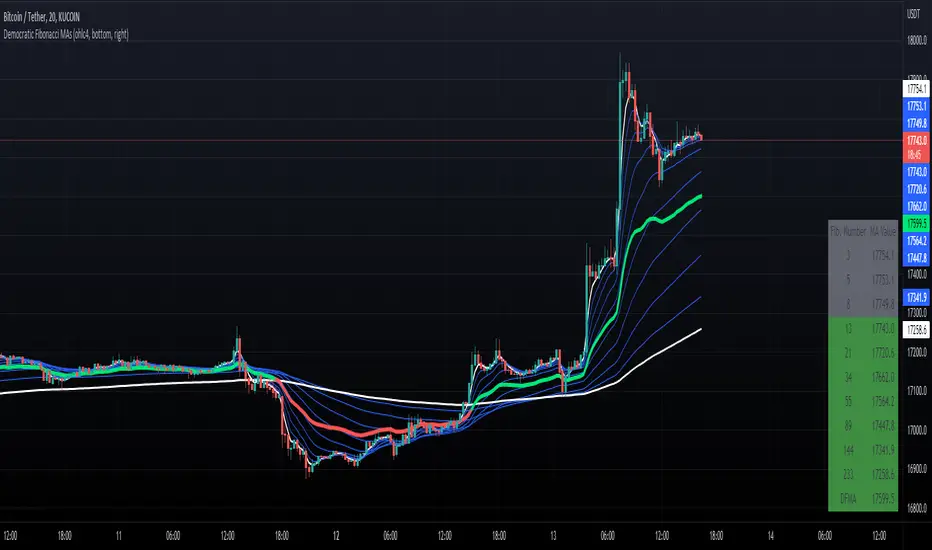
Democratic Fibonacci Moving AveragesWith this indicator, we have taken moving averages at Fibonacci lengths (3 to 233) as well as the average of these values, labeled the DFMA. Additionally, these values have been inputted into a table overlay. The cross of the FibMA(233) and the DFMA can be used as a signal for long or short.
The FibMA lengths of 3 and 233 are plotted in white by default, the FibMAs with lengths between 3 and 233 are plotted in blue by default, and the democratic line (DFMA) that averages these lines is plotted in green or red (depending on if the value is above or below the 233-length FibMA).
VWMA/SMA 3Commas BotThis strategy utilizes two pairs of different Moving Averages, two Volume-Weighted Moving Averages (VWMA) and two Simple Moving Averages (SMA).
There is a FAST and SLOW version of each VWMA and SMA.
The concept behind this strategy is that volume is not taken into account when calculating a Simple Moving Average.
Simple Moving Averages are often used to determine the dominant direction of price movement and to help a trader look past any short-term volatility or 'noise' from price movement, and instead determine the OVERALL direction of price movement so that one can trade in that direction (trend-following) or look for opportunities to trade AGAINST that direction (fading).
By comparing the different movements of a Volume-Weighted Moving Average against a Simple Moving Average of the same length, a trader can get a better picture of what price movements are actually significant, helping to reduce false signals that might occur from only using Simple Moving Averages.
The practical applications of this strategy are identifying dominant directional trends. These can be found when the Volume Weighted Moving Average is moving in the same direction as the Simple Moving Average, and ideally, tracking above it.
This would indicate that there is sufficient volume supporting an uptrend or downtrend, and thus gives traders additional confirmation to potentially look for a trade in that direction.
One can initially look for the Fast VWMA to track above the Fast SMA as your initial sign of bullish confirmation (reversed for downtrending markets). Then, when the Fast VWMA crosses over the Slow SMA, one can determine additional trend strength. Finally, when the Slow VWMA crosses over the Slow SMA, one can determine that the trend is truly strong.
Traders can choose to look for trade entries at either of those triggers, depending on risk tolerance and risk appetite.
Furthermore, this strategy can be used to identify divergence or weakness in trending movements. This is very helpful for identifying potential areas to exit one's trade or even look for counter-trend trades (reversals).
These moments occur when the Volume-Weighted Moving Average, either fast or slow, begins to trade in the opposite direction as their Simple Moving Average counterpart.
For instance, if price has been trending upwards for awhile, and the Fast VWMA begins to trade underneath the Fast SMA, this is an indication that volume is beginning to falter. Uptrends need appropriate volume to continue moving with momentum, so when we see volume begin to falter, it can be a potential sign of an upcoming reversal in trend.
Depending on how quickly one wants to enter into a movement, one could look for crosses of the Fast VWMA under/over the Fast SMA, crosses of the Fast VWMA over/under the Slow SMA, or crosses over/under of the Slow VWMA and the Slow SMA.
This concept was originally published here on TradingView by ProfitProgrammers.
Here is a link to his original indicator script:
I have added onto this concept by:
converting the original indicator into a strategy tester for backtesting
adding the ability to conveniently test long or short strategies, or both
adding the ability to calculate dynamic position sizes
adding the ability to calculate dynamic stop losses and take profit levels using the Average True Range
adding the ability to exit trades based on overbought/oversold crosses of the Stochastic RSI
conveniently switch between different thresholds or speeds of the Moving Average crosses to test different strategies on different asset classes
easily hook this strategy up to 3Commas for automation via their DCA bot feature
Full credit to ProfitProgrammers for the original concept and idea.
Any feedback or suggestions are greatly appreciated.

Munich GuppyWELCOME to the Munich Guppy!
This is a simple moving average indicator that will help you determine the trend of your chart using historical moving averages.
The indicator consists of 3 EMA's and one ALMA moving average. Using these 4 moving averages I have programmed the relationship between the moving averages to color the background of your chart.
If your background is red, this means that the alma moving average has fallen below the EMA's (EMA1 and EMA 2) as well as (EMA 1 and EMA 2) are postured in a down trending/up trending fashion
For example, the 21EMA is greater than the 55EMA, this signals that the chart has been outperforming its intermediate averages. Now if the ALMA is below both the 21ema and 55ema, in this instance, your chart background will become green.
The ALMA has color options '+CoC' and '-Coc', this simply means if the candle closes below the alma, it will turn red, if closure above it will turn green.
EMA 3 which is default set to 200, has no affect on the color of the background.
Now I hope I have thoroughly explained the simplicity of this indicator, if you have any questions leave them below or private message me for any other requests,
Good Trading!
-CheatCode1

MA Cross ScreenerThis script lets you pick 20 symbols to check for ma crosses. The way it works is it scans all 20 of your symbols for moving average crosses and then it sends an both a regular alert and a visual alert inside of the indicator. I found that ma cross strategies are very popular right now so I thought it would be nice to have one indicator instead of 20 discord servers. The features include: 20 custom symbols, alerts, custom colors, ma select, and custom time frames. If you want to use the custom time frame option, use the lowest time frame possible. That way you wont have gaps. If you have any comments please voice them, that includes suggestions!
I hope you all find this useful!

The Godfather
This indicator uses a custom MA as well as RSI bar-flips, as a form of pivot point, to signal the direction of the trend.
The triangle markers on the chart are the RSI flipping from negative to positive, and vice versa.
The lighter shaded candles are up candles, the darker shaded candles are down candles.

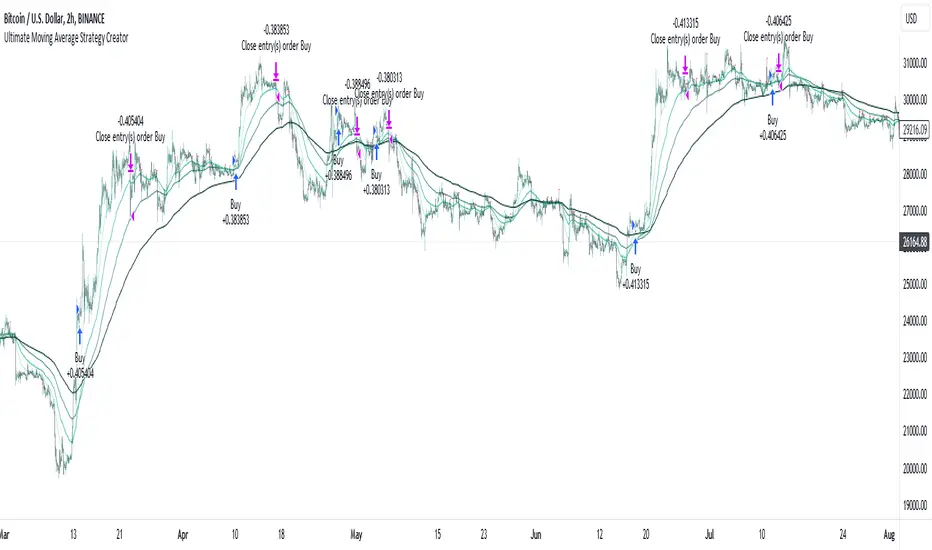
Ultimate Moving Average Strategy CreatorHave you ever wanted to create your OWN strategy, but don't have coding experience? Well now you can.
With simple settings, but millions of potential strategies and combinations, this indicator / strategy lets YOU make ALL the rules.
Start by choosing up to 4 moving averages from all the various types - Simple, Exponential, Hull, Volume-Weighted, etc. Choose the period and choose price source.
Now the fun part.
You select your values to compare and how to compare them. Want to test if the Fast Moving Average crosses over the Slow Moving Average? No problem. Want to add an additional test to check the closing price is greater than the Fast Moving Average? Done.
With additonal options to set take profit % and stop loss %, as well as a date range and the option for 'Long Only' positions, you can instantly see the results of any strategy in the strategy tester, then simply make an adjustment and refine the criteria without having to know or understand any of the complex coding and scripting.
I have tried many popular moving average strategies, but irrespective of the results, the thing that stood out to me was how inflexible they were. If it was designed to test a triple crossover, that's all it could do. With this indicator, literally anything is possible and modifying the parameters couldn't be easier.
Dynamically Adjusting EMA Crossing
The Exponential Moving Average is the most commonly used indicator in every market. but no one can predict which pair of exponential moving average crossing will work best together. Every instrument require different EMAs crossing. It can be 2 EMA crossings or 3 EMA crossings.
Dynamically Adjusting EMA crossing tries to solve this issue. Algorithm finds the optimal EMA crossing setting for every instrument across all timeframes based on the EMA lengths provided in the settings. It evaluates the most profitable crossing combination for each instrument. The logic backtests the different combinations of EMA crossing based on the EMA lengths provided in the indicator's settings.
There are 3 EMA options in the settings Fact, Slow and Long. Indicator's Settings have the option to choose 2 EMA crossings or 3 EMA crossings.
Default Settings
Fast : 5 to 10
Slow : 13 to 19
Long : 20 to 60
Please do keep in mind that the performance of the indicator reduces as we increase the default settings range.
Please contact me for access

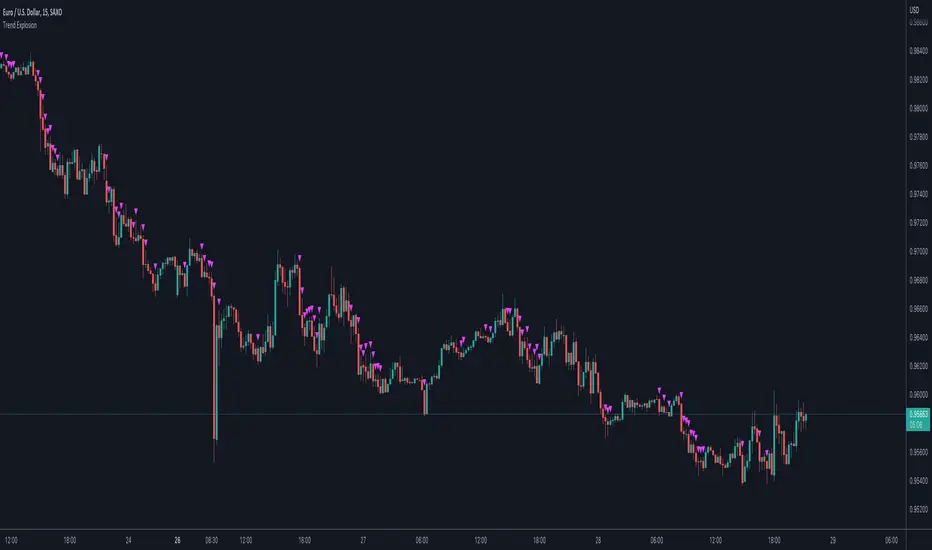
Trend ExplosionThis script features a combination of trend indicators. Upon backtesting various indicators and how price action reacts to past signals, I discovered that using a combination of conditions would allow for a simple, easy-to-use, yet (in my opinion) accurate representation of current market sentiment. I typically use this on the 5/15 minute charts as I reference higher timeframe conditions. If you would like to trade the 1 hour and above timeframes, you would have to manually adjust the timeframe you want under "Resolution". Another thing to note is that this script provides a REFERENCE for trends. It does not provide entry and exit signals and you would have to discretionarily determine those yourself.
Long sentiment = Green triangles below the bar
Short sentiment = Fuchsia triangles above the bar
Due to a large amount of effort and time taken into creating this script, I have decided to protect the source code. If you do have any suggestions, you can feel free to drop me a DM.
MA Simple Strategy with SL & TP & ATR FiltersHello Guys! Nice to meet you all!
This is my second script!
This Logic is trend following logic, This detects long & short trends by comparing the value of MAs.
This fits to the longer time frame.
### Long Condition
1. Compare 4 MAs (you can chose MA Type)
- Shortest MA (MA 1)
- Shorter MA (MA 2)
- Normal MA (MA 3)
- Longer MA (MA 4)
2. If MA 1 > MA 2 > MA 3 > MA 4, then Enter Long Position
- ‘The arrangement of MAs in descending orders’ is the proxy of the long trend.
### Short Condition
1. Compare 4 MAs (you can chose MA Type)
- Shortest MA (MA 1)
- Shorter MA (MA 2)
- Normal MA (MA 3)
- Longer MA (MA 4)
2. If MA 1 < MA 2 < MA 3 < MA 4, then Enter Short Position
- ‘The arrangement of MAs in ascending orders’ is the proxy of the short trend.
### Close Condition
1. When trend Changes
- When (MA 1 > MA 2 > MA 3 > MA 4) breaks or (MA 1 < MA 2 < MA 3 < MA 4) breaks.
2. When the price hits the stoploss
3. When the price hits the take profit level (basically 50% of qty will be closed)
### Etc
1. Trend filter (ATR should be bigger than SMA of ATR)
- If the volatility of price is to small (ATR), then there could be false signal. To filter this out, I used the condition ‘ATR should be larger than SMA of ATR’.
2. Stoploss
- Enabled Stoploss based on ATR, Percent, Risk-Reward Ratio,
- Enabled Trailing Stoploss.
3. Choose MA Type
- You can choose MA Type
+ Thanks for the stoploss template @jason5480

RSI with Slow and Fast MA Crossing Strategy (by Coinrule)This strategy utilises 3 different conditions that have to be met to buy and 1 condition to sell. This strategy works best on the ETH/USDT pair on the 4-hour timescale.
In order for the strategy to enter the trade, it must meet all of the conditions listed below:
ENTRY
RSI increases by 5
RSI is lower than 70
MA9 crosses above MA50
To exit a trade, the below condition must be met:
EXIT
MA50 crosses above MA9
This strategy works well on LINK/USDT on the 1-day timeframe, MIOTA/USDT on the 2-hour timeframe, BTC/USDT on the 4-hour timeframe, and BEST/USDT on the 1-day timeframe (and 4h).
Back-tested from 1 January 2020.
The strategy assumes each order is using 30% of the available coins to make the results more realistic and to simulate you only ran this strategy on 30% of your holdings. A trading fee of 0.1% is also taken into account and is aligned to the base fee applied on Binance.

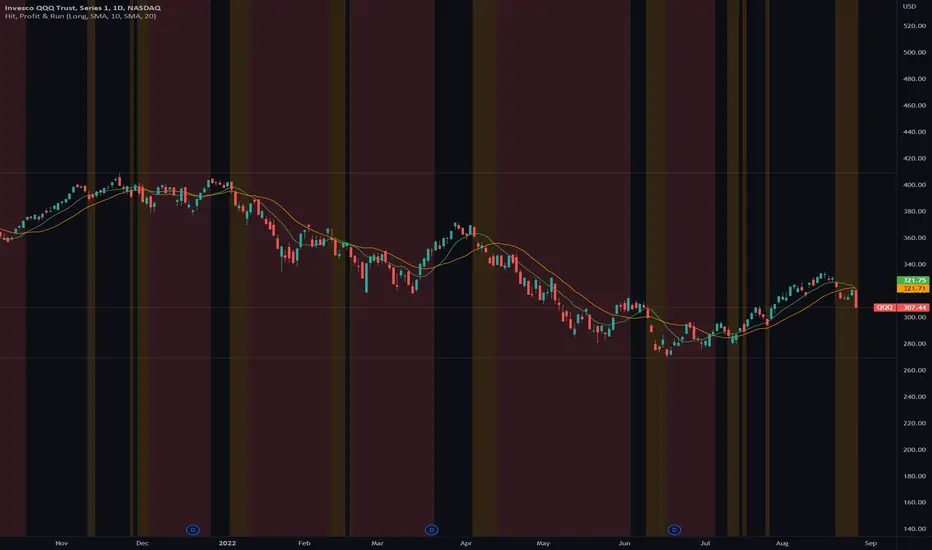
Hit, Profit & RunThis indicator helps traders to identify up-/down trends and see early warning signs when a stock or an index changes its current trend.
With a fast and a slow moving average the trader can define a moving average combo that starts an uptrend when the fast moving average line moves above the slow moving average line and ends its uptrend, when the fast moving average line goes below the slow moving average.
The trader can define a background color for the uptrend and downtrend as well as a take profit zone that is generated, when the price falls below the fast moving average line. With a short and long mode the colors and take profit zones change accordingly.
Market based maximum exposure PT rules:
■ Fast MA > Slow MA = Hit Area (no color)
■ Price < Fast MA = Take Profit Area (yellow color)
■ Fast MA < Slow MA = Run Area (red color)
Features
■ Use SMA or EMA crossovers
■ Define the length of the fast and short MA
■ Plot the fast and short MA
■ Switch between Long or Short mode
■ Hide or show the areas of your choice
■ Multipe customize options
Simple Buy Sell SignalsIt is a simple indicator that provides buy or sell signals based on the intersection of two EMAs and a simple moving average (SMA). once the Relative Strength Index has confirmed it. For greater accuracy, add additional indicators like stochastic RSI, MACD, etc. Use only for intraday trading, Not for Positional Trading

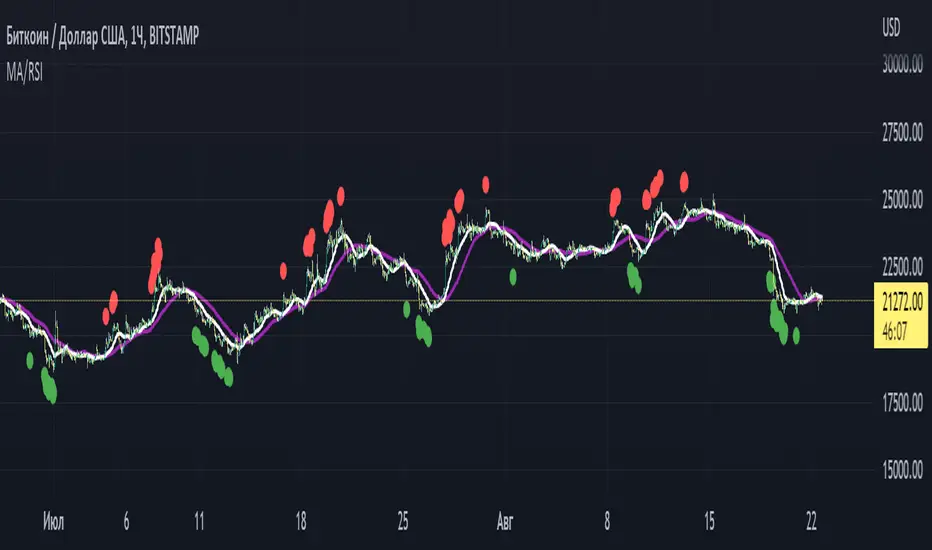
Pranoyama MA/RSI toolEng: The indicator highlights the overbought and oversold RSI levels on the bars. Also draws two moving averages: sma or ema. The RSI levels, the type of moving averages and their period are set by the user.
Rus: Индикатор подсвечивает на барах уровни перекупленности и перепроданности по RSI, а так же рисует две скользящие средние на выбор: sma или ema. Уровни RSI, тип скользящих средних и их период устанавливаются пользователем.
p.s. Это адаптация ранее опубликованного мной индикатора
Fast v Slow Moving Averages Strategy (Variable) [divonn1994]This is a simple moving average based strategy that takes 2 moving averages, a Fast and a Slow one, plots them both, and then decides to enter a 'long' position or exit it based on whether the two lines have crossed each other. It goes 'long when the Fast Moving Average crosses above the Slow Moving Average. This could indicate upwards momentum in prices in the future. It then exits the position when the the Fast Moving Average crosses back below. This could indicate downwards momentum in prices in the future. This is only speculative, though, but sometimes it can be a very good indicator/strategy to predict future action.
I've tried some strategy settings and I found different promising strategies. Here are a few:
BTCUSD ( BitStamp ) 1 Day Timeframe : EMA, Fast length 25 bars, Slow length 62 bars => 28,792x net profit (default)
BTCUSD ( BitStamp ) 1 Day Timeframe : VWMA, Fast length 21 bars, Slow length 60 bars => 15,603x net profit
BTCUSD ( BitStamp ) 1 Day Timeframe : SMA, Fast length 18 bars, Slow length 51 bars => 19,507x net profit
BTCUSD ( BitStamp ) 1 Day Timeframe : RMA, Fast length 20 bars, Slow length 52 bars => 5,729x net profit
BTCUSD ( BitStamp ) 1 Day Timeframe : WMA, Fast length 29 bars, Slow length 60 bars => 19,869x net profit
Features:
-You can choose your preferred moving average: SMA , EMA , WMA , RMA & VWMA .
-You can change the length average for each moving average
-I made the background color Green when you're currently in a long position and Red when not. I made it so you can see when you'd be actively in a trade or not. The Red and Green background colors can be toggled on/off in order to see other indicators more clearly overlayed in the chart, or if you prefer a cleaner look on your charts.
-I also have a plot of the Fast moving average and Slow moving average together. The Opening moving average is Purple, the Closing moving average is White. White on top is a sign of a potential upswing and purple on top is a sign of a potential downswing. I've made this also able to be toggled on/off.
Let me know if you think I should change anything with my script, I'm always open to constructive criticism so feel free to comment below :)

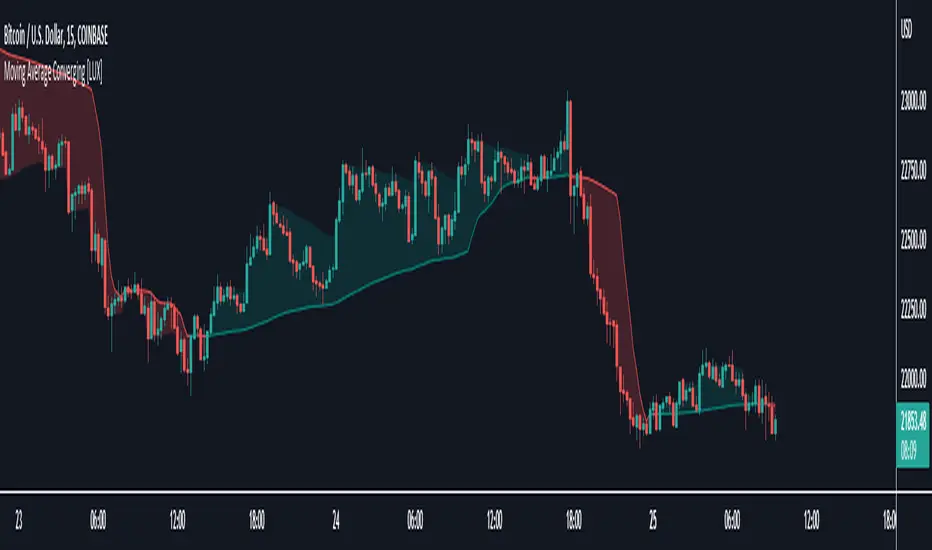
Moving Average Converging [LuxAlgo]This indicator returns a moving average converging toward the price the more a trend makes new higher-highs or lower-lows depending on the detected trend.
Settings
Length: Controls the initial moving average smoothing factor ( 2 / (Length + 1) ), as well as the period of rolling maximums/minimums.
Increment: Smoothing factor increment ( 2 / (Increment+ 1) ) for new higher-high/lower-low, lower values would return a faster converging moving average.
Fast: Fast moving average smoothing factor.
Usage
The proposed moving average can be used like most slow moving averages.
Having a moving average able to converge closer to the price the longer a trend lasts allows users to obtain more timely crosses. This practice can remind us of the Parabolic SAR or our TRAMA indicator:
Notice on the chart above how the moving average converges at an increasing rate with the occurrence of new high-highs/lower-lows.
3C Crossover with TTP & TSLThis is not a set and forget strategy. It needs constant tweaking to maintain a high winrate. Also what works on one pair can be horrible on another.
This strategy works best on the 1 min or 5 min TF but also works well on the 15 min. Haven't done any testing in higher TF's as im only interested in scalping.
If enabled you can retrive data for the filters on any TF.
The strategy do not repaint.
You do not need a 3c subscription to run this strategy as the bot turns on and off the bot itself.
Instructions for the 3commas connector:
1. First, you need to prepare 3commas Long/Short bots that will only listen to custom TV signals.
2. Inputs for the 3commas bot can be found at the end of the user inputs.
3. Once you have entered the required details into the inputs, turn on 3commas comments. They should appear on the chart (looks messy).
4. Now you can add the alert where you should paste the 3commas Webhook URL: 3commas.io
5. For the alert message text insert the placeholder {{strategy.order.comment}} and delete the rest. 6. Once the alert is saved, you can turn off those 3commas comments to have a clearer chart.
7. With a new alert, the bot and trade should launch.
Long or Short trades are determined with a crossing of the fast MA over the slow MA for Long and the opposite for Short. By checking Close position on MA cross the deal will close on a crossover/under of the 2 MA's
You can select from various different MA's and of course lenghts. You can add both EMA filter on any lenght aswell as ATR to determine to go long or short.
Using the MA gap can help you to not enter trades in a low volatile ranging market.
The RSI filter, sets the maximum RSI threshold for a long position and the minimum for a short. By default and what i recomend is that you enter Longs when RSI is above 50 and shorts when RSI are below 50.
-You can set confirmation of the trade direction with RSI , i.e. for Long the RSI must rise a specified number of bars back, vice versa for Short.
Enabling the pullback filter is great to avoid Longing tops and Shorting bottoms.
Stop loss can be set be either a fixed percentage or by using ATR
Take profit can be set by using percentage, ATR or RiskReward ratio(RR). if you use ATR as a stoploss i recomend using RR as the TP.
Yu can choose to trail the TP with either Percentage or ATR
Whats ahead. I really want to incorporate RSI divergencies, but haven't figured out how yet. Any other ideas would be greatly appreciated.
Have a look at my other strategies. They are similar to this but works abit differently.

3C MACD & RSI Scalper no repaintThis is not a set and forget strategy. It needs constant tweaking to maintain a high winrate. Also what works on one pair can be horrible on another.
This strategy works best on the 1 min or 5 min TF but also works well on the 15 min. Haven't done any testing in higher TF's as im only interested in scalping.
If enabled you can retrive data on the MACD and RSI from any timeframe.
The strategy do not repaint.
You can filter on sessions as well as days. Often trading during say only the EU times and not trading during weekends yields better results. This is because weekeds and eg. the Asia Sessions are alot less volatile.
You do not need a 3c subscription to run this strategy as the bot turns on and off the bot itself.
Instructions for the 3commas connector:
1. First, you need to prepare 3commas Long/Short bots that will only listen to custom TV signals.
2. Inputs for the 3commas bot can be found at the end of the user inputs.
3. Once you have entered the required details into the inputs, turn on 3commas comments. They should appear on the chart (looks messy).
4. Now you can add the alert where you should paste the 3commas Webhook URL: 3commas.io
5. For the alert message text insert the placeholder {{strategy.order.comment}} and delete the rest. 6. Once the alert is saved, you can turn off those 3commas comments to have a clearer chart.
7. With a new alert, the bot and trade should launch.
Long or Short trades are determined with a crossing of the fast MA over the slow MA for Long and the opposite for Short. Trades should only happen close to the crossovers.
You can select from various different MA's and of course lenghts. I often find that using HEMA as the fast MA and DEMA as the slow give more trades while also maintaining a high winrate.
Then for Long we use the MACD indicator where we look for high peaks in negative values for Long and vice versa for Shorts. These should be significantly higher than other peaks (or if you will lower peaks for a Long).
The key is to detect high peaks on the histogram, which we will try to achieve by checking if the last 2 values were higher than X bars back. If you want to make it even more specific, then you can turn on the additional checkbox which compares the current value to the average value of X bars back, and if it is greater than, say, 72% the value of the average then it's ok to enter the trade.
The RSI filter, sets the maximum RSI threshold for a long position and the minimum for a short. By default and what i recomend is that you enter Longs when RSI is above 50 and shorts when RSI are below 50.
-You can set confirmation of the trade direction with RSI, i.e. for Long the RSI must rise a specified number of bars back, vice versa for Short.
Enabling the pullback filter is great to avoid Longing tops and Shorting bottoms.
Whats ahead. I really want to incorporate RSI divergencies, but haven't figured out how yet. Any other ideas would be greatly appreciated.
Have a look at my other strategies. They are similar to this but works abit differently.
The 3 strike line and the engulfing candles are not something that has an impact on the script yet, and might never be. But i do like to turn them on for a visual to see if the trade the strategy opened is a good one.

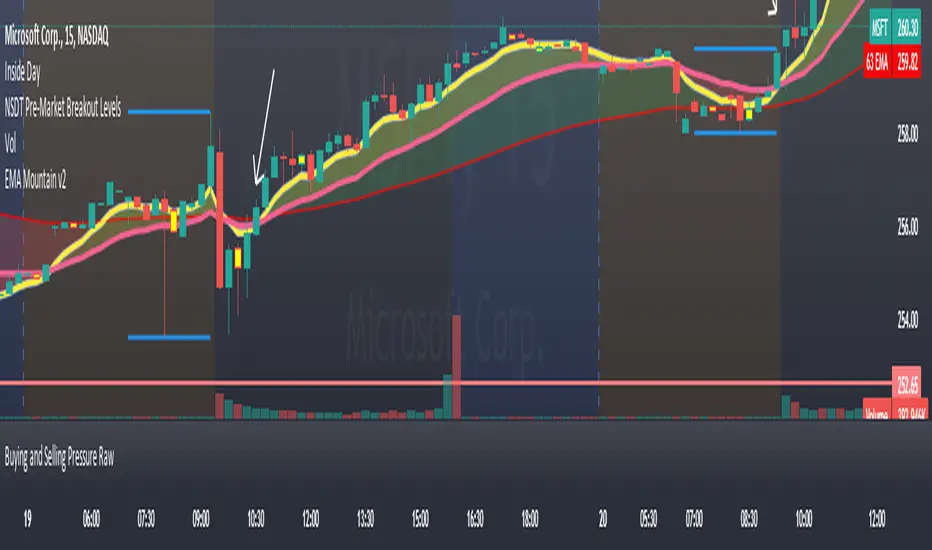
EMA Mountains Use this to track the daily moving avg's on the 15m chart.
by default it is set to be used on ext hours.
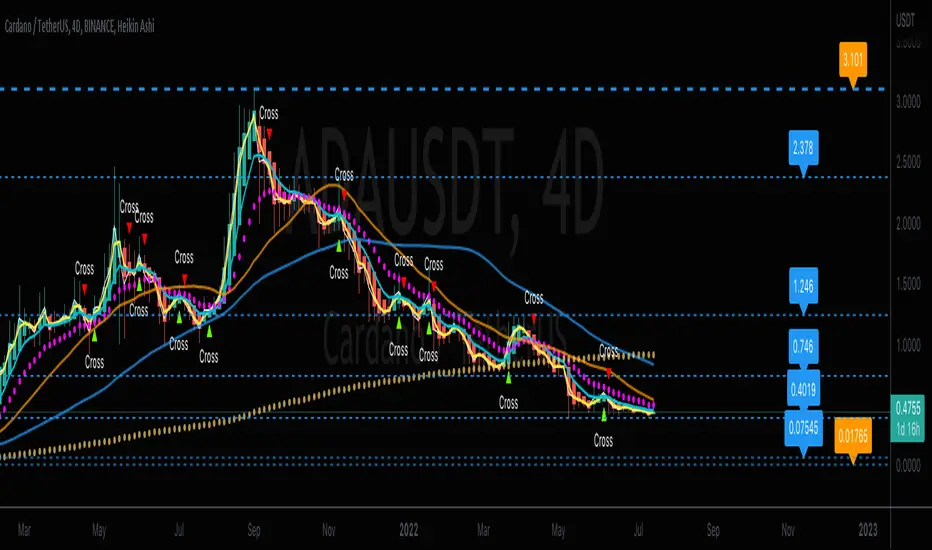
CrossFire -=[ CryptDollar ]=-FEATURES
DO NOT USE WITHOUT READING ALL OF THIS!
Intended to be USED AGAINST Heikin Ashi Averaging Trend Candles for LEGITIMATE ‘AVERAGING’ Trend Recognition and analysis and it is a legitimate mathematical protocol using averages.
NOTE:
THIS IS NOT A simple “ENTER / EXIT" Type Indicator!!! BE CLEAR ABOUT THAT!!
THIS IS A AVERAGE TREND ANALYSIS and Support & Resistance type of indicator
ADDITIONAL NOTE:
This EMA CROSSING signal indicator DOES NOT REPRINT after the EMA CROSS CONFIRMATION, (Candle Close)!!
It may flicker during the confirmation process, which ALL indicator formulas do.
PROOF OF THIS is that the Yellow and Light Blue EMAs are IN FULL VIEW where the indications occur.
What is a Moving Average Crossover Confirmation??
It is when the selected Moving Averages fully cross each other upon candle close.
It is also important to note:
The LOWER the Timeframe, the more 'NOISE to signal' ratio you will get with this and ANY other indicator.
The HIGHER the Timeframe, the more 'SIGNAL to noise' ratio you will get with this and ANY other indicator.
To attain more reliable Trade Planning signals; simply look for signals on the higher TFs, and THEN use the lower, faster-pivoting TFs to limit into position.
You should only execute moves AFTER you 'APPROPRIATELY PLAN YOUR TRADE' and decide to 'TRADE YOUR PLAN!'
------------------------------------------
What is included with this EMA Crossing Indicator:
Dynamic SR (Horizontal lines of Support and Resistance (which is analyzed against recent average price action). An optional VWAP is included as well
ALL of these pop-up indication features can be turned Off or On in settings panel:
Also, it is very important to select the dots next to the indicator name on your chart; scroll the drop menu go to "Visibility" > "Bring to Front." so you can see the 2 and 6 EMAs on top of the Heikin Ashi AVERAGING candles.
AGAIN, this indicator is based off a known and well established Heikin Ashi EMA Crossing Swing Trading Strategy and is optimized with the use of Heikin Ashi AVERAGING Candles.
This contains all of the EMAs related a 2-6-13 Heikin Ashi AVERAGE Trading Strategy. The original strategy for traditional markets used the 17 EMA. But in crypto, I've found that the 13 EMA at least 'seems' to be more relative and consequential as a trend change 'strength' indication.
- Includes alerts with "CROSS" indications for the 2 & 6 EMA crossover points.*
- ALWAYS check for Trend & Price Support or Resistance (SR) ALONG YOUR TRADE PATH, BEFORE planning your Trade.
- DO NOT simply enter trades based on the Cross signals, as these are mere indications of directional change, and make sure you have at least a single candle close confirmation before taking it seriously.
- Along with that, there are certain sets of SMAs (21, 50, & 200) that are universally used by famed rock star traders, for both scalping and swing trades, which can be enabled and disabled in the Style Panel Settings.
- The optional ARROWS are additional indications for when the 13 EMA , 21 SMA , 50 SMA , and 200 SMA are crossed up or down.
Each EMA and SMA has its own alert that you can individually set, along with the primary "CROSS" indication alerts.
* Special note regarding the visual indications of the 13 EMA and the 21 SMA
If an arrow appears with "13-21" above or below it, that is because these moving averages are so close that
for visual notification purposes there was a visual layering issue whenever both of these MAs triggered on same candle.
This compensation for the visual indication has no effect on the individual MA's Alert settings.
- ALL EMAs and SMAs are customizable if the defaults are not to your liking, BUT understand that any EMA and SMA assignment changes will divert away from the strategy for which this indicator was designed.
If you change from the default moving average assignments in the input settings, your changes will unfortunately not be reflected in the "labeling" on the chart or in alerts)!!
- All optional are in the settings panel, and all setting listings are easily understandable as to what they are
- I was finally able to edit the script to where the labels are not obnoxious on the chart!!!
- As with all my indicators so far; I like to include the optional light-white Daily VWAP plot line to save adding an extra indicator if you like to follow the VWAP , as I do.
- If your chart seems noisy with everything turned on, you can always disable any of these features that you find yourself not using as a visual reference and then "Save as default"
Best Applied to Higher Timeframes
With ALL Default “Noisy” Visual Indications Enabled:
With Only the Visible Primary Cross Indications Enabled:
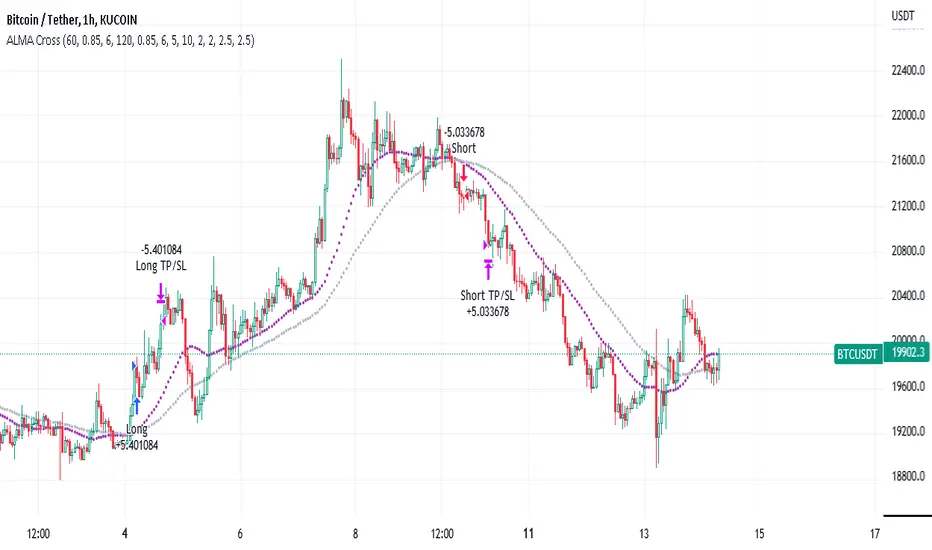
Arnaud Legoux Moving Average Cross (ALMA)This strategy uses two different Arnaud Legoux Moving Average Lengths, one fast and one slow, to determine crosses for entries. The Arnaud Legoux Moving Average is an improvement to traditional MA's because it reduces lag and smooths the signal line. I have added a volume filter to improve the accuracy of the signals. This script is optimized to be used with crypto, but could be adjusted to use on different instruments. Alert functionality is included. The backtesting results displayed use 10% of the initial account equity, adjust as necessary.
SweetSweetLucia: OnceADayA Typical Price Drummond Line, with a Floor Pivot Open Signal Line.
The Three Day Average, is not offset.
The crossing is significant in many strategies.
The circle is an intraday crossing.
The crosses are the signal openings.
Caution: divergence can cause a false positive.
This strategy is for Daily Bars Only!
Thanks.
