Options Cumulative Chart AnalysysThis Pine Script is a comprehensive tool designed for traders analyzing options data on TradingView. It aggregates multiple symbols to calculate and visualize cumulative performance, providing essential insights for decision-making.
Key Features:
Symbol and Strike Price Configuration:
Supports up to four configurable symbols (e.g., NIFTY options).
Allows defining buy/sell actions, quantities, and entry premiums for each symbol.
Customizable Chart Display:
Plot candlesticks and line charts for cumulative data.
Configurable Exponential Moving Averages (EMAs) for technical analysis.
Entry and price lines with customizable colors.
Timeframe Management:
Supports higher timeframe (HTF) candles.
Ensures compatibility with the current chart timeframe to maintain accuracy.
Dynamic Coloring and Visualization:
Red, green, and gray color schemes for body and wicks of candlesticks based on price movements.
Customizable positive and negative color schemes.
Table for Data Representation:
Displays an info table showing symbols, quantities, entry prices, and latest traded prices (LTP).
Adjustable table position, overlay, and styling.
Premium and Profit/Loss Calculations:
Calculates cumulative open, high, low, and close prices considering premiums and quantities.
Tracks the profit and loss dynamically based on cumulative premiums and market prices.
Alerts and Notifications:
Alerts triggered on specific conditions, such as when the profit/loss turns negative.
Modular Functions:
Functions for calculating high/low/open/close values, combining premiums, and drawing candlesticks.
Utilities for symbol management and security requests.
Custom Settings:
Includes a wide range of input options for customization:
Timeframes, EMA lengths, colors, table configurations, and more.
Error Handling:
Validates timeframe inputs to ensure compatibility and prevent runtime errors.
This script is designed for advanced traders looking for a customizable tool to analyze cumulative options data efficiently. By leveraging its modular design and visual elements, users can make informed trading decisions with a holistic view of market movements.
Options
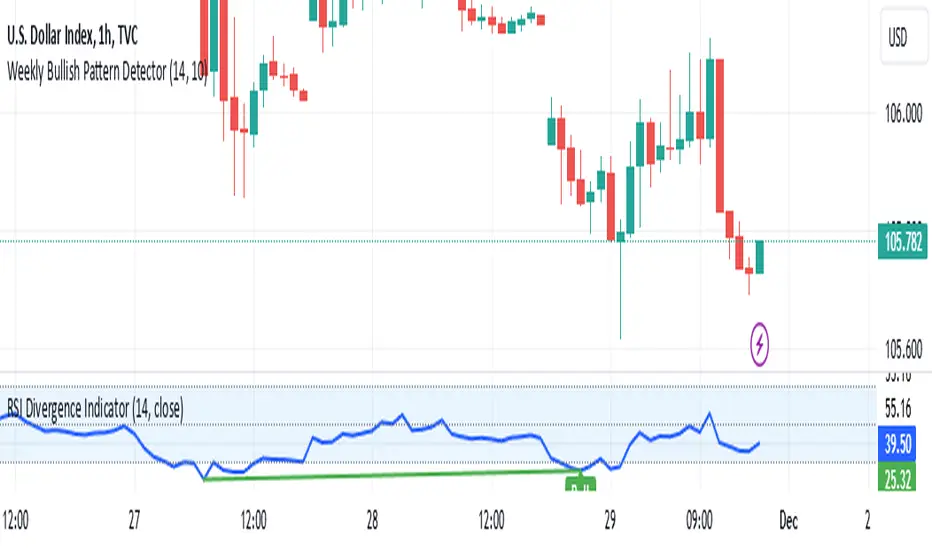
Weekly Bullish Pattern DetectorThis script is a TradingView Pine Script designed to detect a specific bullish candlestick pattern on the weekly chart. Below is a detailed breakdown of its components:
1. Purpose
The script identifies a four-candle bullish pattern where:
The first candle is a long green (bullish) candlestick.
The second and third candles are small-bodied candles, signifying consolidation or indecision.
The fourth candle is another long green (bullish) candlestick.
When this pattern is detected, the script:
Marks the chart with a visual label.
Optionally triggers an alert to notify the trader.
2. Key Features
Overlay on Chart:
indicator("Weekly Bullish Pattern Detector", overlay=true) ensures the indicator draws directly on the price chart.
Customizable Inputs:
length (Body Size Threshold):
Defines the minimum percentage of the total range that qualifies as a "long" candle body (default: 14%).
smallCandleThreshold (Small Candle Body Threshold):
Defines the maximum percentage of the total range that qualifies as a "small" candle body (default: 10%).
Candlestick Property Calculations:
bodySize: Measures the absolute size of the candle body (close - open).
totalRange: Measures the total high-to-low range of the candle.
bodyPercentage: Calculates the proportion of the body size relative to the total range ((bodySize / totalRange) * 100).
isGreen and isRed: Identify bullish (green) or bearish (red) candles based on their open and close prices.
Pattern Conditions:
longGreenCandle:
Checks if the candle is bullish (isGreen) and its body percentage exceeds the defined length threshold.
smallCandle:
Identifies small-bodied candles where the body percentage is below the smallCandleThreshold.
consolidation:
Confirms the second and third candles are both small-bodied (smallCandle and smallCandle ).
Bullish Pattern Detection:
bullishPattern:
Detects the full four-candle sequence:
The first candle (longGreenCandle ) is a long green candle.
The second and third candles (consolidation) are small-bodied.
The fourth candle (longGreenCandle) is another long green candle.
Visualization:
plotshape(bullishPattern):
Draws a green label ("Pattern") below the price chart whenever the pattern is detected.
Alert Notification:
alertcondition(bullishPattern):
Sends an alert with the message "Bullish Pattern Detected on Weekly Chart" whenever the pattern is found.
3. How It Works
Evaluates Candle Properties:
For each weekly candle, the script calculates its size, range, and body percentage.
Identifies Each Component of the Pattern:
Checks for a long green candle (first and fourth).
Verifies the presence of two small-bodied candles (second and third).
Detects and Marks the Pattern:
Confirms the sequence and marks the chart with a label if the pattern is complete.
Sends Alerts:
Notifies the trader when the pattern is detected.
4. Use Cases
This script is ideal for:
Swing Traders:
Spotting weekly patterns that indicate potential bullish continuations.
Breakout Traders:
Identifying consolidation zones followed by upward momentum.
Pattern Recognition:
Automatically detecting a commonly used bullish formation.
5. Key Considerations
Timeframe: Works best on weekly charts.
Customization: The thresholds for "long" and "small" candles can be adjusted to suit different markets or volatility levels.
Limitations:
It doesn't confirm the pattern's success; further analysis (e.g., volume, support/resistance levels) may be required for validation
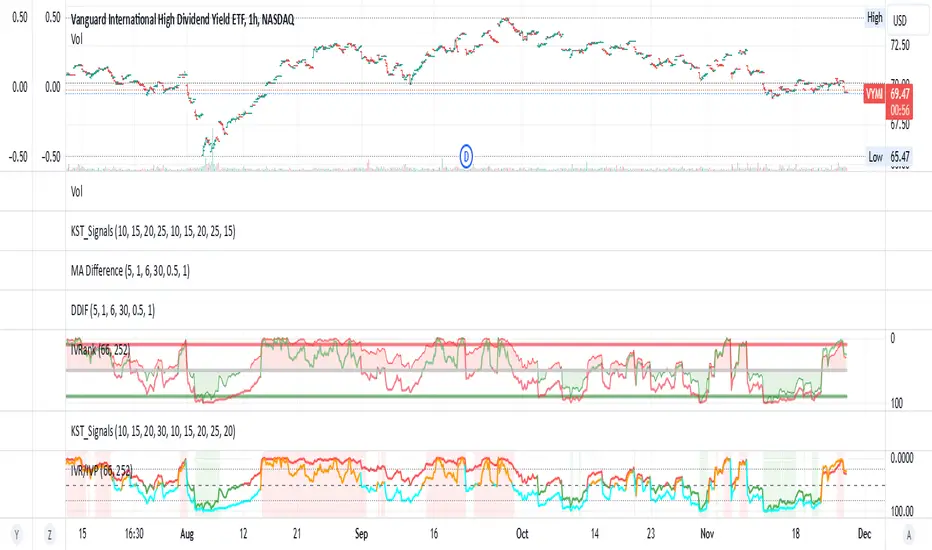
IV Rank/Percentile with Williams VIX FixDisplay IV Rank / IV Percentile
This indicator is based on William's VixFix, which replicates the VIX—a measure of the implied volatility of the S&P 500 Index (SPX). The key advantage of the VixFix is that it can be applied to any security, not just the SPX.
IV Rank is calculated by identifying the highest and lowest implied volatility (IV) values over a selected number of past periods. It then determines where the current IV lies as a percentage between these two extremes. For example, if over the past five periods the highest IV was 30%, the lowest was 10%, and the current IV is 20%, the IV Rank would be 50%, since 20% is halfway between 10% and 30%.
IV Percentile, on the other hand, considers all past IV values—not just the highest and lowest—and calculates the percentage of these values that are below the current IV. For instance, if the past five IV values were 30%, 10%, 11%, 15%, and 17%, and the current IV is 20%, the IV Rank remains at 50%. However, the IV Percentile is 80% because 4 out of the 5 past values (80%) are below the current IV of 20%.
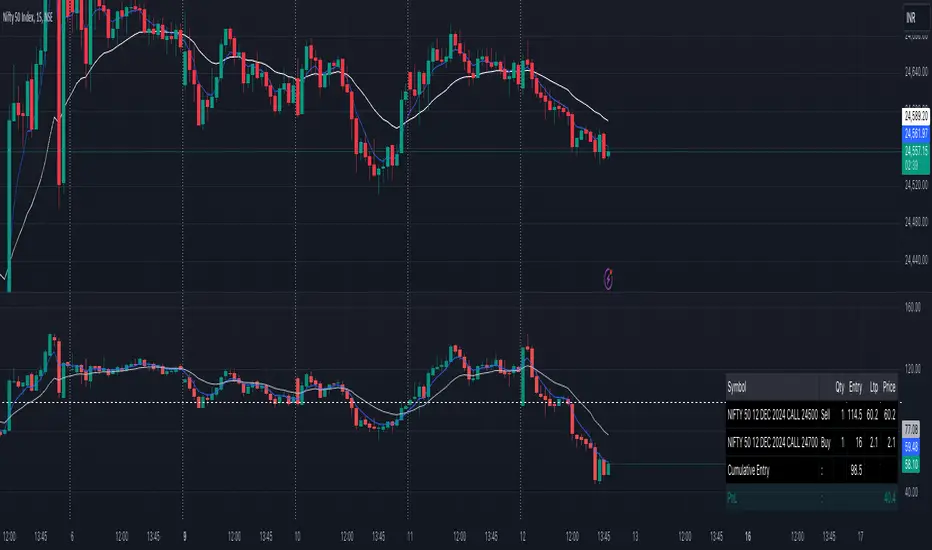
Straddle Charts - Live
Description :
This indicator is designed to display live prices for both call and put options of a straddle strategy, helping traders visualize the real-time performance of their options positions. The indicator allows users to select the symbols for specific call and put options and fetches their prices on a 1-minute timeframe, ensuring updated information.
Key Features :
Live Call and Put Option Prices: View individual prices for both call and put options of the straddle, plotted separately.
Straddle Price Calculation: The total price of the straddle (sum of call and put) is displayed, allowing for easy monitoring of the straddle’s combined movement.
Customizable Inputs: Easily change the call and put option symbols directly from the settings.
Use this indicator to stay on top of your straddle's value and make informed trading decisions based on real-time data.

Trade Manager 2Hi Traders,
this manager will make it easier for you to enter lots into your trading platform. Just go to the indicator settings, set your trading account amount, RRR, % risk and then give ok. If you then know where you want to put the stop loss then reopen, enter the value and hit ok again. The chart will show you exactly the stop loss and take profit as you wanted. The stop loss will always stay where you enter it and the take profit will move with the lot size as the price goes further or closer to the stop loss.
This should help when entering the number of lots, TP, SL into the platform.

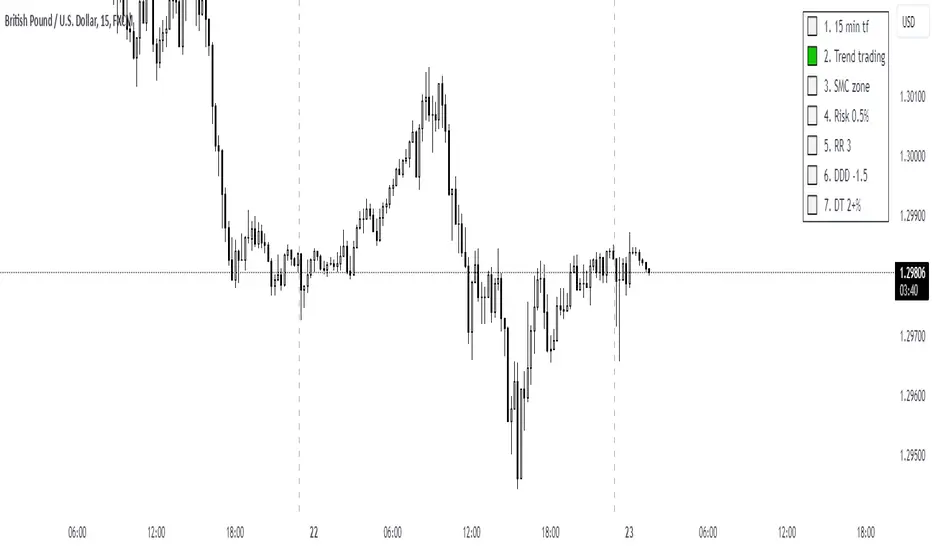
UTC Discipline TradingReminder for Disciplined Trading:
1.Trend Trading – We only open positions in the direction of the trend to take advantage of market momentum.
2.SMC Zones – We trade only within zones defined by the Smart Money Concept (SMC) indicator, identifying key market points.
3.Risk 0.5% – Each position carries a maximum risk of 0.5% of total capital, minimizing potential losses and maintaining risk control.
4.3RR – Every trade must have a risk-to-reward ratio (RR) of 3:1, meaning the potential reward should be three times greater than the risk.
5.DDD -1.5% – When the daily loss reaches -1.5%, trading for the day is closed to avoid further losses.
6.DW 2+% – When daily profit reaches 2%, trading for the day ends. However, if profit exceeds 2%, you may risk an additional amount, and in case of a loss, the day will close with at least 2% profit.
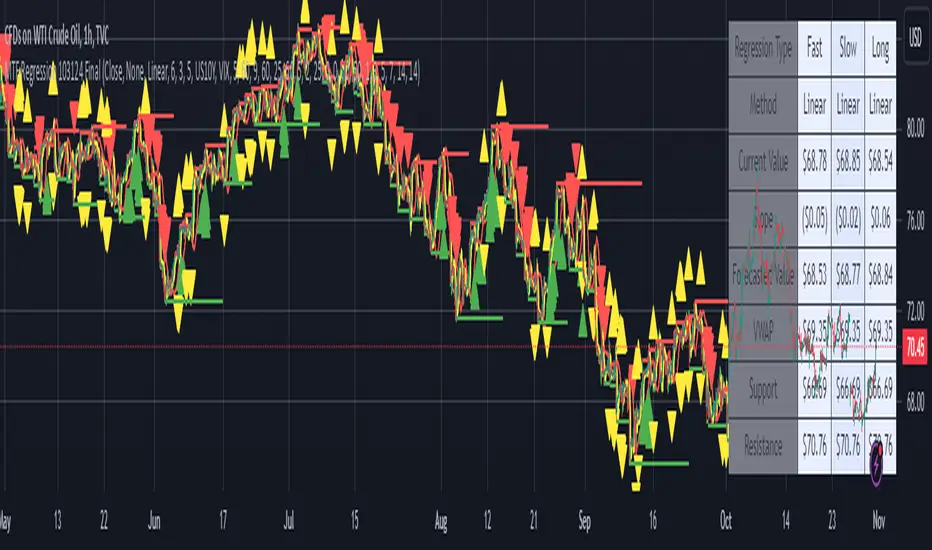
MTF Regression with Forecast### **MTF Regression with Forecast, Treasury Yield, Additional Variable & VWAP Filter - Enhanced with Long Regression**
Unlock advanced market insights with our **MTF Regression** indicator, meticulously designed for traders seeking comprehensive multi-timeframe analysis combined with powerful forecasting tools. Whether you're a seasoned trader or just starting out, this indicator offers a suite of features to enhance your trading strategy.
#### **🔍 Key Features:**
- **Multi-Timeframe (MTF) Regression:**
- **Fast, Slow, & Long Regressions:** Analyze price trends across multiple timeframes to capture both short-term movements and long-term trends.
- **Customizable Price Inputs:**
- **Flexible Price Selection:** Choose between Close, Open, High, or Low prices to suit your trading style.
- **Price Transformation:** Option to apply Exponential Moving Averages (EMA) for smoother trend analysis.
- **Diverse Regression Methods:**
- **Multiple Algorithms:** Select from Linear, Exponential, Hull Moving Average (HMA), Weighted Moving Average (WMA), or Spline regressions to best fit your analysis needs.
- **Integrated External Data:**
- **10-Year Treasury Yield:** Incorporate macroeconomic indicators to refine regression accuracy.
- **Additional Variables:** Enhance your analysis by integrating data from other tickers (e.g., NASDAQ:AAPL).
- **Advanced Filtering Options:**
- **VWAP Filter:** Align signals with the Volume Weighted Average Price for improved trade entries.
- **Price Action Filter:** Ensure price behavior supports the generated signals for higher reliability.
- **Enhanced Signal Generation:**
- **Bullish & Bearish Signals:** Identify potential trend reversals and continuations with clear visual cues.
- **Predictive Signals:** Forecast future price movements with forward-looking arrows based on regression slopes.
- **Slope & Acceleration Thresholds:** Customize minimum slope and acceleration levels to fine-tune signal sensitivity.
- **Forecasting Capabilities:**
- **Projection Lines:** Visualize future price trends by extending regression lines based on current slope data.
- **User-Friendly Interface:**
- **Organized Settings Groups:** Easily navigate through price inputs, regression settings, integration options, and more.
- **Customizable Alerts:** Stay informed with configurable alerts for bullish, bearish, and predictive signals.
#### **📈 Why Choose MTF Regression Indicator?**
- **Comprehensive Analysis:** Combines multiple regression techniques and external data sources for a well-rounded market view.
- **Flexibility:** Highly customizable to fit various trading strategies and preferences.
- **Enhanced Decision-Making:** Provides clear signals and forecasts to support informed trading decisions.
- **Efficiency:** Optimized to deliver reliable performance without overloading your trading platform.
Elevate your trading game with the **MTF Regression with Forecast, Treasury Yield, Additional Variable & VWAP Filter** indicator. Harness the power of multi-timeframe analysis and predictive forecasting to stay ahead in the dynamic markets.
---
*Feel free to reach out for more information or support. Happy Trading!*
Options Strategy Straddle StrangleThe "Options Strategy Straddle Strangle" indicator is designed to assist traders in identifying and executing optimal options trading strategies by leveraging the foundational principles of option greeks. This tool focuses on two prevalent strategies in options trading: straddles and strangles, providing a systematic approach to determining appropriate strike prices based on real-time market data.
At its core, the indicator calculates strike prices by analyzing key option greeks, including Delta, Gamma, Theta, and Vega. By evaluating these sensitivities, the tool assesses the potential risks and rewards associated with different strike prices, ensuring that the selected levels align with the trader's specified thresholds. Users can input their desired thresholds for each greek, allowing for a customized approach that reflects individual risk tolerance and market outlook.
Once the thresholds are set, the indicator applies its underlying logic to filter and identify the most suitable strike prices for both straddle and strangle strategies. A straddle involves purchasing both a call and a put option at the same strike price, benefiting from significant price movements in either direction. Conversely, a strangle involves buying a call and a put option at different strike prices, which can be more cost-effective while still capitalizing on substantial market shifts.
The output of the "Options Strategy Straddle Strangle" indicator is presented in a clear and organized table format. This table displays the recommended strike prices for implementing either a straddle or a strangle strategy, based on the current market conditions and the predefined greek thresholds. By providing this information in an accessible manner, the indicator enables traders to make informed decisions quickly, enhancing their ability to respond to market volatility effectively.
Note:
Used methodology of the following indicator:

ICT CheckListCredit to the owner of this script "TalesOfTrader"
The Awakening Checklist indicator is a tool designed to help traders evaluate certain key market conditions and elements before making trading decisions. It consists of a series of questions that the trader must answer using the options "Yes", "No" or "N/A" (not applicable).
“Has Asia Session ended?” : This question aims to determine if the Asian trading session has ended. The answer to this question can influence trading strategies depending on market conditions.
“Have you identified potential medium induction?” : This question concerns the identification of potential average inductions on the market. Recognizing these inductions can help traders anticipate future price movements.
"Have you identified potential PoI's": This question asks about the identification of potential points of interest on the market. These points of interest can indicate areas of significant support or resistance.
"Have you identified in which direction they are creating lQ?" : This question aims to determine in which direction market participants create liquidity (lQ). Understanding this dynamic can help make informed trade decisions.
“Have they induced Asia Range”: This question concerns the induction of the Asian range by market participants. Recognizing this induction can be important in assessing future price movements.
“Have you had a medium induction”: This question asks about the presence of a medium induction on the market. The answer to this question can influence trading prospects.
“Do you have a BoS away from the induction”: This question aims to find out if the trader has an offer (BoS) far from the identified induction. This can be a risk management strategy.
"Doas your induction PoI have imbalance": This question concerns the imbalance of points of interest (PoI) linked to induction. Recognizing this imbalance can help anticipate price movements.
“Do you have a valid target in mind”: This question aims to find out if the trader has a clear trading objective in mind. Having a goal can help guide trading decisions and manage risk.

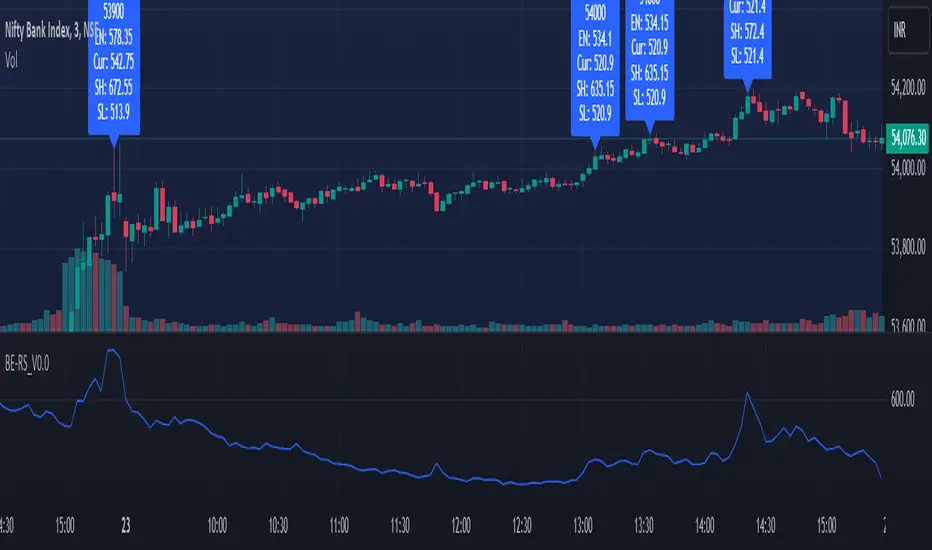
Rolling Straddle PremiumScript is Basically intended to provide insight's on the Rolling Straddle premium for the selected index based on the input settings.
Important thing to consider for the script to work seamlessly:
Specify the LTP in the input field (need not be very accurate)
Specify the Expiry Date for the Option Strike.
Ensure Profile matches to the chart script (Index Script)
Note: Zones marked in Blue, is the max level that indicator can track the option prices. beyond which it may fail to track, during such time consider reloading the indicator with Latest LTP .
Labels on the chart indicate that If i had shorted the Straddle, what would be my current position of that Straddle. however the rational behind shorting is only the pivot high points (not sure if this is right or wrong! )
Note On Labels: Labels are delayed basis the pivot point candles specified in the indicator settings.
EN: Entry Price (Straddle Premium) of the Strike Specified.
Cur: Current Price ( Current Straddle Premium ) of the Strike Specified.
SH: Max Straddle Premium ( Increase in Premium ) since position is active.
SL: Min Straddle Premium ( Premium Erosion ) since position is active.

Time based Insights [Digit23]Description:
The NSE Trading Time Insights indicator is a powerful tool designed for traders on the National Stock Exchange (NSE) of India. It provides a comprehensive overview of different trading sessions throughout the day, offering valuable insights into market characteristics and potential trading strategies for each time period.
Key Features:
1. Dynamic Session Display: The indicator automatically detects the current trading session and highlights it in the table.
2. Customizable Table: Users can choose to display either a full table showing all sessions or focus on the current session only.
3. User-Editable Content: Time ranges, session characteristics, and trading insights are fully customizable by the user.
4. Visual Customization: Table position and color scheme can be adjusted to suit individual preferences.
5. Market Status Indicator: Clearly shows when the market is closed.
Sessions Covered:
1. Opening Bell
2. Mid-Morning
3. Lunch Hour
4. Early Afternoon
5. Power Hour
For each session, the indicator displays:
- Time Range
- Session Name
- Market Characteristics
- Trading Insights
Customization Options:
- Table Position: Choose from top-left, top-right, bottom-left, or bottom-right of the chart.
- Color Scheme: Customize colors for header, cells, highlighting, and market closed status.
- Session Details: Edit time ranges, characteristics, and trading insights for each session.
Usage:
This indicator is particularly useful for:
1. New traders learning about intraday market dynamics on the NSE.
2. Experienced traders looking for a quick reference of session characteristics.
3. Traders developing or refining time-based trading strategies.
4. Anyone seeking to understand the typical flow of the trading day on the NSE.
Note:
The indicator uses the chart's time to determine the current session. Ensure your chart is set to the correct time zone for accurate results.
Disclaimer:
This indicator is for informational purposes only. The provided insights and characteristics are general in nature and may not reflect current market conditions. Always conduct your own analysis and risk assessment before making trading decisions.

Digital Clock with Market Status and AlertsDigital Clock with Market Status and Alerts - 日本語解説は下記
Overview:
The Digital Clock with Market Status and Alerts indicator is designed to display the current time in various global time zones while also providing the status of major financial markets such as Tokyo, London, and New York. This indicator helps traders monitor the open and close times of different markets and alerts them when a market opens. Customizable options are provided for table positioning, background, text colors, and font size.
Key Features:
Real-Time Digital Clock: The indicator shows the current time in your selected time zone (Asia/Tokyo, America/New_York, Europe/London, Australia/Sydney). The time updates in real-time and includes hours, minutes, and seconds, providing a convenient and accurate way to monitor time across different trading sessions.
Global Market Status: Displays the open or closed status of major financial markets.
・Tokyo Market: Open from 9:00 AM to 3:00 PM (JST).
・London Market: Open from 16:00 to 24:00 during summer time and from 17:00 to 1:00 during winter time (JST).
・New York Market: Open from 21:00 to 5:00 during summer time and from 22:00 to 6:00 during winter time (JST).
Customizable Display:
・Background Color: The indicator allows you to set the background color for the clock display, while the leftmost empty cell can be independently customized with its own background color for table alignment.
・Clock and Market Status Colors: Separate color options are available for the clock text, market status during open, and market status during closed periods.
・Text Size: You can adjust the size of the text (small, normal, large) to fit your preferences.
・Table Position: You can position the digital clock and market status table in different locations on the chart: top left, top center, top right, bottom left, bottom center, and bottom right.
Alerts for Market Opening: The indicator will trigger alerts when a market (Tokyo, London, or New York) opens, notifying traders in real-time. This can help ensure that you don't miss any important market openings.
How to Use:
Setup:
Apply the Indicator: Add the Digital Clock with Market Status and Alerts indicator to your chart. Customize the time zone, text size, background colors, and table position based on your preferences.
Monitor Market Status: Watch the market status displayed for Tokyo, London, and New York to keep track of market openings and closings in real-time.
Receive Alerts: The indicator provides built-in alerts for market openings, helping you stay informed when a key market opens for trading.
Time Monitoring:
・Real-Time Clock: The current time is displayed with hours, minutes, and seconds for accurate tracking. The clock updates every second and reflects the selected time zone.
・Global Time Zones: Choose your desired time zone (Tokyo, New York, London, Sydney) to monitor the time most relevant to your trading strategy.
Market Status:
・Tokyo Market: The status will display "Tokyo OPEN" when the Tokyo market is active, and "Tokyo CLOSED" when it is outside of trading hours.
・London Market: Similarly, the indicator will show "London OPEN" or "London CLOSED" depending on whether the London market is currently active.
・New York Market: The New York market status follows the same structure, showing "NY OPEN" or "NY CLOSED."
Customization:
・Table Positioning: Easily move the table to the desired location on the chart to avoid overlap with other chart elements. The leftmost empty cell helps with alignment.
・Text and Background Color: Adjust the text and background colors to suit your personal preferences. You can also set independent colors for open and closed market statuses to easily distinguish between them.
Cautions and Disclaimer:
・Indicator Modifications: This indicator may be updated without prior notice, which could change or remove certain features.
・Trade Responsibility: This indicator is a tool to assist your trading, but responsibility for all trades remains with you. No guarantee of profit or success is implied, and losses can occur. Use it alongside your own analysis and strategy.
Digital Clock with Market Status and Alerts - 解説と使い方
概要:
Digital Clock with Market Status and Alerts インジケーターは、さまざまな世界のタイムゾーンで現在の時刻を表示し、東京、ロンドン、ニューヨークなどの主要な金融市場のステータスを提供します。このインジケーターにより、複数の市場のオープンおよびクローズ時間をリアルタイムで監視でき、市場がオープンする際にアラートを受け取ることができます。テーブルの位置、背景色、テキストカラー、フォントサイズなどのカスタマイズが可能です。
主な機能:
リアルタイムデジタル時計: 選択したタイムゾーン(東京、ニューヨーク、ロンドン、シドニー)の現在時刻を表示します。リアルタイムで更新され、時間、分、秒を正確に表示します。
世界の市場ステータス: 主要な金融市場のオープン/クローズ状況を表示します。
・東京市場: 午前9時~午後3時(日本時間)。
・ロンドン市場: 夏時間では16時~24時、冬時間では17時~1時(日本時間)。
・ニューヨーク市場: 夏時間では21時~5時、冬時間では22時~6時(日本時間)。
カスタマイズ可能な表示設定:
・背景色: 時計表示の背景色を設定できます。また、テーブルの左側に空白のセルを配置し、独立した背景色を設定することでテーブルの配置調整が可能です。
・時計と市場ステータスの色: 時計テキスト、オープン市場、クローズ市場の色を個別に設定できます。
・テキストサイズ: 小、標準、大から選択し、テキストサイズをカスタマイズ可能です。
・テーブル位置: デジタル時計と市場ステータスのテーブルをチャートのさまざまな場所(左上、中央上、右上、左下、中央下、右下)に配置できます。
市場オープン時のアラート: 市場(東京、ロンドン、ニューヨーク)がオープンするときにアラートを発し、リアルタイムで通知されます。これにより、重要な市場のオープン時間を逃さないようサポートします。
使い方:
セットアップ:
インジケーターを適用: チャートに「Digital Clock with Market Status and Alerts」インジケーターを追加し、タイムゾーン、テキストサイズ、背景色、テーブル位置を好みに応じてカスタマイズします。
市場ステータスを確認: 東京、ロンドン、ニューヨークの市場ステータスをリアルタイムで表示し、オープン/クローズ時間を把握できます。
アラートを受け取る: 市場オープン時のアラート機能により、重要な市場のオープンを見逃さないように通知が届きます。
時間管理:
・リアルタイム時計: 現在の時刻が秒単位で表示され、選択したタイムゾーンに基づいて正確に追跡できます。
・グローバルタイムゾーン: 東京、ニューヨーク、ロンドン、シドニーなど、トレードに関連するタイムゾーンを選択して監視できます。
市場ステータス:
・東京市場: 東京市場が開いていると「Tokyo OPEN」と表示され、閉じている場合は「Tokyo CLOSED」と表示されます。
・ロンドン市場: 同様に、「London OPEN」または「London CLOSED」が表示され、ロンドン市場のステータスを確認できます。
・ニューヨーク市場: ニューヨーク市場も「NY OPEN」または「NY CLOSED」で現在の状況が表示されます。
カスタマイズ:
・テーブル位置の調整: テーブルの位置を簡単に調整し、チャート上の他の要素と重ならないように配置できます。左側の空白セルで位置調整が可能です。
・テキストと背景色のカスタマイズ: テキストと背景の色を自分の好みに合わせて調整できます。また、オープン時とクローズ時の市場ステータスを区別するため、独立した色設定が可能です。
注意事項と免責事項:
・インジケーターの変更: このインジケーターは、予告なく変更や機能の削除が行われる場合があります。
・トレード責任: このインジケーターはトレードをサポートするツールであり、トレードに関する全責任はご自身にあります。利益を保証するものではなく、損失が発生する可能性があります。自分の分析や戦略と組み合わせて使用してください。

Line Chart ShiftedThis indicator is designed to assist traders who rely on both line charts and candlestick patterns in their technical analysis. By plotting the closing price from previous bars and shifting it left by a customizable amount, this indicator overlays a line chart directly onto a candlestick chart, giving traders a clearer view of trends and key levels.
Key Features:
Shifted Close Price: The line is plotted based on the closing prices of the previous 3 candles, providing an advanced view of the market's price movements.
Customizable Line Width and Color: Traders can easily modify the thickness and color of the line to match their charting style or improve visibility when analyzing price action.
How It Helps:
Combines Line and Candlestick Charts: For traders who analyze both line and candlestick charts, this indicator provides an effective way to see how price has been evolving, helping to identify support, resistance, and trend lines more easily.
Enhanced Visualization: By shifting the line slightly to the left, the overlay offers a clean separation between the current candlestick and the historical line, improving clarity and making it easier to spot trends.

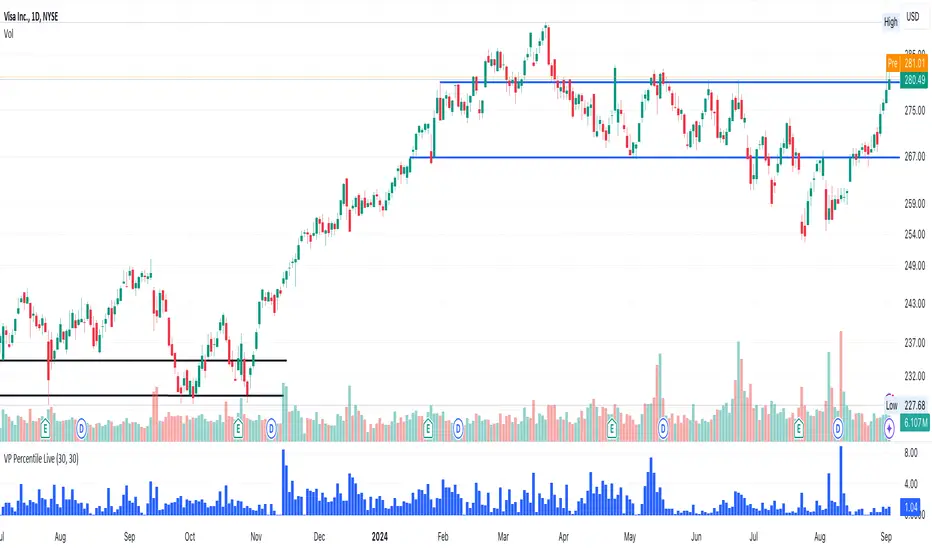
US Market Support & ResistanceUS Market Support & Resistance Indicator (For 5-30 Minute Timeframes)
This indicator plots key support and resistance levels for the US market based on the high and low of the first candle at the market open. It also shades the area between these levels with a color that dynamically changes to indicate the current trend:
* Green: Price is above the resistance level, suggesting a potential uptrend.
* Red: Price is below the support level, suggesting a potential downtrend.
* Gray: Price is trading between the support and resistance levels, suggesting a sideways trend.
Additionally, the indicator displays a small dashboard in the top right corner of the chart showing the current trend ("Upward", "Downward", or "Sideways") in the corresponding color.
Key Features:
* US Market Time Identification: Accurately identifies US market open and close times in UTC and colors candles red during these times.
* Support & Resistance Plotting: Plots support and resistance lines at the high and low of the first candle at the market open and extends them infinitely on the chart.
* Shaded Area Between Levels: Shades the area between the support and resistance lines with a color that dynamically changes based on the current price location relative to these levels.
* Trend Display: Displays a dashboard showing the current trend based on the shaded area's color.
* Open Alert: Issues an alert when the US market opens.
* Supported Timeframes: Works on timeframes less than 30 minutes and greater than 5 minutes.
* Economic News: Not recommended for use during periods of sporadic economic news releases, as sudden price fluctuations may cause false signals.
How to Use:
* Add the indicator to your chart, ensuring the timeframe is between 5 and 30 minutes.
* Wait for the US market to open.
* Observe the shaded area's color and the dashboard to identify the current trend.
* Use the support and resistance levels to make trading decisions, keeping in mind not to rely solely on it during news releases.
Caution: This indicator relies on support and resistance levels drawn at the US market open and may not always be accurate, especially during periods of high volatility. It should be used in conjunction with other technical analysis tools to confirm the trend and make informed trading decisions.
Note: This description is designed to be compliant with TradingView's policies on indicator publishing.

Tomorrow Floor Pivots with CPR By Nifty ZThe colors for resistance and support levels have been updated to gradient reds and greens for clearer distinction.
The CPR band uses light blue and purple to stand out more effectively.
Here's a detailed explanation of the user inputs and the typical use of **Floor Pivots for Tomorrow’s Market Range** in a trading context, focusing on support, resistance, and breakout scenarios:
The script allows traders to customize key parameters for their analysis:
1. Pivot Timeframe:
- Users can select different timeframes for calculating floor pivots, such as 1 hour, 4 hours, daily, weekly, monthly, etc.
- This is crucial because the timeframe selection influences the granularity of the support and resistance levels for the next trading day.
- For instance, selecting a **Daily** timeframe will calculate floor pivots for the next trading day, while selecting **Weekly** will give levels for the upcoming week.
2. Show Floor Pivots:
- Users can toggle the visibility of the calculated **Floor Pivots**, which include resistance levels (R1, R2, R3, R4) and support levels (S1, S2, S3, S4).
3. Show CPR (Central Pivot Range):
- CPR (Central Pivot Range) is a key area where the price tends to consolidate.
- The script allows users to enable or disable the visibility of CPR, which consists of the BC (Bottom Central Pivot) and TC (Top Central Pivot).
4. Show Labels:
- Users can choose whether or not to display labels indicating the **Pivot**, **Support**, and Resistance levels on the chart. This can be helpful for visual analysis when day trading.
Understanding Floor Pivots
The Floor Pivots (Pivot, Resistance, and Support levels) for tomorrow's market range are calculated based on today’s high, low, and close. These levels help traders anticipate how the market may behave in the upcoming session.
1. Pivot:
- The Pivot Point is a central level, calculated as the average of the high, low, and close. It’s considered a reference point that determines the market’s overall bias.
- If the price is trading **above the pivot**, it generally suggests a **bullish** sentiment for the day.
- If the price is trading **below the pivot**, it suggests a **bearish** sentiment.
2. Resistance Levels (R1, R2, R3, R4):
- R1 is often the first area where price may stall in an uptrend. It represents the first major resistance level.
- **R2**, **R3**, and **R4** mark additional levels of resistance, progressively further away from the current price. These are used to project potential upward targets.
- These resistance levels are areas where the price might encounter selling pressure, especially during day trading.
3. **Support Levels (S1, S2, S3, S4):**
- Similarly, **S1** is the first area where the price might find support in a downtrend.
- **S2**, **S3**, and **S4** provide deeper support levels where the price may bounce from.
- These support zones are used by day traders to anticipate where the price might reverse upward.
### **Role of Resistance and Support in Day Trading**
- **Resistance Levels (R1, R2, R3, R4)** indicate potential areas where price could **stall** during an uptrend. These levels are useful for **short-term traders** looking to set exit points or identify reversal zones.
- **Support Levels (S1, S2, S3, S4)** highlight areas where the price could **find support** and potentially **bounce** higher. These levels are particularly helpful for identifying buy zones in a downtrend.
- If a price **breaks out** above the resistance levels or **breaks down** below the support levels, it often signals a strong trend continuation.
### **Understanding the Central Pivot Range (CPR)**
The **CPR** is formed by two key levels:
- **BC (Bottom Central Pivot):** The midpoint of the day’s high and low.
- **TC (Top Central Pivot):** The difference between the pivot and BC.
The CPR acts as a region of **consolidation** or **indecision** where the market is likely to stay within a narrow range. The width of the CPR gives traders a sense of volatility:
- A **narrow CPR** often signals that a **breakout** is imminent.
- A **wider CPR** suggests that the market could remain range-bound.
### **Market Sentiment Based on Floor Pivots**
The relationship between **today’s** and **tomorrow’s pivots** is crucial in determining the market sentiment for the next day.
1. **Bullish Case (Higher Highs):**
- If **tomorrow's pivot** is higher than **today's pivot**, it indicates a **bullish sentiment**. This suggests that the market is likely to trend upward in the next session.
- In a **bullish overlapping pivot range**, if **Day 1 (today)** is higher than **Day 2 (tomorrow)**, traders expect continued upward momentum.
2. **Bearish Case (Lower Lows):**
- Conversely, if **tomorrow's pivot** is lower than **today's pivot**, it suggests a **bearish sentiment** and that the market could trend downward in the next session.
- In a **bearish overlapping pivot range**, if **Day 1 (today)** is lower than **Day 2 (tomorrow)**, traders expect continued downward pressure.
### **Breakout Scenarios**
A breakout occurs when the price **violates either the support or resistance levels** significantly, indicating that the price is moving in the direction of the breakout.
1. **Bullish Breakout:**
- If the price consistently stays **above the CPR** and **resistance levels (R1, R2)**, it indicates a strong **bullish breakout**.
- This is especially true when the **CPR is narrow** for both days, signaling a buildup in price action and a potential breakout to the upside.
2. **Bearish Breakout:**
- If the price breaks **below the CPR** and **support levels (S1, S2)**, it indicates a **bearish breakout**.
- A narrow CPR on **both days** suggests that a breakout to the downside could be imminent.
3. **Neutral or Ranging Days:**
- Sometimes, the CPR stays **unchanged** for 4-5 days, indicating a period of **consolidation** where the price is moving within a tight range. This often leads to a significant breakout once the consolidation ends.
Strategic Application of Floor Pivots for Tomorrow
Traders use floor pivots to plan their next-day trades by:
- **Aligning with Market Sentiment:** Based on whether tomorrow’s pivot is higher or lower than today’s, traders can align their trades in the direction of the market’s overall bias.
- **Identifying Entry and Exit Points:** Resistance and support levels provide well-defined areas to enter or exit trades, making pivots essential for day trading strategies.
- **Anticipating Breakouts:** Monitoring the width of the CPR and the relation between pivots helps traders anticipate potential breakouts, allowing them to react quickly to sudden price movements.
By effectively using these pivots and understanding their significance, traders can improve their decision-making for short-term trades in the stock or futures markets.
Volume-Price PercentileDescription:
The "Volume-Price Percentile Live" indicator is designed to provide real-time analysis of the relationship between volume percentiles and price percentiles on any given timeframe. This tool helps traders assess market activity by comparing how current volume levels rank relative to historical volume data and how current price movements (specifically high-low ranges) rank relative to historical price data. The indicator visualizes the ratio of volume percentile to price percentile as a histogram, allowing traders to gauge the relative strength of volume against price movements in real time.
Functionality:
Volume Percentile: Calculates the percentile rank of the current volume within a user-defined rolling period (default is 30 bars). This percentile indicates where the current volume stands in comparison to historical volumes over the specified period.
Price Percentile: Calculates the percentile rank of the current candle's high-low difference within a user-defined rolling period (default is 30 bars). This percentile reflects the current price movement's strength relative to past movements over the specified period.
Percentile Ratio (VP Ratio): The indicator plots the ratio of the volume percentile to the price percentile. This ratio helps identify periods when volume is significantly higher or lower relative to price movement, providing insights into potential market imbalances or strength.
Real-Time Data: By fetching data from a lower timeframe (e.g., 1-minute), the indicator updates continuously within the current timeframe, offering live, intra-candle updates. This ensures that traders can see the histogram change in real-time as new data becomes available, without waiting for the current candle to close.
How to Use:
Adding the Indicator: To use this indicator, add it to your chart on TradingView by selecting it from the Indicators list once it is published publicly.
Setting Parameters:
Volume Period Length: This input sets the rolling window length for calculating the volume percentile (default is 30). You can adjust it based on the desired sensitivity or historical period relevance.
Candle Period Length: This input sets the rolling window length for calculating the price percentile based on the high-low difference of candles (default is 30). Adjust this to match your trading style or analysis period.
Interpreting the Histogram:
The histogram represents the volume percentile divided by the price percentile.
Above 1: A value greater than 1 indicates that volume is relatively strong compared to price movement, which may suggest high activity or potential accumulation/distribution phases.
Below 1: A value less than 1 suggests that price movement is relatively stronger than volume, indicating potential weakness in volume relative to price moves.
Near 1: Values close to 1 suggest a balanced relationship between volume and price movement.
Application: Use this indicator to identify potential breakout or breakdown scenarios, assess the strength of price movements, and confirm trends. When volume percentile consistently leads price percentile, it might signal sustained interest and support for the current price trend. Conversely, if volume percentile lags significantly, it might warn of potential trend weakness.
Best Practices:
Multiple Timeframe Analysis: While the indicator provides real-time updates on any timeframe, consider using it alongside higher timeframe analysis to confirm trends and volume behavior across different periods.
Customization: Adjust the period lengths based on the asset’s typical volume and price behavior, as well as your trading strategy (e.g., short-term scalping vs. long-term trend following).
Complement with Other Indicators: Use this indicator in conjunction with other volume-based tools, trend indicators, or momentum oscillators to gain a comprehensive view of market dynamics.
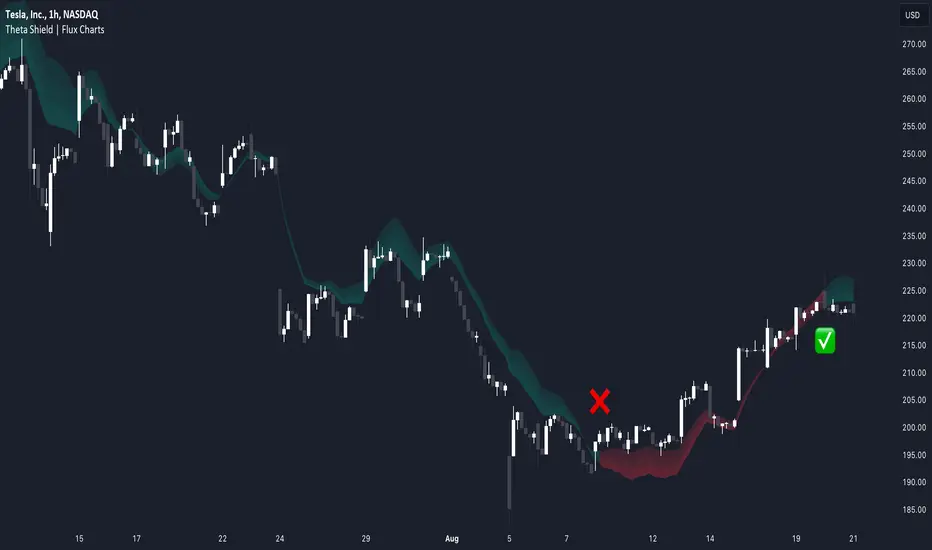
Theta Shield | Flux Charts💎 GENERAL OVERVIEW
Introducing our new Theta Shield indicator! Theta is the options risk factor concerning how fast there is a decline in the value of an option over time. This indicator aims to help the trader avoid sideways market phases in the current ticker, to minimize the risk of theta decay. For more information, please check the "How Does It Work" section.
Features of the new Theta Shield Indicator :
Foresight Of Accumulation Zones
Decrease Risk Of Theta Decay
Clear "Valid" & "Non-Valid" Signals
Validness Trail
Alerts
📌 HOW DOES IT WORK ?
In options trading, theta is defined as the rate of decline in the value of an option due to the passage of time. Traders want to avoid this kind of decay in the value of an option. One of the best ways to avoid it is not holding an option contract when the market is going sideways. This indicator uses a stochastic oscillator to try to get a foresight of sideways markets, warning the trader to not hold an option contract while the price is in a range.
The indicator starts by calculating the stochastic value using close, high & low prices of the candlesticks. Then a stoch threshold & a theta length are determined depending on the option contract type defined by the user in the settings of the indicator. Each candlestick that falls above or below the stoch threshold value is counted, and a "theta valid strength" is calculated using the counted candlesticks, which has a value between -100 & 100. Here is the formula of the "theta valid strength" value :
f_lin_interpolate(float x0, float x1, float y0, float y1, float x) =>
y0 + (x - x0) * (y1 - y0) / (x1 - x0)
thetaValid = Total Candlesticks That Fall Above & Below The Threshold In Last "Theta Length" bars.
thetaValidStrength = f_lin_interpolate(0, thetaLength, -100, 100, thetaValid)
Then a trail is rendered, and "Valid" & "Non-Valid" signals are given using this freshly calculated strength value. Valid means that the indicator currently thinks that no accumulation will happen in the near future, so the option positions in the current ticker are protected from the theta decay. Non-Valid means that the indicator thinks the ticker has entered the accumulation phase, so holding any option position is not recommended, as they may be affected by the theta decay.
🚩 UNIQUENESS
This indicator offers a unique way to avoid theta decay in options trading. It uses a stochastic oscillator and thresholds to calculate a "theta strength" value, which is used for rendering validness signals and a trail. Traders can follow the valid & non-valid signals when deciding to hold their options position or not. The indicator also has an alerts feature, so you can get notified when a ticker is about to enter a range, or when it's about to get out of it.
⚙️ SETTINGS
1. General Configuration
Contract Type -> You can set the option contract type here. The indicator will adjust itself to get a better foresight depending on the contract length.
2. Style
Fill Validness -> Will render a trail based on "theta strength" value.
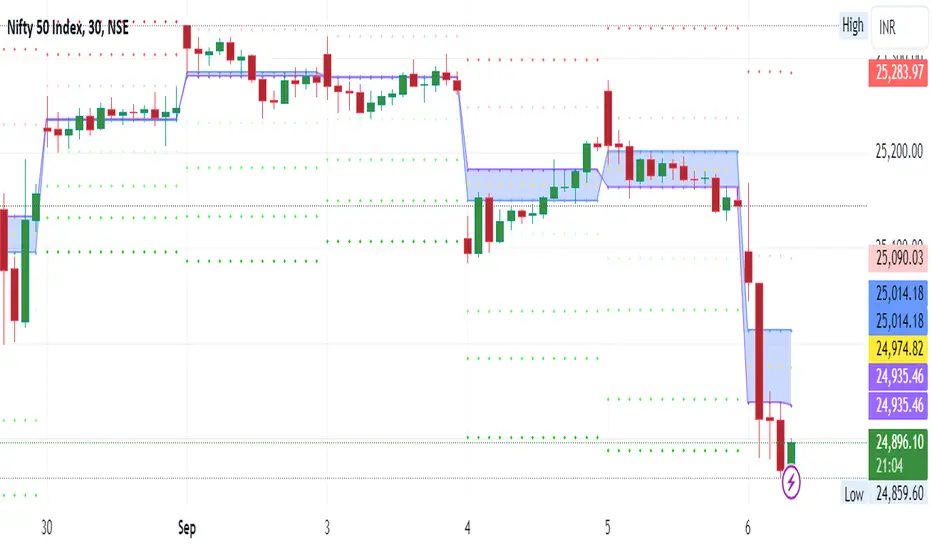
[1] Dynamic Support and Resistance with breakout [Dr Future]This script appears to be designed to identify and visualize dynamic support and resistance levels on a price chart, along with potential breakout signals.
Key Components & Functionality (Inferred):
Dynamic Support and Resistance: The script likely employs algorithms to calculate and plot support and resistance levels that adjust in real-time as price action evolves.
Breakout Detection: The script probably incorporates logic to recognize when the price breaks out of these dynamic support or resistance zones. This could trigger alerts or visual cues on the chart.
Dr Future's Approach: It's worth noting the " " tag, suggesting the script might be based on specific methodologies or insights associated with a trader or analyst known as "Dr Future." Without more context on their strategies, it's difficult to pinpoint the exact techniques used.
Potential Benefits:
Adaptive Levels: Dynamic support and resistance can offer a more responsive approach compared to static levels, as they account for changing market conditions.
Breakout Opportunities: Identifying breakouts can help traders spot potential entry or exit points.
Visual Clarity: Plotting these levels directly on the chart can provide a clearer picture of the current market structure and potential turning points.
Caveats:
False Signals: Like any technical tool, dynamic support and resistance can generate false signals. Breakouts might not always lead to sustained trends.
Parameter Sensitivity: The script's effectiveness likely depends on how its parameters are configured. Fine-tuning might be required to suit different markets or timeframes.
"Dr Future" Factor: The script's performance could be tied to the specific strategies of "Dr Future," which might not be universally applicable.
Important Note:
Without access to the actual code and a deeper understanding of "Dr Future's" methods, this description is based on inference and general knowledge of technical analysis.
Recommendation:
If you're considering using this script, it would be prudent to:
Backtest Thoroughly: Test the script on historical data to assess its performance and identify potential pitfalls.
Understand the Parameters: Familiarize yourself with the script's settings and how they impact the plotted levels and breakout signals.
Combine with Other Tools: Use this script in conjunction with other technical indicators and risk management strategies for a more holistic trading approach.

Daily Bias Engine | PDH/PDL Range This program is designed to track the previous day range and interactions with the mean threshold on the following day.
The bias strategy is simple:
If you create new range highs over a PDH, you will lean towards calls.
If you create new range lows over a PDL, you will learn towards puts.
If neither event happens, no bias can be determined and therefore no trades taken.
If by 12:00pm there still is no bias determined, it will show moderate strength based on the trend.
Remember, use this strategy to outline your bias and find a cheap entry model to take advantage of.

Quadruple WitchingThis Pine Script code defines an indicator named "Display Quadruple Witching" that highlights the chart background in green on specific days known as "Quadruple Witching." Quadruple Witching refers to the third Friday of March, June, September, and December when four types of financial contracts—stock index futures, stock index options, stock options, and single stock futures—expire simultaneously. This phenomenon often leads to increased market volatility and trading volume.
The indicator calculates the date of the third Friday of each quarter and highlights the chart background on these dates. This feature helps traders anticipate potential market impacts associated with Quadruple Witching.
Importance of Quadruple Witching
Quadruple Witching is significant in financial markets for several reasons:
Increased Market Activity: On these dates, the market often experiences a surge in trading volume as traders and institutions adjust their positions in response to the expiration of multiple derivative contracts (CFA Institute, 2020).
Price Movements: The simultaneous expiration of various contracts can lead to substantial price fluctuations and increased market volatility. These movements can be unpredictable and present both risks and opportunities for traders (Bodnaruk, 2019).
Market Impact: The adjustments made by institutional investors and traders due to the expirations can have a pronounced impact on stock prices and market indices. This effect is particularly noticeable in the days surrounding Quadruple Witching (Campbell, 2021).
References
CFA Institute. (2020). The Impact of Quadruple Witching on Financial Markets. CFA Institute Research Foundation. Retrieved from CFA Institute.
Bodnaruk, A. (2019). The Effect of Option Expiration on Stock Prices. Journal of Financial Economics, 131(1), 45-64. doi:10.1016/j.jfineco.2018.08.004
Campbell, J. Y. (2021). The Behaviour of Stock Prices Around Expiration Dates. Journal of Financial Economics, 141(2), 577-600. doi:10.1016/j.jfineco.2021.01.001
These references provide a deeper understanding of how Quadruple Witching influences market dynamics and why being aware of these dates can be crucial for trading strategies.

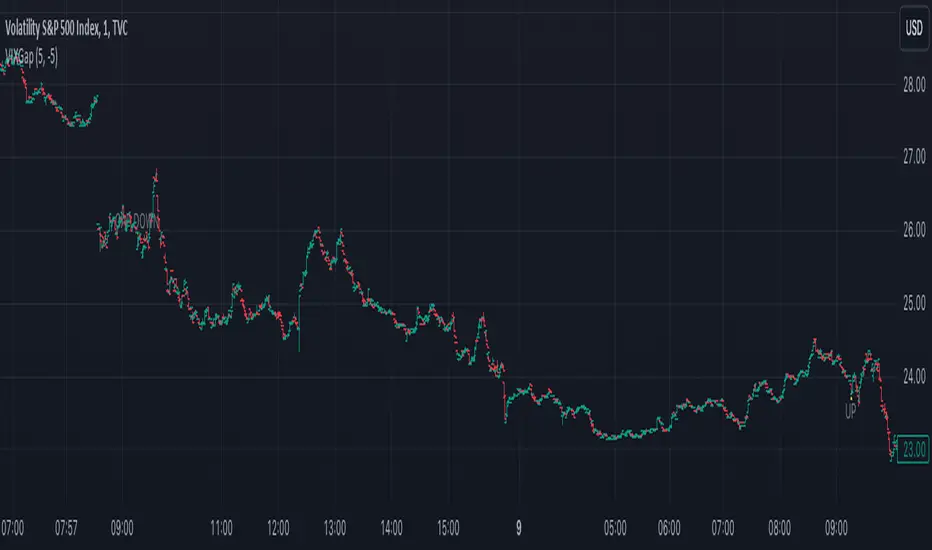
VIX Opening GapOverview
This simple script generates alerts based on the difference between the previous trading day's VIX close and the current trading day's opening bar. It is designed for use on the TVC version of the VIX chart, with 1-minute bars.
Features
The script flags one of four conditions based on the difference between the previous day's close and the current day's open: (1) open up; (2) open down; (3) gap up; and (4) gap down. The thresholds for gaps up and down are expressed as percentages and can be changed in the input settings.
The script can assess the gap at the first bar of the premarket session or at the first bar printed after market open. Change this by toggling the "Use Premarket Hours" feature in the input settings.
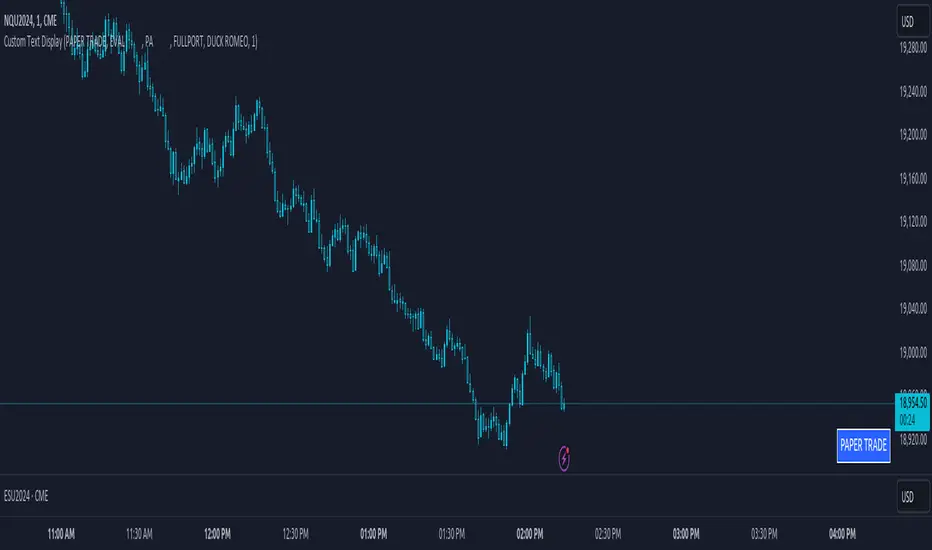
Custom Text DisplayThe "Custom Text Display" indicator allows users to display customizable text in a fixed position in the bottom-right corner of their chart. Each text entry can have its own color, which can be set in the indicator's settings. Follow these steps to set up and use the indicator effectively:
Adding the Indicator to Your Chart:
Apply the "Custom Text Display" indicator to your chart from the indicators list.
Configuring Text and Colors:
Open the settings for the indicator.
Enter the desired text for each of the five text fields labeled "Text 1", "Text 2", etc.
Choose a color for each text entry using the color pickers labeled "Color 1", "Color 2", etc.
Selecting the Active Text:
In the indicator settings, find the "Select Active Text" dropdown menu.
This menu offers six options: "0" (None), "1" (Text 1), "2" (Text 2), "3" (Text 3), "4" (Text 4), and "5" (Text 5).
Select the number corresponding to the text you want to activate. Only one text can be active at a time.
Viewing the Active Text on the Chart:
The selected active text will be displayed in the bottom-right corner of the chart with the corresponding background color.
If no text is selected (option "0"), no text will be displayed.