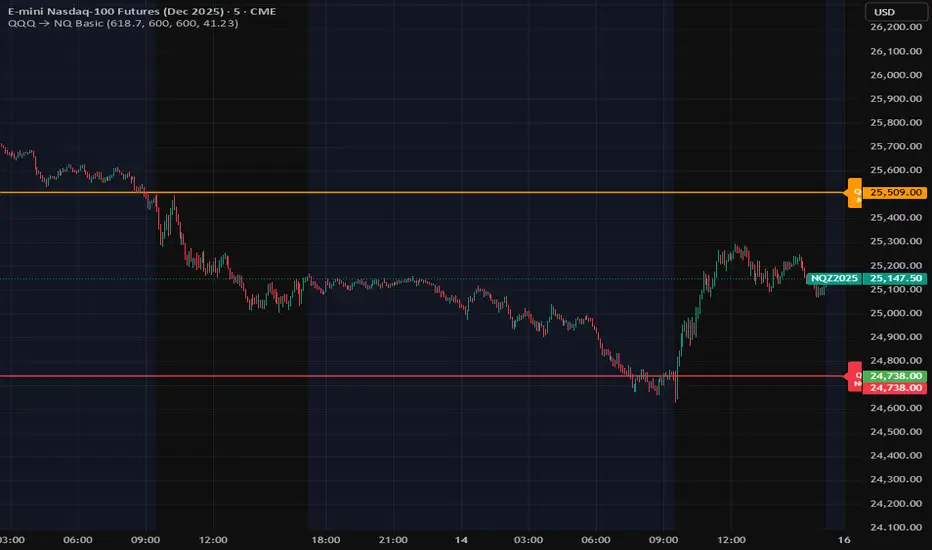
MenthorQ Levels ConversionLevels Conversion helps traders accurately overlay price levels from spot/index ETFs and indices (like SPX, SPY, QQQ, NDX) onto futures charts (like ES, NQ, etc.).
Because futures and spot/index prices don’t trade at the same price, your levels will be misaligned if you plot them directly. Futures typically trade at a spread or ratio versus their related index/ETF. This indicator solves that by calculating the conversion ratio automatically, so your levels stay aligned on the futures chart.
How it works
This script calculates the ratio between Asset A and Asset B and applies it to convert levels from one instrument to the other (for example, SPX → ES, QQQ → NQ).
Ratio options (3 modes)
You can choose one of three ratio sources:
✅ T1 Ratio (Morning Snapshot)
Select a specific time to “lock” the ratio.
Default: 10:00 AM ET (morning session snapshot)
✅ T2 Ratio (Afternoon Snapshot)
Select a second time to “lock” the ratio.
Default: 3:30 PM ET (afternoon snapshot)
✅ Last Price Ratio (Live)
Uses the last traded price of both assets to compute the ratio.
Note: To refresh the “Last Price” baseline, simply remove and re-add the indicator.
Learn more about Levels Conversions: menthorq.com
Common levels conversions
Some popular use-cases include:
- SPX Gamma Levels → ES
- SPY Gamma Levels → ES
- QQQ Gamma Levels → NQ
- NDX Gamma Levels → NQ
- SPX Intraday Gamma Levels → ES
- QQQ Intraday Gamma Levels → NQ
- SPX Swing Trading Levels → ES
- QQQ Swing Trading Levels → NQ
- GLD Levels → GC
- DIA Levels → YM
- USO Levels → CL
- NVDA / MAG7 Levels → QQQ
Options

Fat Tony's Composite Momentum + ROC (v0.4)Fat Tony's Composite Momentum + ROC (v0.4)
Option guy settings and indicators

FF calculation Saptarshi ChatterjeeForward factor (in options contexts) measures implied volatility (IV) for a future period between two expirations, like from 30 DTE (days to expiry) front-month to 60 DTE back-month options.
This indicator calculates the FORWARD FACTOR(FF) using 2 IVs of 2 DTEs.
+ve value means front DTE is rich in premium and back expiry is cheap.
-ve value means front DTE IV is cheap and 2nd DTE is expensive
we can use this term structure disbalance to trade calendar spreads with edge.


Market Maker Position Bars (Position Size)**Market Maker Position Bars (Position Size) – Indicator Description for TradingView**
This indicator is a clean, professional visualization tool designed for traders who track suspected **market maker / institutional positioning** (especially popular in ICT/SMC communities) on indices like the SPX, NDX, ES, etc.
It draws up to **20 horizontal position bars** directly on the chart, anchored to the very last bar, representing hypothetical long and short positions at specific price levels with corresponding position sizes.
### Key Features & Visual Logic
- **Green bars (Boxes 1–10)** → Extend to the **right** of the last bar
Represent **long positions** (bullish interest)
Default translucent green fill
- **Red bars (Boxes 11–20)** → Extend to the **left** of the last bar
Represent **short positions** (bearish interest)
Default translucent red fill
- **Bar width = Position size**
The length of each box is automatically scaled based on the absolute value you enter in “Position Size”.
Larger position → wider (longer) bar
- Each box displays **Price / Position Size** text inside (e.g., `5720.50 / 1250`)
### Fully Customizable Settings
**Global Geometry**
- Total Box Height (default 10.0) – controls vertical thickness of all boxes
**Position Size Scaling**
- Base Box Width (bars)
- Width per Position Unit – fine-tune how aggressively width grows with size
- Minimum & Maximum Bar Width – prevents boxes from becoming too tiny or excessively long
**Global Text Settings**
- Text color, size (Tiny → Huge), and bold option
**Individual Box Controls (20 independent boxes)**
- Show/Hide toggle
- SPX Price (or any symbol price level)
- Position Size (any positive/negative number; absolute value determines width)
- Fill color (override default green/red if desired)
### How It Works Internally
- All boxes are drawn only on the **last confirmed bar** (`barstate.islast`)
- Width calculation:
`Width = BaseWidth + (|Position Size| × Width per Unit)`
Clamped between Min and Max Bar Width
- Green boxes start at the current bar and extend forward (right)
- Red boxes end at the current bar and extend backward (left)
- Uses Pine Script v6 `box.new()` with `xloc.bar_index` for perfect alignment and performance
### Ideal Use Cases
- Visualizing daily/weekly **order block** or **fair value gap** interest levels with estimated size
- Mapping **dealer positioning**, gamma exposure levels, or large options interest
- Quickly seeing where the “smart money” is theoretically stacked on both sides of the market
- Clean chart markup for screenshots, mentoring, or live trading journals
A minimalist yet powerful tool favored by ICT, SMC, and footprint-style traders who want to see **where the big players might be positioned** — all in one glance without cluttering the chart with hundreds of objects.
Clean. Visual. Size-aware. Perfect for high-level market profiling.

TF7 Option vs Index Change RatioOverview
This indicator helps traders visualise the strength and direction of an option's price movement compared to its underlying index (NIFTY or SENSEX).
It calculates a Change Ratio, which is the percentage move in the option compared to the index movement during the same bar. This is especially useful for intraday traders looking for signs of momentum, divergence, or unusual strength/weakness in option pricing.
How It Works
The ratio is calculated as:
(Option LTP − Option Open) / (Index Close − Index Open)
The value is capped between −10 and +10 to filter out extreme or invalid spikes.
The ratio is displayed as a color-coded column chart:
🟩 Green bars: Option is moving in the same direction as the index.
🟥 Red bars: Option is underperforming or moving opposite to the index.
A compact table shows the last 5 bars of:
Option price change (with +/− sign)
Index price change
Calculated ratio (also color-coded)
You can toggle the table visibility in the settings.
Inputs & Features
Select underlying index: NIFTY or SENSEX
Toggle the data table display
Clean formatting with signed values and conditional color highlights
⚠️ Disclaimer
This is a visual analysis tool, not a buy/sell signal. Always validate with your trading strategy and risk management
#OptionsTrading, #NIFTY, #SENSEX, #ChangeRatio, #IndexAnalysis, #Momentum, #Divergence, #Intraday

Opcje: Sugestia Strike'ów (HV Based)How to interpret this script?
1. Dotted Lines:
Red (Upper): The price level above which the asset is statistically unlikely to rise within X days. This is where you look for a Strike Price to sell a CALL option (Short Call).
Green (Lower): The price level below which the asset is statistically unlikely to fall. This is where you look for a Strike Price to sell a PUT option (Short Put).
2. Sigma Multiplier (Important!):
The default setting is 2.0. This represents 2 Standard Deviations.
In a normal distribution, 2 standard deviations cover approximately 95% of outcomes.
This means you theoretically have a 95% probability that the option will expire worthless (meaning you keep the full premium), but the premium received will be lower.
If you change it to 1.0, you will be closer to the current price = higher premium, but the risk of assignment (exercise) increases to about 32%.
3. DTE (Days to Expiration):
Enter the actual number of days for the option you intend to sell (e.g., 45). The script will calculate where the price might be in 45 days based on current volatility.

Gold AI RSI Monitor [Stacked + KNN]Here is a comprehensive description and user guide for the Gold AI RSI Monitor. You can copy and paste this into the "Description" field if you publish the script on TradingView, or save it for your own reference.
Gold AI RSI Monitor
🚀 Overview
The Gold AI RSI Monitor is a next-generation dashboard designed specifically for trading volatile assets like Gold (XAUUSD). It completely reimagines the traditional RSI by "stacking" 10 different timeframes (from 1-minute to Monthly) into a single, vertical view.
Integrated into this dashboard is a K-Nearest Neighbors (KNN) Machine Learning algorithm. This AI analyzes historical price action to find patterns similar to the current market and predicts the next likely move with a confidence score.
📊 Visual Guide: How to Read the Chart
1. The "Stacked" Lanes Instead of switching timeframes constantly, this indicator displays them all at once using vertical offsets.
Bottom Lane (0-100): 1-Minute RSI
Middle Lanes: 5m, 15m, 30m, 1H, 2H, 4H, Daily
Top Lane (900-1000): Monthly RSI
2. Gradient Color System The RSI lines change color based on momentum strength:
🔴 Red: Oversold / Bearish (Approaching 30 or lower)
🟡 Yellow: Neutral (Around 50)
🟢 Green: Overbought / Bullish (Approaching 70 or higher)
3. Tracker Lines Each timeframe has a dotted horizontal line extending to the right. This allows you to instantly see the exact RSI value for every timeframe without squinting.
🤖 The AI Engine (KNN)
The "AI" component uses a K-Nearest Neighbors algorithm.
Learning: It scans the last 1,000 bars of history.
Matching: It finds the 5 historical moments that look mathematically identical to the current market conditions (based on RSI and Volatility).
Predicting: It checks if price went UP or DOWN after those historical matches.
The Signals:
Buying Signal: If the majority of historical matches resulted in a price increase, the AI triggers a BUY.
Selling Signal: If the majority resulted in a drop, the AI triggers a SELL.
🎯 How to Trade with This Indicator
1. The "Crosshair" Signal
When the AI detects a high-probability setup, a massive Crosshair appears on your chart:
Green Crosshair: Strong BUY signal.
Red Crosshair: Strong SELL signal.
Note: The crosshair consists of a thick vertical line and a dashed horizontal line intersecting at the signal candle.
2. Timeframe Alignment (Confluence)
Do not rely on the AI alone. Look at the stacked RSIs:
Strong Long: The AI shows a Green Crosshair AND the lower timeframes (1m, 5m, 15m) are all turning Green/upward.
Strong Short: The AI shows a Red Crosshair AND the lower timeframes are turning Red/downward.
3. Support & Resistance Zones
Bottom Dotted Line (30): Support. If RSI hits this and turns up, it's a buying opportunity.
Top Dotted Line (70): Resistance. If RSI hits this and turns down, it's a selling opportunity.
⚙️ Settings Guide
RSI Length: Default is 14. Lower (e.g., 7) makes it faster/choppier; higher (e.g., 21) makes it smoother.
Enable AI Signals: Toggles the KNN calculation on/off.
Neighbors (K): How many historical matches to check. Default is 5.
Increase to 9-10 for fewer, more conservative signals.
Decrease to 3 for faster, more aggressive signals.
AI Timeframe: CRITICAL SETTING.
If left empty, the AI calculates based on your current chart.
Recommendation: For Gold scalping, set this to 15m or 1h. This ensures the AI looks at the bigger trend even if you are zooming in on the 1-minute chart.
⚠️ Disclaimer
This tool is for educational and analytical purposes. The "AI" is a statistical probability algorithm based on past performance, which is not indicative of future results. Always manage your risk.

FRAN CRASH PLAY RULESA script with purely descriptive nature is one that:
• Only describes actions, settings, characters, and events.
• Contains no dialogue, commands, or instructions for execution.
• Does not specify plot decisions, logic, or interactive elements.
• Reads like a detailed narrative blueprint, focusing on what exists or happens rather than what anyone should do.

Bappa - Dynamic VWAP Simple Vwap, just dynamic colour Coding added to sense whether VWAP is in uptrend or downtrend. Refer to colour code to enter Call side or Put side, it never disappoints you at any timeframe. Enjoy & happy Trading!!
Better results if used in conjuction with Pivots/ fractals indicator, named as Bappa EMA + BBW (V2) indicator.

Smart Money Setup 08 [TradingFinder] Binary Options Gold Scalper🔵 Introduction
In the Smart Money methodology, the market is understood as a structure driven by liquidity flow. This structure forms through the movement of large orders, the accumulation of liquidity, and the reactions that occur around key price zones. The logic of Smart Money is based on the idea that price movement is not random and usually evolves with the intention of collecting liquidity and creating price inefficiencies known as imbalances.
Within this framework, several important stages including the liquidity sweep, the formation of a point of interest, the appearance of an imbalance and the transition of market structure play major roles and collectively define the broader direction of price.
In many bullish scenarios, the market begins by sweeping sell side liquidity and targeting important lows in order to collect the liquidity resting below them. This liquidity collection often becomes the starting point for creating a point of interest which usually marks the area where Smart Money begins to enter the market.
After price moves away from this point, it breaks a structural high and forms a change of character. This shift marks a transition in the balance of power between buyers and sellers and is considered the first clear signal that the market structure is changing.
After the change of character, new institutional order flow often creates a strong and rapid movement that leaves behind an imbalance. This imbalance is one of the most important elements in Smart Money analysis because price tends to return to this area in order to complete structure and restore balance.
The return into the imbalance becomes meaningful when it occurs together with the liquidity sweep, the presence of a validated point of interest and a confirmed structural transition. These conditions frequently mark the beginning of powerful movements within the Smart Money cycle.
Understanding the sequence of liquidity, point of interest, imbalance, change of character and market structure builds the foundation of Smart Money analysis and provides a clear view of the true direction of institutional strength.
Bullish Setup :
Bearish Setup :
🔵 How to Use
To use this framework effectively, the trader must analyze the market through the principles of Smart Money and observe how liquidity drives price. A trade becomes valid only when several essential components appear together in a clear and consistent order.
These components include the liquidity sweep, the formation of a point of interest, the confirmation of a change of character, the transition of market structure and the return of price into an imbalance. The method is built on the understanding that the market first collects liquidity, then shifts order flow and finally provides an entry opportunity inside an inefficient area or inside a point of interest.
For this reason, the trader must follow the path of liquidity from the moment the sweep occurs, through the point of interest and the change of character and finally into the return of price toward the imbalance. When applied correctly, this approach creates entries that are more precise, more structural and more aligned with the real behavior of the market rather than with superficial signals.
🟣 Long Position
A bullish setup in Smart Money structure begins with a liquidity sweep on the sell side. The market first targets the areas where sell side liquidity is located and collects the stops and resting liquidity under previous lows. This collection is the condition that Smart Money requires to begin creating a new order flow. After this liquidity has been taken, a point of interest forms which is usually the last bearish candle or the effective demand zone that initiated the upward movement.
Price then moves away from the point of interest and breaks a structural high which creates a change of character. This event confirms that the market structure has moved from a bearish state to a bullish one and that buying pressure has taken control of the order flow. Following this shift, a strong upward movement often occurs and creates an imbalance between candles. This imbalance reflects the entrance of strong Smart Money orders and is seen as an important confirmation of bullish strength.
When price returns to this imbalance after the displacement, the market enters a phase where Smart Money aims to complete the corrective movement and continue the upward direction. The reaction inside the imbalance when combined with the liquidity sweep, the confirmed point of interest and the change of character completes the bullish setup and forms a structure that often leads to a continuation of the bullish trend.
🟣 Short Position
A bearish setup follows the same Smart Money logic but in the opposite direction. The market begins by collecting buy side liquidity and targets the highs where buy side liquidity and resting stops are located. This liquidity sweep on the buy side becomes the starting phase for Smart Money to initiate a downward order flow. After the liquidity is collected, a bearish point of interest forms which is usually the last bullish candle or the supply zone that created the initial drop.
Price then moves away from this point and breaks the first structural low. This creates a change of character to the downside which confirms that the market structure has transitioned from bullish to bearish and that selling pressure has gained control. After this shift, a strong downward displacement appears and leaves behind a bearish imbalance that clearly shows the dominance of sellers.
As price returns to this imbalance and corrects the inefficient movement, the bearish setup becomes complete as long as the market structure remains bearish. The combination of the buy side liquidity sweep, the bearish point of interest, the change of character, the imbalance and the corrective return creates the ideal structure that Smart Money uses to continue the downward movement and develop a reliable selling opportunity.
🔵 Settings
🟣 Logic Settings
Pivot Period : Defines how many bars are analyzed to identify swing highs and lows. Higher values detect larger, slower structures, while lower values respond to faster patterns. The default value of 5 offers a balanced sensitivity.
🟣 Alert Settings
Alert : Enables alerts for SMS08.
Message Frequency : Determines the frequency of alerts. Options include 'All' (every function call), 'Once Per Bar' (first call within the bar), and 'Once Per Bar Close' (final script execution of the real-time bar). Default is 'Once per Bar'.
Show Alert Time by Time Zone : Configures the time zone for alert messages. Default is 'UTC'.
🔵 Conclusion
The Smart Money approach demonstrates that price movement is not random or based on surface level patterns. Instead, it develops through a clear cycle of liquidity collection, structural transition and corrective movement toward key price zones. By recognizing events such as the liquidity sweep, the formation of the point of interest, the change of character and the return into the imbalance, the trader gains the ability to understand order flow more accurately and identify the true direction of market structure.
Both bullish and bearish setups show that the alignment of these elements creates a transparent view of institutional behavior and reveals the source of strong movements in the market. When the trader correctly identifies this sequence, entry points become more reliable and more aligned with liquidity flow. The combination of liquidity, structure and imbalance provides a consistent framework that removes guesswork and guides decisions through the real logic of the market.

Key Levels: Monday / Weekly / Monthly + Year/Quarter + LiquidityKey Levels: Monday / Weekly / Monthly / Year / Quarter + Liquidity

VaCs Pro Max by CS (Final Version - V9)VaCs Pro Max by CS (Final Version - V9) – TradingView Indicator Overview
Introduction:
The VaCs Pro Max indicator is a comprehensive, all-in-one technical analysis tool designed for traders who seek a clear, visual, and flexible overview of market trends, levels, sessions, and key signals. This advanced TradingView script integrates multiple technical indicators, market level trackers, session visualizations, and the innovative AlphaTrend module to provide actionable insights across any timeframe.
1. Technical Indicators:
This module combines essential trend-following and market momentum tools:
VWAP (Volume Weighted Average Price): Shows the average price weighted by volume, helping traders identify key support/resistance levels. Customizable color allows easy chart visibility.
EMAs (Exponential Moving Averages): Two EMAs (fast and long) track short-term and long-term price trends. Traders can adjust lengths and colors for personalized analysis.
Parabolic SAR: Highlights potential trend reversals with dots above/below candles. Step and maximum settings allow fine-tuning for sensitivity.
S2F Bands (Stock-to-Flow): A dynamic band system representing mid, upper, and lower levels derived from EMA. Useful for identifying overbought/oversold zones.
Logarithmic Growth Channel (LGC): Provides logarithmic regression channels, highlighting long-term price structure and growth trends. Adjustable length and band colors.
Linear Regressions: Two regression lines (short and long) detect trend directions and deviations over customizable periods.
Liquidity Zones: Highlights recent highs/lows over a defined lookback period, showing potential support/resistance clusters.
SMC Markers (Swing Market Context): Marks pivot highs and lows using visual labels, helping identify swing points and trend continuation patterns.
2. Market Levels:
Track weekly and Monday high/low levels for precise intraday and swing trading decisions:
Weekly Levels: Highlight the previous week’s high and low for reference.
Monday Levels: Focus on the day’s opening range, particularly useful for weekly breakout strategies.
3. Session Boxes (UTC):
Visual boxes mark major trading sessions (London, New York) in UTC time:
London Session Box: Highlights market activity between 08:00–16:30 UTC.
New York Session Box: Highlights market activity between 13:30–20:00 UTC.
Boxes automatically adjust to session highs and lows for clear intraday structure visualization.
4. Vertical Session Lines (Turkey Time – UTC+3):
These vertical lines provide an easy-to-read visualization of key market opens and closes:
US (NYSE), EU (LSE), JP (TSE), CN (SSE) lines: Color-coded and labeled, showing market opening and closing times in Turkish local time.
Ideal for identifying session overlaps and liquidity spikes.
5. AlphaTrend Module:
The AlphaTrend module is a dynamic trend-following system offering both visual guidance and trade signals:
Trend Calculation: Uses ATR and RSI/MFI logic to determine dynamic trend levels.
Signals: Generates BUY and SELL markers based on trend crossovers.
Customizable Settings: Multiplier, period, source input, and volume data modes allow tailored sensitivity.
Visuals: Filled areas between main and lag lines highlight trend direction, making it easy to interpret market bias at a glance.
Alerts: Includes multiple alert conditions such as potential and confirmed BUY/SELL, and price crossovers, suitable for automated notifications.
Usage & Benefits:
All modules have on/off toggles in the input panel, allowing users to customize the chart view without losing performance.
Color-coded visuals, session boxes, and trend channels improve readability, especially during high volatility.
Suitable for day trading, swing trading, and long-term analysis due to multi-timeframe adaptability.
The combination of trend indicators, liquidity zones, and session analysis provides a holistic view of market structure.
Alerts enable traders to automate monitoring without constantly staring at the chart.
Conclusion:
VaCs Pro Max by CS (V9) is designed for both professional and semi-professional traders who want an all-inclusive, visually intuitive, and highly configurable TradingView indicator. It merges classical technical indicators with modern trend and session analysis tools, making it an indispensable tool for informed trading decisions.

MM Expected Move [v6]ATMStraddleNeed Update manually based on ATM Straddle Price
例子:
TradingView 图表界面:将鼠标悬停在名字上,点击出现的齿轮图标 (Settings)。在 "ATM Straddle Price" 这一栏,填入ATM Straddle Price(比如 7.0)。
苹果 (AAPL) 股价 235。
235 Call 价格 = 3.5
235 Put 价格 = 3.5
输入数字 = 7.0

Gamma Levels w/AlertsPlots Gamma Levels for identifying Market Positioning. Has alert function on the specific levels.
---To apply to different tickers You Must:
1. apply to chart layout
2. input ticker specific levels
3. Save as an INDICATOR TEMPLATE titled same as ticker (check the remember symbol box)
Now when switching to different tickers, simply open that template

PIVOT BACKGROUND AND TABLE BY PRANOJIT DEYThis shows pivot trend in relation with the day open line. it makes the day bias easily understandable.

Ichimoku Green BG by Pranojit DeyThis indicator shows ichimoku bulliush trend background so that the option buyers can understand bullish trend easily.

Kai GoNoGo 2mKai GoNoGo 2m is a multi-factor trend confirmation system designed for fast intraday trading on the 2-minute chart.
It combines EMAs, MACD, RSI and ADX through a weighted scoring model to generate clear Go / NoGo conditions for both CALL (long) and PUT (short) setups.
The indicator paints the candles with pure colors to show the current strength of the trend:
Strong Go (Bright Blue): Full bullish alignment across EMAs, momentum and trend strength.
Weak Go (Light Blue): Bullish structure but with softer momentum.
Weak NoGo (Light Pink): Bearish structure starting to develop.
Strong NoGo (Bright Pink): Full bearish alignment across all components.
Neutral (Gray): No trend, compression or transition phase.
Components included:
EMA Trend Structure (9/21/50/100/200)
MACD Momentum (12-26-9)
RSI Confirmation (14)
ADX Trend Strength Filter via DMI (14,14)
Scoring system inspired by the original GoNoGo concept, improved for speed-based trading.
Designed for:
Scalping, 0DTE options, FAST trend continuation entries, and momentum confirmation on QQQ, SPY, NQ, ES and high-beta names.
This version uses pure colors (no gradients) for maximum clarity when trading fast charts.
Today Range Calculator1. Indicator Name
Today (Today’s Volatility)
2. One-line Introduction
Displays real-time 30-day historical volatility (HV30) as a compact table on the chart, helping traders instantly assess market risk levels.
3. General Overview
Today ↑↓ is a lightweight informational widget that calculates and displays the 30-day Historical Volatility (HV30) of the asset in real time.
Using logarithmic returns over the past 30 periods, the script computes variance and then annualizes it to express volatility as a percentage (%) per year.
The result is shown in a clean 1x1 table cell, which can be positioned anywhere on the chart—top/bottom, left/right—depending on your preference.
This makes it easy to quickly evaluate whether the current market is high-risk (volatile) or stable, without cluttering the chart.
It’s especially useful for position sizing, risk management, volatility-based entry/exit decisions, and as a filter for breakout strategies.
Built with performance in mind, the script uses minimal system resources and can be used alongside any indicator or strategy without interference.
4. Key Advantages
📈 Real-time HV30 Display
Calculates and displays 30-day historical volatility using annualized log return variance.
📍 Custom Table Positioning
Place the volatility display in any corner of the chart for optimal visibility.
🧮 Accurate Log Return Calculation
Uses logarithmic returns to ensure precise volatility representation over time.
🎯 Quick Market Sentiment Read
Helps you determine at a glance whether the asset is in a calm or volatile environment.
🧼 Minimalist Design
Clean 1-cell table format keeps your chart readable and organized.
🚀 Ultra-Lightweight Script
Runs efficiently with negligible impact on chart performance.
📘 Indicator User Guide
📌 Basic Concept
Today ↑↓ calculates 30-day Historical Volatility (HV30) by analyzing the asset’s log returns over the past 30 bars.
The result is annualized and shown as a percentage to reflect volatility in standardized terms.
Useful for gauging risk levels and strategy suitability in current market conditions.
⚙️ Settings Explained
Table Position: Choose where the volatility table appears:
Top Left / Top Right / Bottom Left / Bottom Right
📈 High Volatility Example
HV30 > 50% indicates a volatile environment
Suggests wider stop-losses, cautious position sizing, or favoring breakout strategies
📉 Low Volatility Example
HV30 < 15% suggests a calm market or range-bound behavior
Useful as a signal for upcoming volatility expansions or breakout preparations
🧪 Recommended Use Cases
Position Sizing: Scale position size based on HV30 readings
Strategy Filter: Activate certain systems only when volatility meets predefined conditions
Breakout Timing: Identify low-volatility zones as potential breakout opportunities
🔒 Precautions
This indicator does not generate buy/sell signals; it is a volatility reference tool
HV thresholds vary across asset classes—adjust interpretation accordingly
Since HV30 is historical, it may lag during rapid market changes

Thi Cloud EMA SystemThis is a spinoff of the Ripster's cloud system.
I altered it in order to be more accurate using the 5 min candle instead of the 10

MAG8 Breadth RSI This indicator is for my personal monitoring breadth of MAG 8 , including AVGO for use to trade spy/es and qqq/nq.
A green bar over 6 translates to 6 out of the 8 stocks have RSI's<30. Conversely a red indicator at 6 would indicate 6 out of 8 are overbought, RSI >70.
Extreme 6-8 of 8 either overbought (red) or oversold (green)
Moderate 4-5 of 8 either overbought (red) or oversold (green)
No Signal 0-3 of 8 either overbought (red) or oversold (green)
Not trading advice but thought I would share.