震盪指標
Flawless Victory Strategy - 15min BTC Machine Learning StrategyHello everyone, I am a heavy Python programmer bringing machine learning to TradingView. This 15 minute Bitcoin Long strategy was created using a machine learning library and 1 year of historical data in Python. Every parameter is hyper optimized to bring you the most profitable buy and sell signals for Bitcoin on the 15min chart. The historical Bitcoin data was gathered from Binance API, in case you want to know the best exchange to use this long strategy. It is a simple Bollinger Band and RSI strategy with two versions included in the tradingview settings. The first version has a Sharpe Ratio of 7.5 which is amazing, and the second version includes the best stop loss and take profit positions with a Sharpe Ratio of 2.5 . Let me talk a little bit more about how the strategy works. The buy signal is triggered when close price is less than lower Bollinger Band at Std Dev 1, and the RSI is greater than a certain value. The sell signal is triggered when close price is greater than upper Bollinger Band at Std Dev 1, and the RSI is greater than a certain value. What makes this strategy interesting is the parameters the Machine Learning library found when backtesting for the best Sharpe Ratio. I left my computer on for about 28 hours to fully backtest 5000 EPOCHS and get the results. I was able to create a great strategy that might be one of TradingView's best strategies out on the website today. I will continue to apply machine learning to all my strategies from here on forward. Please Let me know if you have any questions or certain strategies you would like me to hyper optimize for you. I'm always willing to create profitable strategies!
P.S. You can always pyramid this strategy for more gains! I just don't add pyramiding when creating my strategies because I want to show you the true win/loss ratio based buying one time and one selling one time. I feel like when creating a strategy that includes pyramiding right off the bat falsifies the win rate. This is my way of being transparent with you all. Have fun trading!

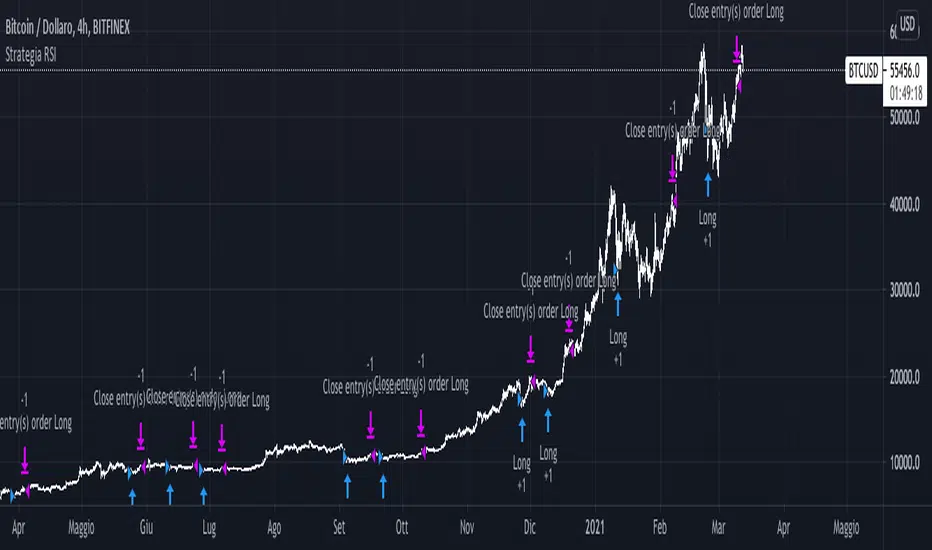
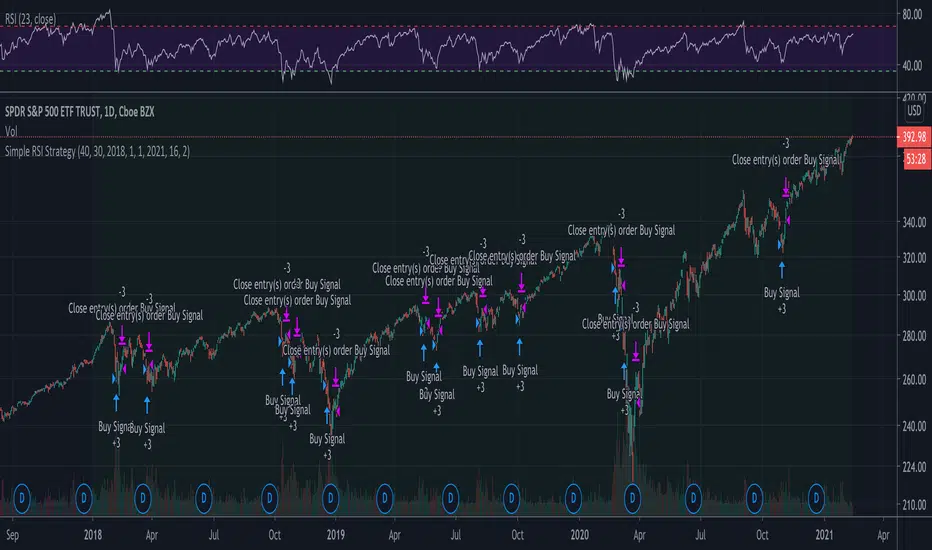
Strategia RSI sempliceQuesto semplice script sfrutta il RSI a 14 periodi per comprare (solo long) quando RSI crocia al rialzo i 30 (oversold line) e chiude l'operazione quando RSI crocia al ribasso i 70 (overbought line).
La strategia è stata progettata sul TimeFrame delle 4H (su BTC) e dimostra come una semplicissima strategia con un solo segnale poteva portare un 20% dal 2020 ad oggi su BTC/USD
TSI HMA CCIHi!
This strategy has TSI and CCI indicators with the CCI being based on a HMA instead of the Price.
There is a number of conditions that must combine to create buy or sell signals, but it is basically a couple of MA crossovers.
The strategy opens new orders on each candle if the conditions are met, Either direction, so it is hedging.
It wont open new orders if there is a floating loss, and so is constantly attempting to hold a floating profit (drawup instead of drawdown)
But It has a StopLoss (set by user) for closing of losing orders, and it closes all orders in basket style when account is in profit to users set amount target profit.
Low commission set to simulate swap but Forex pairs generally dont have commission like the crypto exchanges do. So if you use this on cryptos, remember to increase the commission to your brokers amount.
Crypto users will likely find that because this opens so many orders the commission could erase its profits.
So i recommend this for Forex only, and perhaps, only NZDUSD 4H chart. other pairs, change settings for.
The strategy has settings for testing on target time spans, so you could test it on just Jan-Feb 2020 for example, if you want, or from Jan 2020 to present day.
Have Fun! Open Script for copy/paste/edit/publish your own version :)

RSI Mean Reversion Bot StrategyI started developing this strategy as a way to plug in and test values before defining them in the bots on 3Commas, Coinrule, and Quadency. None of those bots performed the same way my script did and I kept working on it until the strategy finally yielded the same simulated results when paired with the Tradingview bot on Quadency. I looked at all the different RSI strategies already published and saw what each was missing and changed it in mine to make it better:
1. Backtest an actual timeframe by date and time
2. Define the RSI price source
3. Fully manipulate the RSI length
4. Define a stop loss that works
5. Pick Long or Short, or both, based on market conditions. Or compare side by side to decide which you want.

Bollinger Band with RSI
Using combination bollinger band and RSI indicator as guide to predict price volatility and the best entry point. The strategy logic is pretty straightforward where we're interested with close price that touches the lower bollinger band ; there are only two scenarios that will happened after the price reaches the lower band; the price might rebound from the lower bollinger band or drop lower and continue downtrend. To confirm the price movement, we use a second indicator which is the RSI to further investigate the price trend. For example, if the price reaches the lower bollinger band but the RSI value is not in the oversold region, we can conclude that the price will go lower and continue downtrend. If the RSI value is in the oversold region, we can use this price area as our entry point.
Stop loss is necessary to avoid losing too much capital if the RSI value lingers too long in the oversold region.
Best take profit area is when the price rebound above the middle bollinger band area/upper bollinger band or when the RSI reaches overbought region; whichever comes first.
Long entry:
RSI < 30 & close price < lower bollinger band
Exit entry:
RSI > 70
Default stop loss: -25%

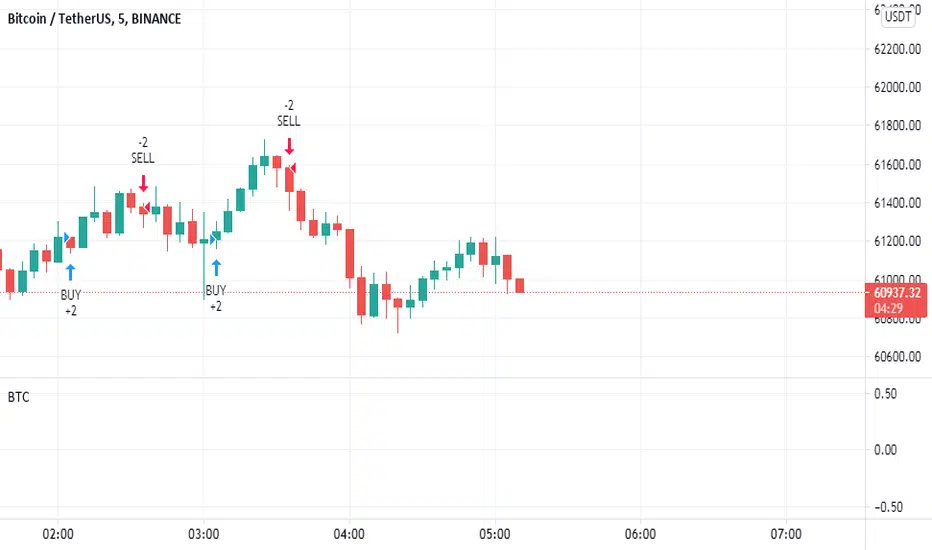
Combo Backtest 123 Reversal & Money Flow Indicator This is combo strategies for get a cumulative signal.
First strategy
This System was created from the Book "How I Tripled My Money In The
Futures Market" by Ulf Jensen, Page 183. This is reverse type of strategies.
The strategy buys at market, if close price is higher than the previous close
during 2 days and the meaning of 9-days Stochastic Slow Oscillator is lower than 50.
The strategy sells at market, if close price is lower than the previous close price
during 2 days and the meaning of 9-days Stochastic Fast Oscillator is higher than 50.
Second strategy
Indicator plots Money Flow Indicator (Chaikin). This indicator looks
to improve on Larry William's Accumulation Distribution formula that
compared the closing price with the opening price. In the early 1970's,
opening prices for stocks stopped being transmitted by the exchanges.
This made it difficult to calculate Williams' formula. The Chaikin
Oscillator uses the average price of the bar calculated as follows
(High + Low) /2 instead of the Open.
The indicator subtracts a 10 period exponential moving average of the
AccumDist function from a 3 period exponential moving average of the
AccumDist function.
WARNING:
- For purpose educate only
- This script to change bars colors.

Combo Backtest 123 Reversal & Modified Price-Volume Trend This is combo strategies for get a cumulative signal.
First strategy
This System was created from the Book "How I Tripled My Money In The
Futures Market" by Ulf Jensen, Page 183. This is reverse type of strategies.
The strategy buys at market, if close price is higher than the previous close
during 2 days and the meaning of 9-days Stochastic Slow Oscillator is lower than 50.
The strategy sells at market, if close price is lower than the previous close price
during 2 days and the meaning of 9-days Stochastic Fast Oscillator is higher than 50.
Second strategy
The related article is copyrighted material from
Stocks & Commodities.
WARNING:
- For purpose educate only
- This script to change bars colors.

Combo Backtest 123 Reversal & MASS Index This is combo strategies for get a cumulative signal.
First strategy
This System was created from the Book "How I Tripled My Money In The
Futures Market" by Ulf Jensen, Page 183. This is reverse type of strategies.
The strategy buys at market, if close price is higher than the previous close
during 2 days and the meaning of 9-days Stochastic Slow Oscillator is lower than 50.
The strategy sells at market, if close price is lower than the previous close price
during 2 days and the meaning of 9-days Stochastic Fast Oscillator is higher than 50.
Second strategy
The Mass Index was designed to identify trend reversals by measuring
the narrowing and widening of the range between the high and low prices.
As this range widens, the Mass Index increases; as the range narrows
the Mass Index decreases.
The Mass Index was developed by Donald Dorsey.
WARNING:
- For purpose educate only
- This script to change bars colors.

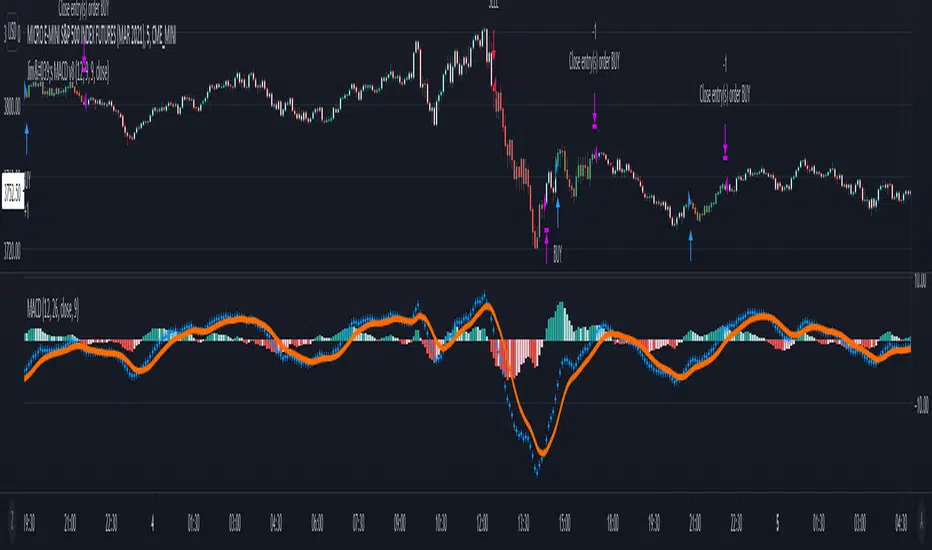
Jim's MACDMACD Buy/Sell Strategy
Filters bearish crossovers above the 0 line and bullish crossovers below.
Uses 34 ema to further filter the trades and take only longs above and only shorts below.
Apply at least 2:1 risk to reward ratio to account for losing trades.
Trade at own risk!
Scalping using RSI 2 indicator with TSLThis strategy implements a simply scalping using the RSI (calculated on two periods), the slopes of two MAs ( EMA or SMA ) having different lengths (by default, I use 50 and 200).
A trailing stop loss (%) is used.
Entry conditions:
.) Fast MA > Slow MA and Price > Slow MA and RSI < Oversold Threshold ------> go Long
.) Fast MA < Slow MA and Price < Slow MA and RSI > Overbought Threshold ------> go Short
Exit conditions:
.) Long entry condition is true and (close >= TP or close <= TSL ) ----> close short position
.) Short entry condition is true and (close <= TP or close >= TSL ) ----> close long position
The strategy performed best on Bitcoin and the most liquid and capitalized Altcoins but works excellent on volatile assets, mainly if they often go trending.
Works best on 3h - 4h time frame.
There's also an optional Volatility filter, which opens the position only if the difference between the two slopes is more than a specific value, which can be set in the study inputs. The purpose is not opening positions if the price goes sideways and the noise is way > than the signal.
Note:
.) the RSI length is 2;
.) the oversold Threshold is 90%;
.) the overbought Threshold is 10%;
.) by default, the trailing stop loss per cent is 1%;
.) by default, the fast MA length is 50;
.) by default, the slow MA length is 200;
.) by default, the MA used is EMA.
Cheers.

RSI Classic Strategy (by Coinrule)One of the questions hobbyist traders more often ask is: what is the perfect trading indicator?
Every indicator is just a tool, so its efficiency is proportional to your ability to read its signals and translate them into an actionable trading strategy. The RSI is likely the most flexible and easy to use among the technical indicators.
This trading strategy tries to catch short-term swings on the coins of your choice with a simple yet profitable setup.
Buy when the RSI is lower than 30 (you can adjust it to 35 in times of steep uptrend).
Sell when the RSI is greater than 65 (the target may range between 60 and 75 depending on the volatility of the coin).
Note that the buy signal comes when the indicator crosses below 30 and not when it crosses above 30 as it happens on the built-in RSI strategy on Tradingview.
The present script overperforms the built-in strategy, even adding trading fees and using a lower amount of capital for each trade (30%). That means that the system can deliver higher net-profits with lower risk levels.
A typical example of market conditions where this strategy works perfectly is as follows.
The first initial breakout indicates that a new leg up in the trend may start. Bitcoin starts to trade within a range which you can identify when it reaches the point 3. That is the perfect time to start the rule because
- trading within a channel anticipates possible swings up and down
- the trend is on the upside, providing low downside risk in buying the dips.
This strategy works well with selected coins of your choice, and it's a great fit on leverage exchanges like Binance Futures.
If you prefer to run it across all available coins on the market, instead, you may choose an optimized version.

Combo Backtest 123 Reversal & Martin Pring's Special K This is combo strategies for get a cumulative signal.
First strategy
This System was created from the Book "How I Tripled My Money In The
Futures Market" by Ulf Jensen, Page 183. This is reverse type of strategies.
The strategy buys at market, if close price is higher than the previous close
during 2 days and the meaning of 9-days Stochastic Slow Oscillator is lower than 50.
The strategy sells at market, if close price is lower than the previous close price
during 2 days and the meaning of 9-days Stochastic Fast Oscillator is higher than 50.
Second strategy
Pring's Special K is a cyclical indicator created by Martin Pring.
His method combines short-term, intermediate and long-term velocity
into one complete series. Useful tool for Long Term Investors
Modified for any source.
WARNING:
- For purpose educate only
- This script to change bars colors.
Example of Simple RSI Buy/Sell at a level and hold for 10 daysScript implements strategy:
1 Buy at RSI (10) < 30
2 Sell at RSI (10) > 40 or after 10 days
The strategy is not profitable for long term trading.
Buy and Hold entry finder StrategyHello everyone!
I proudly present the backtest Strategy Script for my "Buy and Hold entry finder" Script.
It basically shows you the outcome, if you would use my indicator in the past.
The buy signals are limited to 1 order per month.
Order Size: Allows you to choose, how much money you want to invest per month. (Please consider, it will only invest an x amount per Order, but it will not stack the amount you did not invest in an previous month ) (Example in my indicator)
Pyramiding: Just regulates, how often you can open an position.
Commission: Here you can set how much it will cost to open an position at your broker.
I coded a feature that allows you to set a Start Date and an End Date for your backtest. In the end of the backtest the script closes all positions.
If you got any question, feel free to ask in the comments or send me a message.
Sincerely, RS Titan.

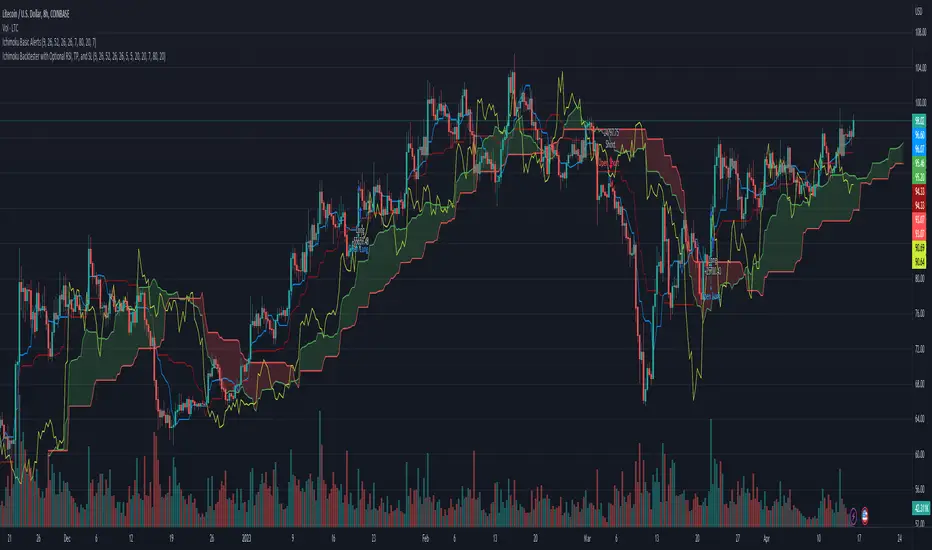
Ichimoku Backtester with TP, SL, and Cloud Confirmation OptionStarted with the Basic Ichimoku strategy from Mizuki32. Added Take Profit, Stop Loss (for both long and short), and a toggle to wait for confirmation from the cloud.
RSI-VWAP Indicator %█ OVERALL
Simple and effective script that, as you already know, uses vwap as source of the rsi, and with good results as long as the market has no long-term downtrend.
RsiVwap = rsi (vwap (close), Length)
The default settings are for BTC in a 30 minute time frame. For other pairs and time frames you just have to play with the settings.
█ FEATURES
• The option to start trading from a certain date has been added.
• To make the profit more progressive, a percentage of your equity is used for entries and a percentage of your position is used for closings.
• The option to trade in Spot mode has been added, since, for the TradingView backtest, the money is infinite and if you do not limit it somehow,
it would offer you much better profits than the live trading.
QuantityOnLong = Spot ? (EquityPercent / 100) * ((strategy.equity / close) - strategy.position_size) : (EquityPercent / 100) * (strategy.equity / close)
• The option to stop the system when the drawdown exceeds the fixed limit has been added.
Drawdown, as you already know, is a very important measure of risk in trading systems.
The maximum drawdown will tell us what the maximum loss of a trading system has been during a period. This maximum loss is determined by:
strategy.risk.max_drawdown(Risk, strategy.percent_of_equity)
• Leverage plotted on labels added.
█ ALERTS
To enjoy the benefits of automatic trading, TradingView alerts can be used as direct buy-sell orders on spot, or long-close orders with leverage.
Currently there are Chrome extensions that act as a bridge between TradingView and your Exchange or Broker.
This is an example of syntax for this type of extensions. Copy and paste a message like this into the alert window:
{{strategy.order.action}} @ {{strategy.order.price}} | e = {{exchange}} a = account s = {{ticker}} b = {{strategy.order.action}} {{strategy.order.alert_message}}
█ NOTE
Certain Risks of Live Algorithmic Trading You Should Know:
• Backtesting cannot assure actual results.
• The relevant market might fail or behave unexpectedly.
• Your broker may experience failures in its infrastructure, fail to execute your orders in a correct or timely fashion or reject your orders.
• The system you use for generating trading orders, communicating those orders to your broker, and receiving queries and trading results from your broker may fail.
• Time lag at various point in live trading might cause unexpected behavior.
• The systems of third parties in addition to those of the provider from which we obtain various services, your broker, and the applicable securities market may fail or malfunction.
█ THANKS
Thanks to TradingView, its Pine code, its community and especially those Pine wizards who post their ideas that helps us to learn.
If the world is heading toward a equitable new world economic order, let's get rich first ...
Happy trading!

Oscillator Evaluator (Analysis tool)Oscillator Evaluator (Analysis tool)
The oscillator evaluator is a tool that will help you analyse and compare the oscillator of your choice to another 2 oscillators.
By selecting the strategy with which you will analyze the oscillators, you will be able to see the behaviour of the oscillators in different aspects.
First there is a moving average increase or decrease strategy, that will give you a good idea of the correlation of the oscillator with the price.
The second is a commom 2 MA crossover strategy, that will give you and idea of the validaty of that oscillator as a strategy or as a trend filter.
The third strategy is a cross over 0 signal, that will go long on a crossover of 0 and short on a crossunder 0. This helps you see how good is the oscillator at evaluating suport and resistance areas and give you an idea of its balance.
The forth strategy is a Buy/Sell on extremes of the oscillator and will let you know how good is your strategy at spotting good places to buy and sell.
The fith strategy is to evaluate how goood the oscillator is as a mean reversion filter or how good it is at spotting small price changes.
The sixth strategy is similar to the last but is focused on how good is the oscillator spotting good places to take profits on trending strategies.
The 6 strategies in the script produce signals from the oscillator and from the oscillator only.
In conclusion this tool can be used to measure your oscillator and see if it really is as good as you think in comparison to others.
This script is not intended to be used as a full strategy but as a tool.

MA Divergences StrategyThis is the Strategy version of the Study I published. It is a Moving Average that can be applied to any plot to plot divergences on any oscillator, as well as perform backtesting. You'll need a REALLY good oscillator to perform live trades using this alone, but I think it is a valuable tool and had the Strategy hanging around and for some reason didn't upload it yet.
So here it is.
Turn Length to 1 to follow the oscillator without lag. Turn Length up if you are getting too many false signals or tweak the original oscillator settings.
RSI of MACD Strategy [Long only]This strategy uses the RSI on MACD indicator.
BUY
====
When RSI indicator crossing over 30 or 35 line and price above slow ema
Note: when the position already taken, you may reenter on the purple candle
Partial Exit
==========
Partial profit taking option is available in settings. If this is selected , 1/3 position exited when RSI indicator crossing down 80 line
Close
=====
When RSI indicator crossing below 15
Stop Loss
=========
I havent used hard stop loss in this strategy. Reason is , when price going down , indicator may go up ... so just wanted to ride along with indicator ...
Stop loss mentioned in the settings is used in calculation of how many units can be be purchased based on risk level
Tested with SPY and QQQ ETFs on hourly chart
Warning
=========
For the eductional purposes only ...
This is not a financial advise. please do your own research before taking any trading decission

Super Momentum StrategyThis is a strategy utilizing multiple of Evergets RMI (thanks to him for permission to publish) and a Chance Momentum.
It buys when 4 of the RMIs are below their thresholds and sells when they are above. There is a 5th one I added last night that works in Reverse - buy when its above and sell when below, which should work better for pyramiding strats by using it at the right rate to set the overall trend.
Very basic sample below, I could have set it up better as my example but just want to publish.

Combo Backtest 123 Reversal & Market Facilitation Index This is combo strategies for get a cumulative signal.
First strategy
This System was created from the Book "How I Tripled My Money In The
Futures Market" by Ulf Jensen, Page 183. This is reverse type of strategies.
The strategy buys at market, if close price is higher than the previous close
during 2 days and the meaning of 9-days Stochastic Slow Oscillator is lower than 50.
The strategy sells at market, if close price is lower than the previous close price
during 2 days and the meaning of 9-days Stochastic Fast Oscillator is higher than 50.
Second strategy
The Market Facilitation Index is an indicator that relates price range to
volume and measures the efficency of price movement. Use the indicator to
determine if the market is trending. If the Market Facilitation Index increased,
then the market is facilitating trade and is more efficient, implying that the
market is trending. If the Market Facilitation Index decreased, then the market
is becoming less efficient, which may indicate a trading range is developing that
may be a trend reversal.
WARNING:
- For purpose educate only
- This script to change bars colors.
