Simple RSI stock Strategy [1D] The "Simple RSI Stock Strategy " is designed to long-term traders. Strategy uses a daily time frame to capitalize on signals generated by the Relative Strength Index (RSI) and the Simple Moving Average (SMA). This strategy is suitable for low-leverage trading environments and focuses on identifying potential buy opportunities when the market is oversold, while incorporating strong risk management with both dynamic and static Stop Loss mechanisms.
This strategy is recommended for use with a relatively small amount of capital and is best applied by diversifying across multiple stocks in a strong uptrend, particularly in the S&P 500 stock market. It is specifically designed for equities, and may not perform well in other markets such as commodities, forex, or cryptocurrencies, where different market dynamics and volatility patterns apply.
Indicators Used in the Strategy:
1. RSI (Relative Strength Index):
- The RSI is a momentum oscillator used to identify overbought and oversold conditions in the market.
- This strategy enters long positions when the RSI drops below the oversold level (default: 30), indicating a potential buying opportunity.
- It focuses on oversold conditions but uses a filter (SMA 200) to ensure trades are only made in the context of an overall uptrend.
2. SMA 200 (Simple Moving Average):
- The 200-period SMA serves as a trend filter, ensuring that trades are only executed when the price is above the SMA, signaling a bullish market.
- This filter helps to avoid entering trades in a downtrend, thereby reducing the risk of holding positions in a declining market.
3. ATR (Average True Range):
- The ATR is used to measure market volatility and is instrumental in setting the Stop Loss.
- By multiplying the ATR value by a custom multiplier (default: 1.5), the strategy dynamically adjusts the Stop Loss level based on market volatility, allowing for flexibility in risk management.
How the Strategy Works:
Entry Signals:
The strategy opens long positions when RSI indicates that the market is oversold (below 30), and the price is above the 200-period SMA. This ensures that the strategy buys into potential market bottoms within the context of a long-term uptrend.
Take Profit Levels:
The strategy defines three distinct Take Profit (TP) levels:
TP 1: A 5% from the entry price.
TP 2: A 10% from the entry price.
TP 3: A 15% from the entry price.
As each TP level is reached, the strategy closes portions of the position to secure profits: 33% of the position is closed at TP 1, 66% at TP 2, and 100% at TP 3.
Visualizing Target Points:
The strategy provides visual feedback by plotting plotshapes at each Take Profit level (TP 1, TP 2, TP 3). This allows traders to easily see the target profit levels on the chart, making it easier to monitor and manage positions as they approach key profit-taking areas.
Stop Loss Mechanism:
The strategy uses a dual Stop Loss system to effectively manage risk:
ATR Trailing Stop: This dynamic Stop Loss adjusts based on the ATR value and trails the price as the position moves in the trader’s favor. If a price reversal occurs and the market begins to trend downward, the trailing stop closes the position, locking in gains or minimizing losses.
Basic Stop Loss: Additionally, a fixed Stop Loss is set at 25%, limiting potential losses. This basic Stop Loss serves as a safeguard, automatically closing the position if the price drops 25% from the entry point. This higher Stop Loss is designed specifically for low-leverage trading, allowing more room for market fluctuations without prematurely closing positions.
to determine the level of stop loss and target point I used a piece of code by RafaelZioni, here is the script from which a piece of code was taken
Together, these mechanisms ensure that the strategy dynamically manages risk while offering robust protection against significant losses in case of sharp market downturns.
The position size has been estimated by me at 75% of the total capital. For optimal capital allocation, a recommended value based on the Kelly Criterion, which is calculated to be 59.13% of the total capital per trade, can also be considered.
Enjoy !
震盪指標

Commitment of Trader %R StrategyThis Pine Script strategy utilizes the Commitment of Traders (COT) data to inform trading decisions based on the Williams %R indicator. The script operates in TradingView and includes various functionalities that allow users to customize their trading parameters.
Here’s a breakdown of its key components:
COT Data Import:
The script imports the COT library from TradingView to access historical COT data related to different trader groups (commercial hedgers, large traders, and small traders).
User Inputs:
COT data selection mode (e.g., Auto, Root, Base currency).
Whether to include futures, options, or both.
The trader group to analyze.
The lookback period for calculating the Williams %R.
Upper and lower thresholds for triggering trades.
An option to enable or disable a Simple Moving Average (SMA) filter.
Williams %R Calculation: The script calculates the Williams %R value, which is a momentum indicator that measures overbought or oversold levels based on the highest and lowest prices over a specified period.
SMA Filter: An optional SMA filter allows users to limit trades to conditions where the price is above or below the SMA, depending on the configuration.
Trade Logic: The strategy enters long positions when the Williams %R value exceeds the upper threshold and exits when the value falls below it. Conversely, it enters short positions when the Williams %R value is below the lower threshold and exits when the value rises above it.
Visual Elements: The script visually indicates the Williams %R values and thresholds on the chart, with the option to plot the SMA if enabled.
Commitment of Traders (COT) Data
The COT report is a weekly publication by the Commodity Futures Trading Commission (CFTC) that provides a breakdown of open interest positions held by different types of traders in the U.S. futures markets. It is widely used by traders and analysts to gauge market sentiment and potential price movements.
Data Collection: The COT data is collected from futures commission merchants and is published every Friday, reflecting positions as of the previous Tuesday. The report categorizes traders into three main groups:
Commercial Traders: These are typically hedgers (like producers and processors) who use futures to mitigate risk.
Non-Commercial Traders: Often referred to as speculators, these traders do not have a commercial interest in the underlying commodity but seek to profit from price changes.
Non-reportable Positions: Small traders who do not meet the reporting threshold set by the CFTC.
Interpretation:
Market Sentiment: By analyzing the positions of different trader groups, market participants can gauge sentiment. For instance, if commercial traders are heavily short, it may suggest they expect prices to decline.
Extreme Positions: Some traders look for extreme positions among non-commercial traders as potential reversal signals. For example, if speculators are overwhelmingly long, it might indicate an overbought condition.
Statistical Insights: COT data is often used in conjunction with technical analysis to inform trading decisions. Studies have shown that analyzing COT data can provide valuable insights into future price movements (Lund, 2018; Hurst et al., 2017).
Scientific References
Lund, J. (2018). Understanding the COT Report: An Analysis of Speculative Trading Strategies.
Journal of Derivatives and Hedge Funds, 24(1), 41-52. DOI:10.1057/s41260-018-00107-3
Hurst, B., O'Neill, R., & Roulston, M. (2017). The Impact of COT Reports on Futures Market Prices: An Empirical Analysis. Journal of Futures Markets, 37(8), 763-785.
DOI:10.1002/fut.21849
Commodity Futures Trading Commission (CFTC). (2024). Commitment of Traders. Retrieved from CFTC Official Website.

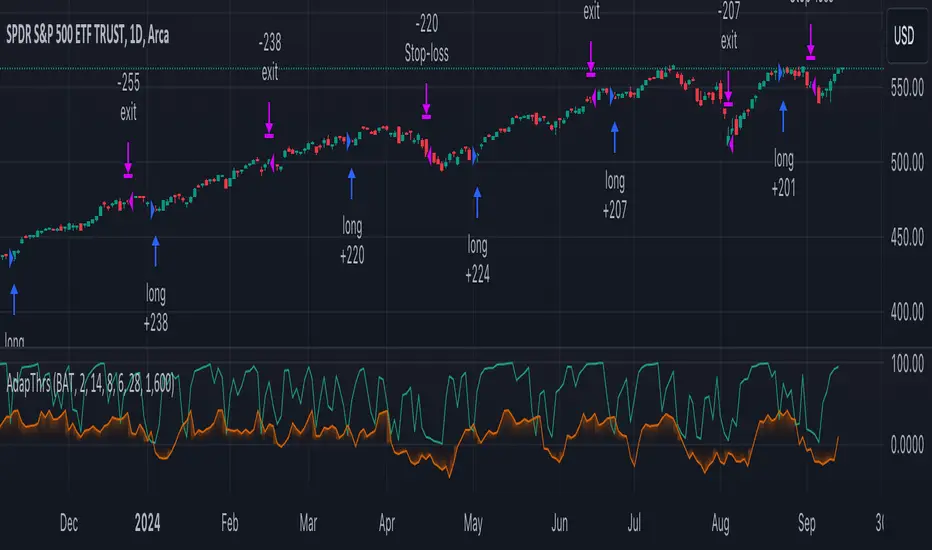
TASC 2024.10 Adaptive Oscillator Threshold█ OVERVIEW
This script introduces a more dynamic approach to generating trading signals using the RSI indicator and a threshold that adapts to price trends and dispersion. This methodology comes from Francesco Bufi's article "Overbought/Oversold Oscillators: Useless Or Just Misused" from the October 2024 edition of TASC's Traders' Tips .
█ CONCEPTS
According to Francesco Bufi's observations, an oscillator-based buy signal should have a threshold that varies with the trend direction: higher during uptrends and lower during downtrends. Additionally, the level should decrease as the distance from the price to its mean increases to reduce signals in volatile conditions. Accordingly, Bufi proposes a formula for an adaptive buy level whose value is proportional to the trend (linear regression slope) and inversely proportional to the typical distance between price and its mean (standard deviation). Traders can apply this method to any oscillator to add adaptivity without modifying the oscillator's calculations, as it's simply an adaptive technique for interpreting the calculated values.
This script demonstrates the application of Bufi's Adaptive Threshold (BAT) in a simple RSI-based strategy and allows users to compare its performance to the traditional fixed-threshold approach. Bufi's observations suggest that using the BAT instead of a static threshold can help improve the backtest performance of oscillator-based systems.
█ DISCLAIMER
This strategy script educates users on the trading systems outlined by the TASC article. By default, it uses 10% of equity as the order size and a slippage amount of 5 ticks. Traders should adjust these settings and the commission amount when using this script.
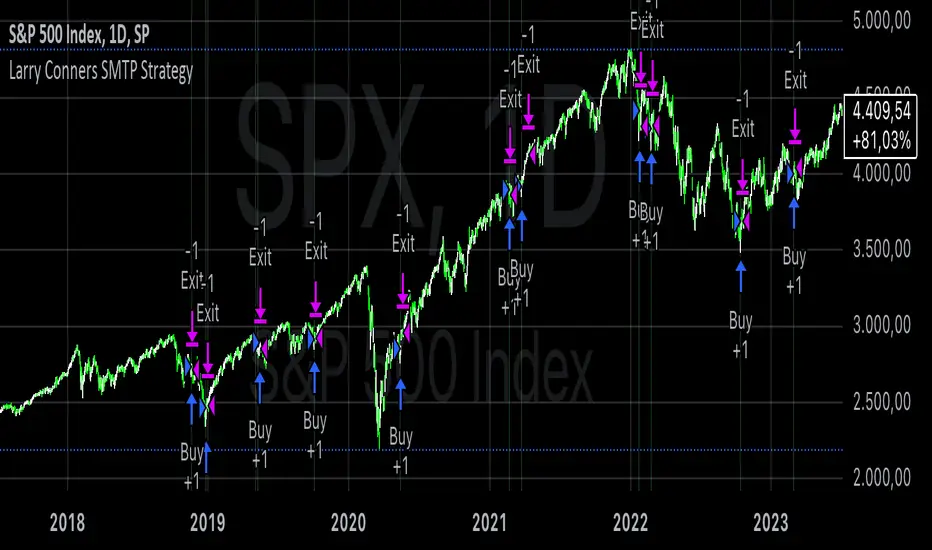
Larry Conners SMTP StrategyThe Spent Market Trading Pattern is a strategy developed by Larry Connors, typically used for short-term mean reversion trading. This strategy takes advantage of the exhaustion in market momentum by entering trades when the market is perceived as "spent" after extended trends or extreme moves, expecting a short-term reversal. Connors uses indicators like RSI (Relative Strength Index) and price action patterns to identify these opportunities.
Key Elements of the Strategy:
Overbought/Oversold Conditions: The strategy looks for extreme overbought or oversold conditions, often indicated by low RSI values (below 30 for oversold and above 70 for overbought).
Mean Reversion: Connors believed that markets, especially in short-term scenarios, tend to revert to the mean after periods of strong momentum. The "spent" market is assumed to have expended its energy, making a reversal likely.
Entry Signals:
In an uptrend, a stock or market index making a significant number of consecutive up days (e.g., 5-7 consecutive days with higher closes) indicates overbought conditions.
In a downtrend, a similar number of consecutive down days indicates oversold conditions.
Reversal Anticipation: Once an extreme in price movement is identified (such as consecutive gains or losses), the strategy places trades anticipating a reversion to the mean, which is usually the 5-day or 10-day moving average.
Exit Points: Trades are exited when prices move back toward their mean or when the extreme conditions dissipate, usually based on RSI or moving average thresholds.
Why the Strategy Works:
Human Psychology: The strategy capitalizes on the fact that markets, in the short term, often behave irrationally due to the emotions of traders—fear and greed lead to overextended moves.
Mean Reversion Tendency: Financial markets often exhibit mean-reverting behavior, where prices temporarily deviate from their historical norms but eventually return. Short-term exhaustion after a strong rally or sell-off offers opportunities for quick profits.
Overextended Moves: Markets that rise or fall too quickly tend to become overextended, as buyers or sellers get exhausted, making reversals more probable. Connors’ approach identifies these moments when the market is "spent" and ripe for a reversal.
Risks of the Spent Market Trading Pattern Strategy:
Trend Continuation: One of the key risks is that the market may not revert as expected and instead continues in the same direction. In trending markets, mean-reversion strategies can suffer because strong trends can last longer than anticipated.
False Signals: The strategy relies heavily on technical indicators like RSI, which can produce false signals in volatile or choppy markets. There can be times when a market appears "spent" but continues in its current direction.
Market Timing: Mean reversion strategies often require precise market timing. If the entry or exit points are mistimed, it can lead to losses, especially in short-term trades where small price movements can significantly impact profitability.
High Transaction Costs: This strategy requires frequent trades, which can lead to higher transaction costs, especially in markets with wide bid-ask spreads or high commissions.
Conclusion:
Larry Connors’ Spent Market Trading Pattern strategy is built on the principle of mean reversion, leveraging the concept that markets tend to revert to a mean after extreme moves. While effective in certain conditions, such as range-bound markets, it carries risks—especially during strong trends—where price momentum may not reverse as quickly as expected.
For a more in-depth explanation, Larry Connors’ books such as "Short-Term Trading Strategies That Work" provide a comprehensive guide to this and other strategies .
Tian Di Grid Merge Version 6.0
Strategy Introduction:
1. We know that the exchange can only set a maximum of 100 grids. However, our grid strategy can set a maximum of 350 grids.
2. We have added the modes of proportional and differential warehousing.
3. It should be noted that we have not set any filtering conditions, which means that when the price falls below the grid, we will execute a buy action at the closing price, and when the price falls above the grid, we will execute a sell action;
4. We suggest limiting the trading time cycle to 5 meters, as sometimes errors may appear on TV due to the dense grid or the inability to draw so many grids;
5. Please ensure that the minimum spacing between each grid is not less than 0.1%, as this is extremely difficult to profit from, and on the other hand, it may not function due to excessively dense spacing;
6. The maximum number of grids is 350, and the minimum number is currently 3;
matters needing attention:
Don't choose to go long or short together, and don't choose to go even short or short;
Closing position setting: It is recommended to select it to avoid order accumulation;
Unable to trade: If unable to trade normally, switch to a 1m cycle;
Number of cells: Calculate it yourself, 350 is just the maximum number of cells that can be adjusted;
Grid spacing: minimum 0.1%, below which no profit can be made;
Position value: default is 100u, which is the amount already leveraged;
Multiple investment: The order amount for each order is the same, and there is no need for multiple investment;
Open both long and short positions: You can open multiple positions for one account and open one position for one account. Do not open both long and short positions for the same target at the same time
DCA, Support and Resistance with RSI and Trend FilterThis script is based on
script from Kieranj with added pyramiding and DCA
The buy condition (buyCondition) is triggered when the RSI crosses above the oversold threshold (ta.crossover(rsi, oversoldThreshold)), the trend filter confirms an uptrend (isUptrend is true), and the close price is greater than or equal to the support level (close >= supportLevel).
The partial sell condition (sellCondition) is triggered when the RSI crosses below the overbought threshold (ta.crossunder(rsi, overboughtThreshold)) and profit goal is reached, the trend filter confirms a downtrend (isUptrend is false), and the close price is less than or equal to the resistance level (close <= resistanceLevel).
Full sell will be triggered if trend is broken and profit goal is reached
With this implementation, the signals will only be generated in the direction of the trend on the 4-hour timeframe. The trend is considered up when the 50-period SMA is below the 200-period SMA (ta.sma(trendFilterSource, 50) < ta.sma(trendFilterSource, 200)).
Pyramiding should be activated, values like 100, so every DCA step should be around 1%
i have best results on 5 min charts
Larry Connors %b Strategy (Bollinger Band)Larry Connors’ %b Strategy is a mean-reversion trading approach that uses Bollinger Bands to identify buy and sell signals based on the %b indicator. This strategy was developed by Larry Connors, a renowned trader and author known for his systematic, data-driven trading methods, particularly those focusing on short-term mean reversion.
The %b indicator measures the position of the current price relative to the Bollinger Bands, which are volatility bands placed above and below a moving average. The strategy specifically targets times when prices are oversold within a long-term uptrend and aims to capture rebounds by buying at relatively low points and selling at relatively high points.
Strategy Rules
The basic rules of the %b Strategy are:
1. Trend Confirmation: The closing price must be above the 200-day moving average. This filter ensures that trades are made in alignment with a longer-term uptrend, thereby avoiding trades against the primary market trend.
2. Oversold Conditions: The %b indicator must be below 0.2 for three consecutive days. The %b value below 0.2 indicates that the price is near the lower Bollinger Band, suggesting an oversold condition.
3. Entry Signal: Enter a long position at the close when conditions 1 and 2 are met.
4. Exit Signal: Exit the position when the %b value closes above 0.8, signaling an overbought condition where the price is near the upper Bollinger Band.
How the Strategy Works
This strategy operates on the premise of mean reversion, which suggests that extreme price movements will revert to the mean over time. By entering positions when the %b value indicates an oversold condition (below 0.2) in a confirmed uptrend, the strategy attempts to capture short-term price rebounds. The exit rule (when %b is above 0.8) aims to lock in profits once the price reaches an overbought condition, often near the upper Bollinger Band.
Who Was Larry Connors?
Larry Connors is a well-known figure in the world of financial markets and trading. He co-authored several influential trading books, including “Short-Term Trading Strategies That Work” and “High Probability ETF Trading.” Connors is recognized for his quantitative approach, focusing on systematic, rules-based strategies that leverage historical data to validate trading edges.
His work primarily revolves around short-term trading strategies, often using technical indicators like RSI (Relative Strength Index), Bollinger Bands, and moving averages. Connors’ methodologies have been widely adopted by traders seeking structured approaches to exploit short-term inefficiencies in the market.
Risks of the Strategy
While the %b Strategy can be effective, particularly in mean-reverting markets, it is not without risks:
1. Mean Reversion Assumption: The strategy is based on the assumption that prices will revert to the mean. In trending or sharply falling markets, this reversion may not occur, leading to sustained losses.
2. False Signals in Choppy Markets: In volatile or sideways markets, the strategy may generate multiple false signals, resulting in whipsaw trades that can erode capital through frequent small losses.
3. No Stop Loss: The basic implementation of the strategy does not include a stop loss, which increases the risk of holding losing trades longer than intended, especially if the market continues to move against the position.
4. Performance During Market Crashes: During major market downturns, the strategy’s buy signals could be triggered frequently as prices decline, compounding losses without the presence of a risk management mechanism.
Scientific References and Theoretical Basis
The %b Strategy relies on the concept of mean reversion, which has been extensively studied in finance literature. Studies by Avellaneda and Lee (2010) and Bouchaud et al. (2018) have demonstrated that mean-reverting strategies can be profitable in specific market environments, particularly when combined with volatility filters like Bollinger Bands. However, the same studies caution that such strategies are highly sensitive to market conditions and often perform poorly during periods of prolonged trends.
Bollinger Bands themselves were popularized by John Bollinger and are widely used to assess price volatility and detect potential overbought and oversold conditions. The %b value is a critical part of this analysis, as it standardizes the position of price relative to the bands, making it easier to compare conditions across different securities and time frames.
Conclusion
Larry Connors’ %b Strategy is a well-known mean-reversion technique that leverages Bollinger Bands to identify buying opportunities in uptrending markets when prices are temporarily oversold. While the strategy can be effective under the right conditions, traders should be aware of its limitations and risks, particularly in trending or highly volatile markets. Incorporating risk management techniques, such as stop losses, could help mitigate some of these risks, making the strategy more robust against adverse market conditions.

Larry Connors RSI 3 StrategyThe Larry Connors RSI 3 Strategy is a short-term mean-reversion trading strategy. It combines a moving average filter and a modified version of the Relative Strength Index (RSI) to identify potential buying opportunities in an uptrend. The strategy assumes that a short-term pullback within a long-term uptrend is an opportunity to buy at a discount before the trend resumes.
Components of the Strategy:
200-Day Simple Moving Average (SMA): The price must be above the 200-day SMA, indicating a long-term uptrend.
2-Period RSI: This is a very short-term RSI, used to measure the speed and magnitude of recent price changes. The standard RSI is typically calculated over 14 periods, but Connors uses just 2 periods to capture extreme overbought and oversold conditions.
Three-Day RSI Drop: The RSI must decline for three consecutive days, with the first drop occurring from an RSI reading above 60.
RSI Below 10: After the three-day drop, the RSI must reach a level below 10, indicating a highly oversold condition.
Buy Condition: All the above conditions must be satisfied to trigger a buy order.
Sell Condition: The strategy closes the position when the RSI rises above 70, signaling that the asset is overbought.
Who Was Larry Connors?
Larry Connors is a trader, author, and founder of Connors Research, a firm specializing in quantitative trading research. He is best known for developing strategies that focus on short-term market movements. Connors co-authored several popular books, including "Street Smarts: High Probability Short-Term Trading Strategies" with Linda Raschke, which has become a staple among traders seeking reliable, rule-based strategies. His research often emphasizes simplicity and robust testing, which appeals to both retail and institutional traders.
Scientific Foundations
The Relative Strength Index (RSI), originally developed by J. Welles Wilder in 1978, is a momentum oscillator that measures the speed and change of price movements. It oscillates between 0 and 100 and is typically used to identify overbought or oversold conditions in an asset. However, the use of a 2-period RSI in Connors' strategy is unconventional, as most traders rely on longer periods, such as 14. Connors' research showed that using a shorter period like 2 can better capture short-term reversals, particularly when combined with a longer-term trend filter such as the 200-day SMA.
Connors' strategies, including this one, are built on empirical research using historical data. For example, in a study of over 1,000 signals generated by this strategy, Connors found that it performed consistently well across various markets, especially when trading ETFs and large-cap stocks (Connors & Alvarez, 2009).
Risks and Considerations
While the Larry Connors RSI 3 Strategy is backed by empirical research, it is not without risks:
Mean-Reversion Assumption: The strategy is based on the premise that markets revert to the mean. However, in strong trending markets, the strategy may underperform as prices can remain oversold or overbought for extended periods.
Short-Term Nature: The strategy focuses on very short-term movements, which can result in frequent trading. High trading frequency can lead to increased transaction costs, which may erode profits.
Market Conditions: The strategy performs best in certain market environments, particularly in stable uptrends. In highly volatile or strongly trending markets, the strategy's performance can deteriorate.
Data and Backtesting Limitations: While backtests may show positive results, they rely on historical data and do not account for future market conditions, slippage, or liquidity issues.
Scientific literature suggests that while technical analysis strategies like this can be effective in certain market conditions, they are not foolproof. According to Lo et al. (2000), technical strategies may show patterns that are statistically significant, but these patterns often diminish once they are widely adopted by traders.
References
Connors, L., & Alvarez, C. (2009). Short-Term Trading Strategies That Work. TradingMarkets Publishing Group.
Lo, A. W., Mamaysky, H., & Wang, J. (2000). Foundations of Technical Analysis: Computational Algorithms, Statistical Inference, and Empirical Implementation. The Journal of Finance, 55(4), 1705-1770.
Wilder, J. W. (1978). New Concepts in Technical Trading Systems. Trend Research

Averaging Down Strategy1. Averaging Down:
Definition: "Averaging Down" is a strategy in which an investor buys more shares of a declining asset, thus lowering the average purchase price. The main idea is that, by averaging down, the investor can recover faster when the price eventually rebounds.
Risk Considerations: This strategy assumes that the asset will recover in value. If the price continues to decline, however, the investor may suffer larger losses. Academic research highlights the psychological bias of loss aversion that often leads investors to engage in averaging down, despite the increased risk (Barberis & Huang, 2001).
2. RSI (Relative Strength Index):
Definition: The RSI is a momentum oscillator that measures the speed and change of price movements. It ranges from 0 to 100 and is commonly used to identify overbought or oversold conditions. A reading below 30 (or in this case, 35) typically indicates an oversold condition, which might suggest a potential buying opportunity (Wilder, 1978).
Risk Considerations: RSI-based strategies can produce many false signals in range-bound or choppy markets, where prices do not exhibit strong trends. This can lead to multiple losing trades and an overall negative performance (Gencay, 1998).
3. Combination of RSI and Price Movement:
Approach: The combination of RSI for entry signals and price movement (previous day's high) for exit signals aims to capture short-term market reversals. This hybrid approach attempts to balance momentum with price confirmation.
Risk Considerations: While this combination can work well in trending markets, it may struggle in volatile or sideways markets. Additionally, a significant risk of averaging down is that the trader may continue adding to a losing position, which can exacerbate losses if the price keeps falling.
Risk Warnings:
Increased Losses Through Averaging Down:
Averaging down involves buying more of a falling asset, which can increase exposure to downside risk. Studies have shown that this approach can lead to larger losses when markets continue to decline, especially during prolonged bear markets (Statman, 2004).
A key risk is that this strategy may lead to significant capital drawdowns if the price of the asset does not recover as expected. In the worst-case scenario, this can result in a total loss of the invested capital.
False Signals with RSI:
RSI-based strategies are prone to generating false signals, particularly in markets that do not exhibit strong trends. For example, Gencay (1998) found that while RSI can be effective in certain conditions, it often fails in choppy or range-bound markets, leading to frequent stop-outs and drawdowns.
Psychological Bias:
Behavioral finance research suggests that the "Averaging Down" strategy may be influenced by loss aversion, a bias where investors prefer to avoid losses rather than achieve gains (Kahneman & Tversky, 1979). This can lead to poor decision-making, as investors continue to add to losing positions in the hope of a recovery.
Empirical Studies:
Gencay (1998): The study "The Predictability of Security Returns with Simple Technical Trading Rules" found that technical indicators like RSI can provide predictive value in certain markets, particularly in volatile environments. However, they are less reliable in markets that lack clear trends.
Barberis & Huang (2001): Their research on behavioral biases, including loss aversion, explains why investors are often tempted to average down despite the risks, as they attempt to avoid realizing losses.
Statman (2004): In "The Diversification Puzzle," Statman discusses how strategies like averaging down can increase risk exposure without necessarily improving long-term returns, especially if the underlying asset continues to perform poorly.
Conclusion:
The "Averaging Down Strategy with RSI" combines elements of technical analysis with a psychologically-driven averaging down approach. While the strategy may offer opportunities in trending or oversold markets, it carries significant risks, particularly in volatile or declining markets. Traders should be cautious when using this strategy, ensuring they manage risk effectively and avoid overexposure to a losing position.

Combo 2/20 EMA & CCI
This is another part of my research work, where I test a combination of two strategies, receiving a combined signal. In order to understand which indicator combinations work better, which work worse, as filters for trades. This is combo strategies for get a cumulative signal.
First strategy
This indicator plots 2/20 exponential moving average. For the Mov Avg X 2/20 Indicator, the EMA bar will be painted when the Alert criteria is met.
Second strategy
The Commodity Channel Index (CCI) is best used with markets that display cyclical or seasonal characteristics, and is formulated to detect the beginning and ending of the cycles by incorporating a moving average together with a divisor that reflects both possible and actual trading ranges. The final index measures the deviation from normal, which indicates major changes in market trend.
Strategy tester settings:
Initial capital: 1000
Order size: 0.5
Commission: 0.1%
Other as default.
Indicator settings:
EMA Length: 50
CCI Length: 10
Fast MA Length: 15
Slow MA Length: 20
Other as default.
WARNING:
- For purpose educate only
- This script to change bars colors.

RSI Trend Following StrategyOverview
The RSI Trend Following Strategy utilizes Relative Strength Index (RSI) to enter the trade for the potential trend continuation. It uses Stochastic indicator to check is the price is not in overbought territory and the MACD to measure the current price momentum. Moreover, it uses the 200-period EMA to filter the counter trend trades with the higher probability. The strategy opens only long trades.
Unique Features
Dynamic stop-loss system: Instead of fixed stop-loss level strategy utilizes average true range (ATR) multiplied by user given number subtracted from the position entry price as a dynamic stop loss level.
Configurable Trading Periods: Users can tailor the strategy to specific market windows, adapting to different market conditions.
Two layers trade filtering system: Strategy utilizes MACD and Stochastic indicators measure the current momentum and overbought condition and use 200-period EMA to filter trades against major trend.
Trailing take profit level: After reaching the trailing profit activation level script activates the trailing of long trade using EMA. More information in methodology.
Wide opportunities for strategy optimization: Flexible strategy settings allows users to optimize the strategy entries and exits for chosen trading pair and time frame.
Methodology
The strategy opens long trade when the following price met the conditions:
RSI is above 50 level.
MACD line shall be above the signal line
Both lines of Stochastic shall be not higher than 80 (overbought territory)
Candle’s low shall be above the 200 period EMA
When long trade is executed, strategy set the stop-loss level at the price ATR multiplied by user-given value below the entry price. This level is recalculated on every next candle close, adjusting to the current market volatility.
At the same time strategy set up the trailing stop validation level. When the price crosses the level equals entry price plus ATR multiplied by user-given value script starts to trail the price with trailing EMA(by default = 20 period). If price closes below EMA long trade is closed. When the trailing starts, script prints the label “Trailing Activated”.
Strategy settings
In the inputs window user can setup the following strategy settings:
ATR Stop Loss (by default = 1.75)
ATR Trailing Profit Activation Level (by default = 2.25)
MACD Fast Length (by default = 12, period of averaging fast MACD line)
MACD Fast Length (by default = 26, period of averaging slow MACD line)
MACD Signal Smoothing (by default = 9, period of smoothing MACD signal line)
Oscillator MA Type (by default = EMA, available options: SMA, EMA)
Signal Line MA Type (by default = EMA, available options: SMA, EMA)
RSI Length (by default = 14, period for RSI calculation)
Trailing EMA Length (by default = 20, period for EMA, which shall be broken close the trade after trailing profit activation)
Justification of Methodology
This trading strategy is designed to leverage a combination of technical indicators—Relative Strength Index (RSI), Moving Average Convergence Divergence (MACD), Stochastic Oscillator, and the 200-period Exponential Moving Average (EMA)—to determine optimal entry points for long trades. Additionally, the strategy uses the Average True Range (ATR) for dynamic risk management to adapt to varying market conditions. Let's look in details for which purpose each indicator is used for and why it is used in this combination.
Relative Strength Index (RSI) is a momentum indicator used in technical analysis to measure the speed and change of price movements in a financial market. It helps traders identify whether an asset is potentially overbought (overvalued) or oversold (undervalued), which can indicate a potential reversal or continuation of the current trend.
How RSI Works? RSI tracks the strength of recent price changes. It compares the average gains and losses over a specific period (usually 14 periods) to assess the momentum of an asset. Average gain is the average of all positive price changes over the chosen period. It reflects how much the price has typically increased during upward movements. Average loss is the average of all negative price changes over the same period. It reflects how much the price has typically decreased during downward movements.
RSI calculates these average gains and losses and compares them to create a value between 0 and 100. If the RSI value is above 70, the asset is generally considered overbought, meaning it might be due for a price correction or reversal downward. Conversely, if the RSI value is below 30, the asset is considered oversold, suggesting it could be poised for an upward reversal or recovery. RSI is a useful tool for traders to determine market conditions and make informed decisions about entering or exiting trades based on the perceived strength or weakness of an asset's price movements.
This strategy uses RSI as a short-term trend approximation. If RSI crosses over 50 it means that there is a high probability of short-term trend change from downtrend to uptrend. Therefore RSI above 50 is our first trend filter to look for a long position.
The MACD (Moving Average Convergence Divergence) is a popular momentum and trend-following indicator used in technical analysis. It helps traders identify changes in the strength, direction, momentum, and duration of a trend in an asset's price.
The MACD consists of three components:
MACD Line: This is the difference between a short-term Exponential Moving Average (EMA) and a long-term EMA, typically calculated as: MACD Line = 12 period EMA − 26 period EMA
Signal Line: This is a 9-period EMA of the MACD Line, which helps to identify buy or sell signals. When the MACD Line crosses above the Signal Line, it can be a bullish signal (suggesting a buy); when it crosses below, it can be a bearish signal (suggesting a sell).
Histogram: The histogram shows the difference between the MACD Line and the Signal Line, visually representing the momentum of the trend. Positive histogram values indicate increasing bullish momentum, while negative values indicate increasing bearish momentum.
This strategy uses MACD as a second short-term trend filter. When MACD line crossed over the signal line there is a high probability that uptrend has been started. Therefore MACD line above signal line is our additional short-term trend filter. In conjunction with RSI it decreases probability of following false trend change signals.
The Stochastic Indicator is a momentum oscillator that compares a security's closing price to its price range over a specific period. It's used to identify overbought and oversold conditions. The indicator ranges from 0 to 100, with readings above 80 indicating overbought conditions and readings below 20 indicating oversold conditions.
It consists of two lines:
%K: The main line, calculated using the formula (CurrentClose−LowestLow)/(HighestHigh−LowestLow)×100 . Highest and lowest price taken for 14 periods.
%D: A smoothed moving average of %K, often used as a signal line.
This strategy uses stochastic to define the overbought conditions. The logic here is the following: we want to avoid long trades in the overbought territory, because when indicator reaches it there is a high probability that the potential move is gonna be restricted.
The 200-period EMA is a widely recognized indicator for identifying the long-term trend direction. The strategy only trades in the direction of this primary trend to increase the probability of successful trades. For instance, when the price is above the 200 EMA, only long trades are considered, aligning with the overarching trend direction.
Therefore, strategy uses combination of RSI and MACD to increase the probability that price now is in short-term uptrend, Stochastic helps to avoid the trades in the overbought (>80) territory. To increase the probability of opening long trades in the direction of a main trend and avoid local bounces we use 200 period EMA.
ATR is used to adjust the strategy risk management to the current market volatility. If volatility is low, we don’t need the large stop loss to understand the there is a high probability that we made a mistake opening the trade. User can setup the settings ATR Stop Loss and ATR Trailing Profit Activation Level to realize his own risk to reward preferences, but the unique feature of a strategy is that after reaching trailing profit activation level strategy is trying to follow the trend until it is likely to be finished instead of using fixed risk management settings. It allows sometimes to be involved in the large movements.
Backtest Results
Operating window: Date range of backtests is 2023.01.01 - 2024.08.01. It is chosen to let the strategy to close all opened positions.
Commission and Slippage: Includes a standard Binance commission of 0.1% and accounts for possible slippage over 5 ticks.
Initial capital: 10000 USDT
Percent of capital used in every trade: 30%
Maximum Single Position Loss: -3.94%
Maximum Single Profit: +15.78%
Net Profit: +1359.21 USDT (+13.59%)
Total Trades: 111 (36.04% win rate)
Profit Factor: 1.413
Maximum Accumulated Loss: 625.02 USDT (-5.85%)
Average Profit per Trade: 12.25 USDT (+0.40%)
Average Trade Duration: 40 hours
These results are obtained with realistic parameters representing trading conditions observed at major exchanges such as Binance and with realistic trading portfolio usage parameters.
How to Use
Add the script to favorites for easy access.
Apply to the desired timeframe and chart (optimal performance observed on 2h BTC/USDT).
Configure settings using the dropdown choice list in the built-in menu.
Set up alerts to automate strategy positions through web hook with the text: {{strategy.order.alert_message}}
Disclaimer:
Educational and informational tool reflecting Skyrex commitment to informed trading. Past performance does not guarantee future results. Test strategies in a simulated environment before live implementation

Intramarket Difference Index StrategyHi Traders !!
The IDI Strategy:
In layman’s terms this strategy compares two indicators across markets and exploits their differences.
note: it is best the two markets are correlated as then we know we are trading a short to long term deviation from both markets' general trend with the assumption both markets will trend again sometime in the future thereby exhausting our trading opportunity.
📍 Import Notes:
This Strategy calculates trade position size independently (i.e. risk per trade is controlled in the user inputs tab), this means that the ‘Order size’ input in the ‘Properties’ tab will have no effect on the strategy. Why ? because this allows us to define custom position size algorithms which we can use to improve our risk management and equity growth over time. Here we have the option to have fixed quantity or fixed percentage of equity ATR (Average True Range) based stops in addition to the turtle trading position size algorithm.
‘Pyramiding’ does not work for this strategy’, similar to the order size input togeling this input will have no effect on the strategy as the strategy explicitly defines the maximum order size to be 1.
This strategy is not perfect, and as of writing of this post I have not traded this algo.
Always take your time to backtests and debug the strategy.
🔷 The IDI Strategy:
By default this strategy pulls data from your current TV chart and then compares it to the base market, be default BINANCE:BTCUSD . The strategy pulls SMA and RSI data from either market (we call this the difference data), standardizes the data (solving the different unit problem across markets) such that it is comparable and then differentiates the data, calling the result of this transformation and difference the Intramarket Difference (ID). The formula for the the ID is
ID = market1_diff_data - market2_diff_data (1)
Where
market(i)_diff_data = diff_data / ATR(j)_market(i)^0.5,
where i = {1, 2} and j = the natural numbers excluding 0
Formula (1) interpretation is the following
When ID > 0: this means the current market outperforms the base market
When ID = 0: Markets are at long run equilibrium
When ID < 0: this means the current market underperforms the base market
To form the strategy we define one of two strategy type’s which are Trend and Mean Revesion respectively.
🔸 Trend Case:
Given the ‘‘Strategy Type’’ is equal to TREND we define a threshold for which if the ID crosses over we go long and if the ID crosses under the negative of the threshold we go short.
The motivating idea is that the ID is an indicator of the two symbols being out of sync, and given we know volatility clustering, momentum and mean reversion of anomalies to be a stylised fact of financial data we can construct a trading premise. Let's first talk more about this premise.
For some markets (cryptocurrency markets - synthetic symbols in TV) the stylised fact of momentum is true, this means that higher momentum is followed by higher momentum, and given we know momentum to be a vector quantity (with magnitude and direction) this momentum can be both positive and negative i.e. when the ID crosses above some threshold we make an assumption it will continue in that direction for some time before executing back to its long run equilibrium of 0 which is a reasonable assumption to make if the market are correlated. For example for the BTCUSD - ETHUSD pair, if the ID > +threshold (inputs for MA and RSI based ID thresholds are found under the ‘‘INTRAMARKET DIFFERENCE INDEX’’ group’), ETHUSD outperforms BTCUSD, we assume the momentum to continue so we go long ETHUSD.
In the standard case we would exit the market when the IDI returns to its long run equilibrium of 0 (for the positive case the ID may return to 0 because ETH’s difference data may have decreased or BTC’s difference data may have increased). However in this strategy we will not define this as our exit condition, why ?
This is because we want to ‘‘let our winners run’’, to achieve this we define a trailing Donchian Channel stop loss (along with a fixed ATR based stop as our volatility proxy). If we were too use the 0 exit the strategy may print a buy signal (ID > +threshold in the simple case, market regimes may be used), return to 0 and then print another buy signal, and this process can loop may times, this high trade frequency means we fail capture the entire market move lowering our profit, furthermore on lower time frames this high trade frequencies mean we pay more transaction costs (due to price slippage, commission and big-ask spread) which means less profit.
By capturing the sum of many momentum moves we are essentially following the trend hence the trend following strategy type.
Here we also print the IDI (with default strategy settings with the MA difference type), we can see that by letting our winners run we may catch many valid momentum moves, that results in a larger final pnl that if we would otherwise exit based on the equilibrium condition(Valid trades are denoted by solid green and red arrows respectively and all other valid trades which occur within the original signal are light green and red small arrows).
another example...
Note: if you would like to plot the IDI separately copy and paste the following code in a new Pine Script indicator template.
indicator("IDI")
// INTRAMARKET INDEX
var string g_idi = "intramarket diffirence index"
ui_index_1 = input.symbol("BINANCE:BTCUSD", title = "Base market", group = g_idi)
// ui_index_2 = input.symbol("BINANCE:ETHUSD", title = "Quote Market", group = g_idi)
type = input.string("MA", title = "Differrencing Series", options = , group = g_idi)
ui_ma_lkb = input.int(24, title = "lookback of ma and volatility scaling constant", group = g_idi)
ui_rsi_lkb = input.int(14, title = "Lookback of RSI", group = g_idi)
ui_atr_lkb = input.int(300, title = "ATR lookback - Normalising value", group = g_idi)
ui_ma_threshold = input.float(5, title = "Threshold of Upward/Downward Trend (MA)", group = g_idi)
ui_rsi_threshold = input.float(20, title = "Threshold of Upward/Downward Trend (RSI)", group = g_idi)
//>>+----------------------------------------------------------------+}
// CUSTOM FUNCTIONS |
//<<+----------------------------------------------------------------+{
// construct UDT (User defined type) containing the IDI (Intramarket Difference Index) source values
// UDT will hold many variables / functions grouped under the UDT
type functions
float Close // close price
float ma // ma of symbol
float rsi // rsi of the asset
float atr // atr of the asset
// the security data
getUDTdata(symbol, malookback, rsilookback, atrlookback) =>
indexHighTF = barstate.isrealtime ? 1 : 0
= request.security(symbol, timeframe = timeframe.period,
expression = [close , // Instentiate UDT variables
ta.sma(close, malookback) ,
ta.rsi(close, rsilookback) ,
ta.atr(atrlookback) ])
data = functions.new(close_, ma_, rsi_, atr_)
data
// Intramerket Difference Index
idi(type, symbol1, malookback, rsilookback, atrlookback, mathreshold, rsithreshold) =>
threshold = float(na)
index1 = getUDTdata(symbol1, malookback, rsilookback, atrlookback)
index2 = getUDTdata(syminfo.tickerid, malookback, rsilookback, atrlookback)
// declare difference variables for both base and quote symbols, conditional on which difference type is selected
var diffindex1 = 0.0, var diffindex2 = 0.0,
// declare Intramarket Difference Index based on series type, note
// if > 0, index 2 outpreforms index 1, buy index 2 (momentum based) until equalibrium
// if < 0, index 2 underpreforms index 1, sell index 1 (momentum based) until equalibrium
// for idi to be valid both series must be stationary and normalised so both series hae he same scale
intramarket_difference = 0.0
if type == "MA"
threshold := mathreshold
diffindex1 := (index1.Close - index1.ma) / math.pow(index1.atr*malookback, 0.5)
diffindex2 := (index2.Close - index2.ma) / math.pow(index2.atr*malookback, 0.5)
intramarket_difference := diffindex2 - diffindex1
else if type == "RSI"
threshold := rsilookback
diffindex1 := index1.rsi
diffindex2 := index2.rsi
intramarket_difference := diffindex2 - diffindex1
//>>+----------------------------------------------------------------+}
// STRATEGY FUNCTIONS CALLS |
//<<+----------------------------------------------------------------+{
// plot the intramarket difference
= idi(type,
ui_index_1,
ui_ma_lkb,
ui_rsi_lkb,
ui_atr_lkb,
ui_ma_threshold,
ui_rsi_threshold)
//>>+----------------------------------------------------------------+}
plot(intramarket_difference, color = color.orange)
hline(type == "MA" ? ui_ma_threshold : ui_rsi_threshold, color = color.green)
hline(type == "MA" ? -ui_ma_threshold : -ui_rsi_threshold, color = color.red)
hline(0)
Note it is possible that after printing a buy the strategy then prints many sell signals before returning to a buy, which again has the same implication (less profit. Potentially because we exit early only for price to continue upwards hence missing the larger "trend"). The image below showcases this cenario and again, by allowing our winner to run we may capture more profit (theoretically).
This should be clear...
🔸 Mean Reversion Case:
We stated prior that mean reversion of anomalies is an standerdies fact of financial data, how can we exploit this ?
We exploit this by normalizing the ID by applying the Ehlers fisher transformation. The transformed data is then assumed to be approximately normally distributed. To form the strategy we employ the same logic as for the z score, if the FT normalized ID > 2.5 (< -2.5) we buy (short). Our exit conditions remain unchanged (fixed ATR stop and trailing Donchian Trailing stop)
🔷 Position Sizing:
If ‘‘Fixed Risk From Initial Balance’’ is toggled true this means we risk a fixed percentage of our initial balance, if false we risk a fixed percentage of our equity (current balance).
Note we also employ a volatility adjusted position sizing formula, the turtle training method which is defined as follows.
Turtle position size = (1/ r * ATR * DV) * C
Where,
r = risk factor coefficient (default is 20)
ATR(j) = risk proxy, over j times steps
DV = Dollar Volatility, where DV = (1/Asset Price) * Capital at Risk
🔷 Risk Management:
Correct money management means we can limit risk and increase reward (theoretically). Here we employ
Max loss and gain per day
Max loss per trade
Max number of consecutive losing trades until trade skip
To read more see the tooltips (info circle).
🔷 Take Profit:
By defualt the script uses a Donchain Channel as a trailing stop and take profit, In addition to this the script defines a fixed ATR stop losses (by defualt, this covers cases where the DC range may be to wide making a fixed ATR stop usefull), ATR take profits however are defined but optional.
ATR SL and TP defined for all trades
🔷 Hurst Regime (Regime Filter):
The Hurst Exponent (H) aims to segment the market into three different states, Trending (H > 0.5), Random Geometric Brownian Motion (H = 0.5) and Mean Reverting / Contrarian (H < 0.5). In my interpretation this can be used as a trend filter that eliminates market noise.
We utilize the trending and mean reverting based states, as extra conditions required for valid trades for both strategy types respectively, in the process increasing our trade entry quality.
🔷 Example model Architecture:
Here is an example of one configuration of this strategy, combining all aspects discussed in this post.
Future Updates
- Automation integration (next update)

Rsi Long-Term Strategy [15min]Hello, I would like to present to you The "RSI Long-Term Strategy" for 15min tf
The "RSI Long-Term Strategy " is designed for traders who prefer a combination of momentum and trend-following techniques. The strategy focuses on entering long positions during significant market corrections within an overall uptrend, confirmed by both RSI and volume. The use of long-term SMAs ensures that trades are made in line with the broader market trend. The stop-loss feature provides risk management by limiting losses on trades that do not perform as expected. This strategy is particularly well-suited for longer-term traders who monitor 15-minute charts but look for substantial trend reversals or continuations.
Indicators and Parameters:
Relative Strength Index (RSI):
- The RSI is calculated using a 10-period length. It measures the magnitude of recent price changes to evaluate overbought or oversold conditions. The script defines oversold conditions when the RSI is at or below 30 and overbought conditions when the RSI is at or above 70.
Volume Condition:
-The strategy incorporates a volume condition where the current volume must be greater than 2.5 times the 20-period moving average of volume. This is used to confirm the strength of the price movement.
Simple Moving Averages (SMA):
- The strategy uses two SMAs: SMA1 with a length of 250 periods and SMA2 with a length of 500 periods. These SMAs help identify long-term trends and generate signals based on their crossover.
Strategy Logic:
Entry Logic:
A long position is initiated when all the following conditions are met:
The RSI indicates an oversold condition (RSI ≤ 30).
SMA1 is above SMA2, indicating an uptrend.
The volume condition is satisfied, confirming the strength of the signal.
Exit Logic:
The strategy closes the long position when SMA1 crosses under SMA2, signaling a potential end of the uptrend (a "Death Cross").
Stop-Loss:
A stop-loss is set at 5% below the entry price to manage risk and limit potential losses.
Buy and sell signals are highlighted with circles below or above bars:
Green Circle : Buy signal when RSI is oversold, SMA1 > SMA2, and the volume condition is met.
Red Circle : Sell signal when RSI is overbought, SMA1 < SMA2, and the volume condition is met.
Black Cross: "Death Cross" when SMA1 crosses under SMA2, indicating a potential bearish signal.
to determine the level of stop loss and target point I used a piece of code by RafaelZioni, here is the script from which a piece of code was taken
I hope the strategy will be helpful, as always, best regards and safe trades
;)

Multi-Factor StrategyThis trading strategy combines multiple technical indicators to create a systematic approach for entering and exiting trades. The goal is to capture trends by aligning several key indicators to confirm the direction and strength of a potential trade. Below is a detailed description of how the strategy works:
Indicators Used
MACD (Moving Average Convergence Divergence):
MACD Line: The difference between the 12-period and 26-period Exponential Moving Averages (EMAs).
Signal Line: A 9-period EMA of the MACD line.
Usage: The strategy looks for crossovers between the MACD line and the Signal line as entry signals. A bullish crossover (MACD line crossing above the Signal line) indicates a potential upward movement, while a bearish crossover (MACD line crossing below the Signal line) signals a potential downward movement.
RSI (Relative Strength Index):
Usage: RSI is used to gauge the momentum of the price movement. The strategy uses specific thresholds: below 70 for long positions to avoid overbought conditions and above 30 for short positions to avoid oversold conditions.
ATR (Average True Range):
Usage: ATR measures market volatility and is used to set dynamic stop-loss and take-profit levels. A stop loss is set at 2 times the ATR, and a take profit at 3 times the ATR, ensuring that risk is managed relative to market conditions.
Simple Moving Averages (SMA):
50-day SMA: A short-term trend indicator.
200-day SMA: A long-term trend indicator.
Usage: The strategy uses the relationship between the 50-day and 200-day SMAs to determine the overall market trend. Long positions are taken when the price is above the 50-day SMA and the 50-day SMA is above the 200-day SMA, indicating an uptrend. Conversely, short positions are taken when the price is below the 50-day SMA and the 50-day SMA is below the 200-day SMA, indicating a downtrend.
Entry Conditions
Long Position:
-MACD Crossover: The MACD line crosses above the Signal line.
-RSI Confirmation: RSI is below 70, ensuring the asset is not overbought.
-SMA Confirmation: The price is above the 50-day SMA, and the 50-day SMA is above the 200-day SMA, indicating a strong uptrend.
Short Position:
MACD Crossunder: The MACD line crosses below the Signal line.
RSI Confirmation: RSI is above 30, ensuring the asset is not oversold.
SMA Confirmation: The price is below the 50-day SMA, and the 50-day SMA is below the 200-day SMA, indicating a strong downtrend.
Opposite conditions for shorts
Exit Strategy
Stop Loss: Set at 2 times the ATR from the entry price. This dynamically adjusts to market volatility, allowing for wider stops in volatile markets and tighter stops in calmer markets.
Take Profit: Set at 3 times the ATR from the entry price. This ensures a favorable risk-reward ratio of 1:1.5, aiming for higher rewards on successful trades.
Visualization
SMAs: The 50-day and 200-day SMAs are plotted on the chart to visualize the trend direction.
MACD Crossovers: Bullish and bearish MACD crossovers are highlighted on the chart to identify potential entry points.
Summary
This strategy is designed to align multiple indicators to increase the probability of successful trades by confirming trends and momentum before entering a position. It systematically manages risk with ATR-based stop loss and take profit levels, ensuring that trades are exited based on market conditions rather than arbitrary points. The combination of trend indicators (SMAs) with momentum and volatility indicators (MACD, RSI, ATR) creates a robust approach to trading in various market environments.

RSI Strategy with Adjustable RSI and Stop-LossThis trading strategy uses the Relative Strength Index (RSI) and a Stop-Loss mechanism to make trading decisions. Here’s a breakdown of how it works:
RSI Calculation:
The RSI is calculated based on the user-defined length (rsi_length). This is a momentum oscillator that measures the speed and change of price movements.
Buy Condition:
The strategy generates a buy signal when the RSI value is below a user-defined threshold (rsi_threshold). This condition indicates that the asset might be oversold and potentially due for a rebound.
Stop-Loss Mechanism:
Upon triggering a buy signal, the strategy calculates the Stop-Loss level. The Stop-Loss level is set to a percentage below the entry price, as specified by the user (stop_loss_percent). This level is used to limit potential losses if the price moves against the trade.
Sell Condition:
A sell signal is generated when the current closing price is higher than the highest high of the previous day. This condition suggests that the price has reached a new high, and the strategy decides to exit the trade.
Plotting:
The RSI values are plotted on the chart for visual reference. A horizontal line is drawn at the RSI threshold level to help visualize the oversold condition.
Summary
Buying Strategy: When RSI is below the specified threshold, indicating potential oversold conditions.
Stop-Loss: Set based on a percentage of the entry price to limit potential losses.
Selling Strategy: When the price surpasses the highest high of the previous day, signaling a potential exit point.
This strategy aims to capture potential rebounds from oversold conditions and manage risk using a Stop-Loss mechanism. As with any trading strategy, it’s essential to test and optimize it under various market conditions to ensure its effectiveness.
MACD with 1D Stochastic Confirmation Reversal StrategyOverview
The MACD with 1D Stochastic Confirmation Reversal Strategy utilizes MACD indicator in conjunction with 1 day timeframe Stochastic indicators to obtain the high probability short-term trend reversal signals. The main idea is to wait until MACD line crosses up it’s signal line, at the same time Stochastic indicator on 1D time frame shall show the uptrend (will be discussed in methodology) and not to be in the oversold territory. Strategy works on time frames from 30 min to 4 hours and opens only long trades.
Unique Features
Dynamic stop-loss system: Instead of fixed stop-loss level strategy utilizes average true range (ATR) multiplied by user given number subtracted from the position entry price as a dynamic stop loss level.
Configurable Trading Periods: Users can tailor the strategy to specific market windows, adapting to different market conditions.
Higher time frame confirmation: Strategy utilizes 1D Stochastic to establish the major trend and confirm the local reversals with the higher probability.
Trailing take profit level: After reaching the trailing profit activation level scrip activate the trailing of long trade using EMA. More information in methodology.
Methodology
The strategy opens long trade when the following price met the conditions:
MACD line of MACD indicator shall cross over the signal line of MACD indicator.
1D time frame Stochastic’s K line shall be above the D line.
1D time frame Stochastic’s K line value shall be below 80 (not overbought)
When long trade is executed, strategy set the stop-loss level at the price ATR multiplied by user-given value below the entry price. This level is recalculated on every next candle close, adjusting to the current market volatility.
At the same time strategy set up the trailing stop validation level. When the price crosses the level equals entry price plus ATR multiplied by user-given value script starts to trail the price with EMA. If price closes below EMA long trade is closed. When the trailing starts, script prints the label “Trailing Activated”.
Strategy settings
In the inputs window user can setup the following strategy settings:
ATR Stop Loss (by default = 3.25, value multiplied by ATR to be subtracted from position entry price to setup stop loss)
ATR Trailing Profit Activation Level (by default = 4.25, value multiplied by ATR to be added to position entry price to setup trailing profit activation level)
Trailing EMA Length (by default = 20, period for EMA, when price reached trailing profit activation level EMA will stop out of position if price closes below it)
User can choose the optimal parameters during backtesting on certain price chart, in our example we use default settings.
Justification of Methodology
This strategy leverages 2 time frames analysis to have the high probability reversal setups on lower time frame in the direction of the 1D time frame trend. That’s why it’s recommended to use this strategy on 30 min – 4 hours time frames.
To have an approximation of 1D time frame trend strategy utilizes classical Stochastic indicator. The Stochastic Indicator is a momentum oscillator that compares a security's closing price to its price range over a specific period. It's used to identify overbought and oversold conditions. The indicator ranges from 0 to 100, with readings above 80 indicating overbought conditions and readings below 20 indicating oversold conditions.
It consists of two lines:
%K: The main line, calculated using the formula (CurrentClose−LowestLow)/(HighestHigh−LowestLow)×100 . Highest and lowest price taken for 14 periods.
%D: A smoothed moving average of %K, often used as a signal line.
Strategy logic assumes that on 1D time frame it’s uptrend in %K line is above the %D line. Moreover, we can consider long trade only in %K line is below 80. It means that in overbought state the long trade will not be opened due to higher probability of pullback or even major trend reversal. If these conditions are met we are going to our working (lower) time frame.
On the chosen time frame, we remind you that for correct work of this strategy you shall use 30min – 4h time frames, MACD line shall cross over it’s signal line. The MACD (Moving Average Convergence Divergence) is a popular momentum and trend-following indicator used in technical analysis. It helps traders identify changes in the strength, direction, momentum, and duration of a trend in a stock's price.
The MACD consists of three components:
MACD Line: This is the difference between a short-term Exponential Moving Average (EMA) and a long-term EMA, typically calculated as: MACD Line=12-period EMA−26-period
Signal Line: This is a 9-period EMA of the MACD Line, which helps to identify buy or sell signals. When the MACD Line crosses above the Signal Line, it can be a bullish signal (suggesting a buy); when it crosses below, it can be a bearish signal (suggesting a sell).
Histogram: The histogram shows the difference between the MACD Line and the Signal Line, visually representing the momentum of the trend. Positive histogram values indicate increasing bullish momentum, while negative values indicate increasing bearish momentum.
In our script we are interested in only MACD and signal lines. When MACD line crosses signal line there is a high chance that short-term trend reversed to the upside. We use this strategy on 45 min time frame.
ATR is used to adjust the strategy risk management to the current market volatility. If volatility is low, we don’t need the large stop loss to understand the there is a high probability that we made a mistake opening the trade. User can setup the settings ATR Stop Loss and ATR Trailing Profit Activation Level to realize his own risk to reward preferences, but the unique feature of a strategy is that after reaching trailing profit activation level strategy is trying to follow the trend until it is likely to be finished instead of using fixed risk management settings. It allows sometimes to be involved in the large movements.
Backtest Results
Operating window: Date range of backtests is 2023.01.01 - 2024.08.01. It is chosen to let the strategy to close all opened positions.
Commission and Slippage: Includes a standard Binance commission of 0.1% and accounts for possible slippage over 5 ticks.
Initial capital: 10000 USDT
Percent of capital used in every trade: 30%
Maximum Single Position Loss: -4.79%
Maximum Single Profit: +20.14%
Net Profit: +2361.33 USDT (+44.72%)
Total Trades: 123 (44.72% win rate)
Profit Factor: 1.623
Maximum Accumulated Loss: 695.80 USDT (-5.48%)
Average Profit per Trade: 19.20 USDT (+0.59%)
Average Trade Duration: 30 hours
These results are obtained with realistic parameters representing trading conditions observed at major exchanges such as Binance and with realistic trading portfolio usage parameters.
How to Use
Add the script to favorites for easy access.
Apply to the desired timeframe between 30 min and 4 hours and chart (optimal performance observed on 45 min BTC/USDT).
Configure settings using the dropdown choice list in the built-in menu.
Set up alerts to automate strategy positions through web hook with the text: {{strategy.order.alert_message}}
Disclaimer:
Educational and informational tool reflecting Skyrex commitment to informed trading. Past performance does not guarantee future results. Test strategies in a simulated environment before live implementation

Chandelier Exit Strategy with 200 EMA FilterStrategy Name and Purpose
Chandelier Exit Strategy with 200EMA Filter
This strategy uses the Chandelier Exit indicator in combination with a 200-period Exponential Moving Average (EMA) to generate trend-based trading signals. The main purpose of this strategy is to help traders identify high-probability entry points by leveraging the Chandelier Exit for stop loss levels and the EMA for trend confirmation. This strategy aims to provide clear rules for entries and exits, improving overall trading discipline and performance.
Originality and Usefulness
This script integrates two powerful indicators to create a cohesive and effective trading strategy:
Chandelier Exit : This indicator is based on the Average True Range (ATR) and identifies potential stop loss levels. The Chandelier Exit helps manage risk by setting stop loss levels at a distance from the highest high or lowest low over a specified period, multiplied by the ATR. This ensures that the stop loss adapts to market volatility.
200-period Exponential Moving Average (EMA) : The EMA acts as a trend filter. By ensuring trades are only taken in the direction of the overall trend, the strategy improves the probability of success. For long entries, the close price must be above the 200 EMA, indicating a bullish trend. For short entries, the close price must be below the 200 EMA, indicating a bearish trend.
Combining these indicators adds layers of confirmation and risk management, enhancing the strategy's effectiveness. The Chandelier Exit provides dynamic stop loss levels based on market volatility, while the EMA ensures trades align with the prevailing trend.
Entry Conditions
Long Entry
A buy signal is generated by the Chandelier Exit.
The close price is above the 200 EMA, indicating a strong bullish trend.
Short Entry
A sell signal is generated by the Chandelier Exit.
The close price is below the 200 EMA, indicating a strong bearish trend.
Exit Conditions
For long positions: The position is closed when a sell signal is generated by the Chandelier Exit.
For short positions: The position is closed when a buy signal is generated by the Chandelier Exit.
Risk Management
Account Size: 1,000,00 yen
Commission and Slippage: 17 pips commission and 1 pip slippage per trade
Risk per Trade: 10% of account equity
Stop Loss: For long trades, the stop loss is placed slightly below the candle that generated the buy signal. For short trades, the stop loss is placed slightly above the candle that generated the sell signal. The stop loss levels are dynamically adjusted based on the ATR.
Settings Options
ATR Period: Set the period for calculating the ATR to determine the Chandelier Exit levels.
ATR Multiplier: Set the multiplier for ATR to define the distance of stop loss levels from the highest high or lowest low.
Use Close Price for Extremums: Choose whether to use the close price for calculating the extremums.
EMA Period: Set the period for the EMA to adjust the trend filter sensitivity.
Show Buy/Sell Labels: Choose whether to display buy and sell labels on the chart for visual confirmation.
Highlight State: Choose whether to highlight the bullish or bearish state on the chart.
Sufficient Sample Size
The strategy has been backtested with a sufficient sample size to evaluate its performance accurately. This ensures that the strategy's results are statistically significant and reliable.
Notes
This strategy is based on historical data and does not guarantee future results.
Thoroughly backtest and validate results before using in live trading.
Market volatility and other external factors can affect performance and may not yield expected results.
Acknowledgment
This strategy uses the Chandelier Exit indicator. Special thanks to the original contributors for their work on the Chandelier Exit concept.
Clean Chart Explanation
The script is published with a clean chart to ensure that its output is readily identifiable and easy to understand. No other scripts are included on the chart, and any drawings or images used are specifically to illustrate how the script works.

Strategy SEMA SDI WebhookPurpose of the Code:
The strategy utilizes Exponential Moving Averages (EMA) and Smoothed Directional Indicators (SDI) to generate buy and sell signals. It includes features like leverage, take profit, stop loss, and trailing stops. The strategy is intended for backtesting and automating trades based on the specified indicators and conditions.
Key Components and Functionalities:
1.Strategy Settings:
Overlay: The strategy will overlay on the price chart.
Slippage: Set to 1.
Commission Value: Set to 0.035.
Default Quantity Type: Percent of equity.
Default Quantity Value: 50% of equity.
Initial Capital: Set to 1000 units.
Calculation on Order Fills: Enabled.
Process Orders on Close: Enabled.
2.Date and Time Filters:
Inputs for enabling/disabling start and end dates.
Filters to execute strategy only within specified date range.
3.Leverage and Quantity:
Leverage: Adjustable leverage input (default 3).
USD Percentage: Adjustable percentage of equity to use for trades (default 50%).
Initial Capital: Calculated based on leverage and percentage of equity.
4.Take Profit, Stop Loss, and Trailing Stop:
Inputs for enabling/disabling take profit, stop loss, and trailing stop.
Adjustable parameters for take profit percentage (default 25%), stop loss percentage (default 4.8%), and trailing stop percentage (default 1.9%).
Calculations for take profit, stop loss, trailing price, and maximum profit tracking.
5.EMA Calculations:
Fast and slow EMAs.
Smoothed versions of the fast and slow EMAs.
6.SDI Calculations:
Directional movement calculation for positive and negative directional indicators.
Difference between the positive and negative directional indicators, smoothed.
7.Buy/Sell Conditions:
Long (Buy) Condition: Positive DI is greater than negative DI, and fast EMA is greater than slow EMA.
Short (Sell) Condition: Negative DI is greater than positive DI, and fast EMA is less than slow EMA.
8.Strategy Execution:
If buy conditions are met, close any short positions and enter a long position.
If sell conditions are met, close any long positions and enter a short position.
Exit conditions for long and short positions based on take profit, stop loss, and trailing stop levels.
Close all positions if outside the specified date range.
Usage:
This strategy is used to automate trading based on the specified conditions involving EMAs and SDI. It allows backtesting to evaluate performance based on historical data. The strategy includes risk management through take profit, stop loss, and trailing stops to protect gains and limit losses. Traders can customize the parameters to fit their specific trading preferences and risk tolerance. Differently, it can perform leverage analysis and use it as a template.
By using this strategy, traders can systematically execute trades based on technical indicators, helping to remove emotional bias and improve consistency in trading decisions.
Important Note:
This script is provided for educational and template purposes and does not constitute financial advice. Traders and investors should conduct their research and analysis before making any trading decisions.

TSI w SuperTrend decision - Strategy [presentTrading]This strategy aims to improve upon the performance of Traidngview's newly published "Trend Strength Index" indicator by incorporating the SuperTrend for better trade execution and risk management. Enjoy :)
█ Introduction and How it is Different
The "TSI with SuperTrend Decision - Strategy" combines the Trend Strength Index (TSI) with SuperTrend indicators to determine entry and exit points. Unlike traditional strategies that rely solely on one indicator, this method leverages the strengths of both TSI and SuperTrend to provide a more nuanced and adaptive trading strategy.
This dual approach allows for capturing trends more effectively, especially in volatile markets.
BTCUSD 8h LS Performance
█ Strategy, How it Works: Detailed Explanation
🔶 Trend Strength Index (TSI)
The TSI is a momentum oscillator that shows both the direction and strength of a trend. It is calculated by comparing the price movement with the bar index over a specified period. The formula for TSI is as follows:
```
TSI = (PC / |PC|)
where:
PC = Change in price over the period
```
In this strategy, TSI is calculated using the closing prices and a default period of 64 bars. The TSI values help identify overbought and oversold conditions, providing signals for potential market reversals.
🔶 SuperTrend Indicator
The SuperTrend is a trend-following indicator based on the average true range (ATR). It helps in identifying the direction of the market trend. The SuperTrend calculation involves:
```
SuperTrend = HLC3 ± (Factor * ATR)
where:
HLC3 = (High + Low + Close) / 3
Factor = User-defined multiplier
ATR = Average True Range over a period
```
The SuperTrend settings in this strategy include a length of 10 bars and a factor of 3.0.
Last Bull Cycle of BTC
🔶 Entry and Exit Conditions
The strategy uses the TSI and SuperTrend together to determine entry and exit points:
- Long Entry: When the SuperTrend indicates a downward trend (st.d < 0) and the TSI is above the oversold level (-0.241).
- Long Exit: When the SuperTrend indicates an upward trend (st.d > 0) and the TSI is below the overbought level (0.241).
- Short Entry: When the SuperTrend indicates an upward trend (st.d > 0) and the TSI is below the overbought level (0.241).
- Short Exit: When the SuperTrend indicates a downward trend (st.d < 0) and the TSI is above the oversold level (-0.241).
█ Trade Direction
The strategy allows users to select the trade direction through the `tradeDirection` input. The options are:
- Both: Enables both long and short trades.
- Long: Enables only long trades.
- Short: Enables only short trades.
█ Default Settings
- TSI Length: 64
- SuperTrend Length: 10
- SuperTrend Factor: 3.0
- Trade Direction: Both
- Take Profit (%): 30.0
- Stop Loss (%): 20.0
Impact of Default Settings
- TSI Length: A longer TSI period smooths out noise but may lag in identifying trends. A shorter period is more responsive but can generate false signals.
- SuperTrend Length: A shorter length provides quicker signals but can be prone to whipsaws. A longer length is more reliable but may delay entries and exits.
- SuperTrend Factor: A higher factor increases the distance of the SuperTrend from the price, reducing sensitivity to minor price fluctuations.
- Trade Direction: Allows flexibility in trading strategies by enabling both long and short trades based on market conditions.
- Take Profit and Stop Loss: These settings manage risk by automatically closing trades at predefined profit or loss levels. Higher percentages provide larger potential gains but also higher risk.

HMA Crossover 1H with RSI, Stochastic RSI, and Trailing StopThe strategy script provided is a trading algorithm designed to help traders make informed buy and sell decisions based on certain technical indicators. Here’s a breakdown of what each part of the script does and how the strategy works:
Key Components:
Hull Moving Averages (HMA):
HMA 5: This is a Hull Moving Average calculated over 5 periods. HMAs are used to smooth out price data and identify trends more quickly than traditional moving averages.
HMA 20: This is another HMA but calculated over 20 periods, providing a broader view of the trend.
Relative Strength Index (RSI):
RSI 14: This is a momentum oscillator that measures the speed and change of price movements over a 14-period timeframe. It helps identify overbought or oversold conditions in the market.
Stochastic RSI:
%K: This is the main line of the Stochastic RSI, which combines the RSI and the Stochastic Oscillator to provide a more sensitive measure of overbought and oversold conditions. It is smoothed with a 3-period simple moving average.
Trading Signals:
Buy Signal:
Generated when the 5-period HMA crosses above the 20-period HMA, indicating a potential upward trend.
Additionally, the RSI must be below 45, suggesting that the market is not overbought.
The Stochastic RSI %K must also be below 39, confirming the oversold condition.
Sell Signal:
Generated when the 5-period HMA crosses below the 20-period HMA, indicating a potential downward trend.
The RSI must be above 60, suggesting that the market is not oversold.
The Stochastic RSI %K must also be above 63, confirming the overbought condition.
Trailing Stop Loss:
This feature helps protect profits by automatically selling the position if the price moves against the trade by 5%.
For sell positions, an additional trailing stop of 100 points is included.

Advanced Gold Scalping Strategy with RSI Divergence# Advanced Gold Scalping Strategy with RSI Divergence
## Overview
This Pine Script implements an advanced scalping strategy for gold (XAUUSD) trading, primarily designed for the 1-minute timeframe. The strategy utilizes the Relative Strength Index (RSI) indicator along with its moving average to identify potential trade setups based on divergences between price action and RSI movements.
## Key Components
### 1. RSI Calculation
- Uses a customizable RSI length (default: 60)
- Allows selection of the source for RSI calculation (default: close price)
### 2. Moving Average of RSI
- Supports multiple MA types: SMA, EMA, SMMA (RMA), WMA, VWMA, and Bollinger Bands
- Customizable MA length (default: 3)
- Option to display Bollinger Bands with adjustable standard deviation multiplier
### 3. Divergence Detection
- Implements both bullish and bearish divergence identification
- Uses pivot high and pivot low points to detect divergences
- Allows for customization of lookback periods and range for divergence detection
### 4. Entry Conditions
- Long Entry: Bullish divergence when RSI is below 40
- Short Entry: Bearish divergence when RSI is above 60
### 5. Trade Management
- Stop Loss: Customizable, default set to 11 pips
- Take Profit: Customizable, default set to 33 pips
### 6. Visualization
- Plots RSI line and its moving average
- Displays horizontal lines at 30, 50, and 70 RSI levels
- Shows Bollinger Bands when selected
- Highlights divergences with "Bull" and "Bear" labels on the chart
## Input Parameters
- RSI Length: Adjusts the period for RSI calculation
- RSI Source: Selects the price source for RSI (close, open, high, low, hl2, hlc3, ohlc4)
- MA Type: Chooses the type of moving average applied to RSI
- MA Length: Sets the period for the moving average
- BB StdDev: Adjusts the standard deviation multiplier for Bollinger Bands
- Show Divergence: Toggles the display of divergence labels
- Stop Loss: Sets the stop loss distance in pips
- Take Profit: Sets the take profit distance in pips
## Strategy Logic
1. **RSI Calculation**:
- Computes RSI using the specified length and source
- Calculates the chosen type of moving average on the RSI
2. **Divergence Detection**:
- Identifies pivot points in both price and RSI
- Checks for higher lows in RSI with lower lows in price (bullish divergence)
- Checks for lower highs in RSI with higher highs in price (bearish divergence)
3. **Trade Entry**:
- Enters a long position when a bullish divergence is detected and RSI is below 40
- Enters a short position when a bearish divergence is detected and RSI is above 60
4. **Position Management**:
- Places a stop loss order at the entry price ± stop loss pips (depending on the direction)
- Sets a take profit order at the entry price ± take profit pips (depending on the direction)
5. **Visualization**:
- Plots the RSI and its moving average
- Draws horizontal lines for overbought/oversold levels
- Displays Bollinger Bands if selected
- Shows divergence labels on the chart for identified setups
## Usage Instructions
1. Apply the script to a 1-minute XAUUSD (Gold) chart in TradingView
2. Adjust the input parameters as needed:
- Increase RSI Length for less frequent but potentially more reliable signals
- Modify MA Type and Length to change the sensitivity of the RSI moving average
- Adjust Stop Loss and Take Profit levels based on current market volatility
3. Monitor the chart for Bull (long) and Bear (short) labels indicating potential trade setups
4. Use in conjunction with other analysis and risk management techniques
## Considerations
- This strategy is designed for short-term scalping and may not be suitable for all market conditions
- Always backtest and forward test the strategy before using it with real capital
- The effectiveness of divergence-based strategies can vary depending on market trends and volatility
- Consider using additional confirmation signals or filters to improve the strategy's performance
Remember to adapt the strategy parameters to your risk tolerance and trading style, and always practice proper risk management.

Chande Momentum Oscillator (CMO) Buy Sell Strategy [TradeDots]The "Chande Momentum Oscillator (CMO) Buy Sell Strategy" leverages the CMO indicator to identify short-term buy and sell opportunities.
HOW DOES IT WORK
The standard CMO indicator measures the difference between recent gains and losses, divided by the total price movement over the same period. However, this version of the CMO has some limitations.
The primary disadvantage of the original CMO is its responsiveness to short-term volatility, making the signals less smooth and more erratic, especially in fluctuating markets. This instability can lead to misleading buy or sell signals.
To address this, we integrated the concept from the Moving Average Convergence Divergence (MACD) indicator. By applying a 9-period exponential moving average (EMA) to the CMO line, we obtained a smoothed signal line. This line acts as a filter, identifying confirmed overbought or oversold states, thereby reducing the number of false signals.
Similar to the MACD histogram, we generate columns representing the difference between the CMO and its signal line, reflecting market momentum. We use this momentum indicator as a criterion for entry and exit points. Trades are executed when there's a convergence of CMO and signal lines during an oversold state, and they are closed when the CMO line diverges from the signal line, indicating increased selling pressure.
APPLICATION
Since the 9-period EMA smooths the CMO line, it's less susceptible to extreme price fluctuations. However, this smoothing also makes it more challenging to breach the original +50 and -50 benchmarks.
To increase trading opportunities, we've tightened the boundary ranges. Users can customize the target benchmark lines in the settings to adjust for the volatility of the underlying asset.
The 'cool down period' is essentially the number of bars that await before the next signal generation. This feature is employed to dodge the occurrence of multiple signals in a short period.
DEFAULT SETUP
Commission: 0.01%
Initial Capital: $10,000
Equity per Trade: 80%
Signal Cool Down Period: 5
RISK DISCLAIMER
Trading entails substantial risk, and most day traders incur losses. All content, tools, scripts, articles, and education provided by TradeDots serve purely informational and educational purposes. Past performances are not definitive predictors of future results.

Custom Signal Oscillator StrategyThe CSO is made to help traders easily test their theories by subtracting the difference between two customizable plots(indicators) without having to search for strategies. The general purpose is to provide a tool to users without coding knowledge.
How to use :
Apply the indicator(s) to test
Go to the CSO strategy input settings and select the desired plots from the added indicators. (The back test will enter long or short depending on the fast signal crosses on the slow signal)
Pull up the strategy tester
Adjust the input settings on the selected indicator(s) to back test
For example, the published strategy is using the basis lines from two Donchian channels with varying length. This can be utilized with multiple overlays on the chart and oscillators that are operating on the same scale with each other. Since chart glows aren't extremely common, a glow option is included to stand out on the chart as the chain operator. A long only option for is also included for versatility.