ChasinAlts_LibraryLibrary "ChasinAlts_Library"
rci(_BCgtg, _Tgtg, _close, _smaLen, _bar_index)
Parameters:
_BCgtg
_Tgtg
_close
_smaLen
_bar_index
printedBC(_time, _minPerc, _Tgtg, _lkbk)
Parameters:
_time
_minPerc
_Tgtg
_lkbk
form123(_ppLen, _BCgtg, _Tgtg, _high, _low, _close, _bar_index)
Parameters:
_ppLen
_BCgtg
_Tgtg
_high
_low
_close
_bar_index
obosCnt(_BCgtg, _Tgtg, _rci, _obosMin, _obosMax, _thresh)
Parameters:
_BCgtg
_Tgtg
_rci
_obosMin
_obosMax
_thresh
div(_thresh, _HLestLen, _Tgtg, _BCgtg, _rci, _time, _price, _LSL, _SSL, _LTP, _STP, _colorid, _long, _short)
Parameters:
_thresh
_HLestLen
_Tgtg
_BCgtg
_rci
_time
_price
_LSL
_SSL
_LTP
_STP
_colorid
_long
_short
tradeSim(_SL, _TP, _BCgtg, _Tgtg, _ppLen, _high, _low, _close, _bar_index, _time, _bull_rev, _bear_rev, _bull_obosCnt_gtg, _bear_obosCnt_gtg)
Parameters:
_SL
_TP
_BCgtg
_Tgtg
_ppLen
_high
_low
_close
_bar_index
_time
_bull_rev
_bear_rev
_bull_obosCnt_gtg
_bear_obosCnt_gtg
指標和策略
TrailingStopsLibrary "TrailingStops"
This library contains functions to output trailing stop lines.
f_marketStructureStop(_restartMode, _flipMode, _restartLowIn, _restartHighIn)
Parameters:
_restartMode - Defines how the stop lines persist. Allowed values are:
"Always On" - The stop lines are always present and they just reset when they're crossed.
"Flip" - The stop lines flip when they're crossed.
"Manual" - The stop lines turn off when they're crossed, and turn back on again when _restartLowIn or _restartHighIn are passed into the function as true.
_flipMode - Defines whether the stop lines are broken by wicks or closes. Allowed values are "Wick", and "Close".
_restartLowIn - If _restartMode is "Manual", passing this parameter as true restarts the Low stop line.
_restartHighIn - If _restartMode is "Manual", passing this parameter as true restarts the High stop line.
@returns - floats for the Low and High stop line.

SignalBuilderSignalBuilder
Utility for building a collection of signal values. Provides a default view for displaying signals.
Simplified API for aggregating signal values.
Flexible for use with indicators and strategies.
See the demo section for an example.

MarketStructureLibrary "MarketStructure"
This library contains functions for identifying Lows and Highs in a rule-based way, and deriving useful information from them.
f_simpleLowHigh()
This function finds Local Lows and Highs, but NOT in order. A Local High is any candle that has its Low taken out on close by a subsequent candle (and vice-versa for Local Lows).
The Local High does NOT have to be the candle with the highest High out of recent candles. It does NOT have to be a Williams High. It is not necessarily a swing high or a reversal or anything else.
It doesn't have to be "the" high, so don't be confused.
By the rules, Local Lows and Highs must alternate. In this function they do not, so I'm calling them Simple Lows and Highs.
Simple Highs and Lows, by the above definition, can be useful for entries and stops. Because I intend to use them for stops, I want them all, not just the ones that alternate in strict order.
@param - there are no parameters. The function uses the chart OHLC.
@returns boolean values for whether this bar confirms a Simple Low/High, and ints for the bar_index of that Low/High.
f_localLowHigh()
This function finds Local Lows and Highs, in order. A Local High is any candle that has its Low taken out on close by a subsequent candle (and vice-versa for Local Lows).
The Local High does NOT have to be the candle with the highest High out of recent candles. It does NOT have to be a Williams High. It is not necessarily a swing high or a reversal or anything else.
By the rules, Local Lows and Highs must alternate, and in this function they do.
@param - there are no parameters. The function uses the chart OHLC.
@returns boolean values for whether this bar confirms a Local Low/High, and ints for the bar_index of that Low/High.
f_enhancedSimpleLowHigh()
This function finds Local Lows and Highs, but NOT in order. A Local High is any candle that has its Low taken out on close by a subsequent candle (and vice-versa for Local Lows).
The Local High does NOT have to be the candle with the highest High out of recent candles. It does NOT have to be a Williams High. It is not necessarily a swing high or a reversal or anything else.
By the rules, Local Lows and Highs must alternate. In this function they do not, so I'm calling them Simple Lows and Highs.
Simple Highs and Lows, by the above definition, can be useful for entries and stops. Because I intend to use them for trailing stops, I want them all, not just the ones that alternate in strict order.
The difference between this function and f_simpleLowHigh() is that it also tracks the lowest/highest recent level. This level can be useful for trailing stops.
In effect, these are like more "normal" highs and lows that you would pick by eye, but confirmed faster in many cases than by waiting for the low/high of that particular candle to be taken out on close,
because they are instead confirmed by ANY subsequent candle having its low/high exceeded. Hence, I call these Enhanced Simple Lows/Highs.
The levels are taken from the extreme highs/lows, but the bar indexes are given for the candles that were actually used to confirm the Low/High.
This is by design, because it might be misleading to label the extreme, since we didn't use that candle to confirm the Low/High..
@param - there are no parameters. The function uses the chart OHLC.
@returns - boolean values for whether this bar confirms an Enhanced Simple Low/High
ints for the bar_index of that Low/High
floats for the values of the recent high/low levels
floats for the trailing high/low levels (for debug/post-processing)
bools for market structure bias
f_trueLowHigh()
This function finds True Lows and Highs.
A True High is the candle with the highest recent high, which then has its low taken out on close by a subsequent candle (and vice-versa for True Lows).
The difference between this and an Enhanced High is that confirmation requires not just any Simple High, but confirmation of the very candle that has the highest high.
Because of this, confirmation is often later, and multiple Simple Highs and Lows can develop within ranges formed by a single big candle without any of them being confirmed. This is by design.
A True High looks like the intuitive "real high" when you look at the chart. True Lows and Highs must alternate.
@param - there are no parameters. The function uses the chart OHLC.
@returns - boolean values for whether this bar confirms an Enhanced Simple Low/High
ints for the bar_index of that Low/High
floats for the values of the recent high/low levels
floats for the trailing high/low levels (for debug/post-processing)
bools for market structure bias

TechnicalRating█ OVERVIEW
This library is a Pine Script™ programmer’s tool for incorporating TradingView's well-known technical ratings within their scripts. The ratings produced by this library are the same as those from the speedometers in the technical analysis summary and the "Rating" indicator in the Screener , which use the aggregate biases of 26 technical indicators to calculate their results.
█ CONCEPTS
Ensemble analysis
Ensemble analysis uses multiple weaker models to produce a potentially stronger one. A common form of ensemble analysis in technical analysis is the usage of aggregate indicators together in hopes of gaining further market insight and reinforcing trading decisions.
Technical ratings
Technical ratings provide a simplified way to analyze financial markets by combining signals from an ensemble of indicators into a singular value, allowing traders to assess market sentiment more quickly and conveniently than analyzing each constituent separately. By consolidating the signals from multiple indicators into a single rating, traders can more intuitively and easily interpret the "technical health" of the market.
Calculating the rating value
Using a variety of built-in TA functions and functions from our ta library, this script calculates technical ratings for moving averages, oscillators, and their overall result within the `calcRatingAll()` function.
The function uses the script's `calcRatingMA()` function to calculate the moving average technical rating from an ensemble of 15 moving averages and filters:
• Six Simple Moving Averages and six Exponential Moving Averages with periods of 10, 20, 30, 50, 100, and 200
• A Hull Moving Average with a period of 9
• A Volume-Weighted Moving Average with a period of 20
• An Ichimoku Cloud with a conversion line length of 9, base length of 26, and leading span B length of 52
The function uses the script's `calcRating()` function to calculate the oscillator technical rating from an ensemble of 11 oscillators:
• RSI with a period of 14
• Stochastic with a %K period of 14, a smoothing period of 3, and a %D period of 3
• CCI with a period of 20
• ADX with a DI length of 14 and an ADX smoothing period of 14
• Awesome Oscillator
• Momentum with a period of 10
• MACD with fast, slow, and signal periods of 12, 26, and 9
• Stochastic RSI with an RSI period of 14, a %K period of 14, a smoothing period of 3, and a %D period of 3
• Williams %R with a period of 14
• Bull Bear Power with a period of 50
• Ultimate Oscillator with fast, middle, and slow lengths of 7, 14, and 28
Each indicator is assigned a value of +1, 0, or -1, representing a bullish, neutral, or bearish rating. The moving average rating is the mean of all ratings that use the `calcRatingMA()` function, and the oscillator rating is the mean of all ratings that use the `calcRating()` function. The overall rating is the mean of the moving average and oscillator ratings, which ranges between +1 and -1. This overall rating, along with the separate MA and oscillator ratings, can be used to gain insight into the technical strength of the market. For a more detailed breakdown of the signals and conditions used to calculate the indicators' ratings, consult our Help Center explanation.
Determining rating status
The `ratingStatus()` function produces a string representing the status of a series of ratings. The `strongBound` and `weakBound` parameters, with respective default values of 0.5 and 0.1, define the bounds for "strong" and "weak" ratings.
The rating status is determined as follows:
Rating Value Rating Status
< -strongBound Strong Sell
< -weakBound Sell
-weakBound to weakBound Neutral
> weakBound Buy
> strongBound Strong Buy
By customizing the `strongBound` and `weakBound` values, traders can tailor the `ratingStatus()` function to fit their trading style or strategy, leading to a more personalized approach to evaluating ratings.
Look first. Then leap.
█ FUNCTIONS
This library contains the following functions:
calcRatingAll()
Calculates 3 ratings (ratings total, MA ratings, indicator ratings) using the aggregate biases of 26 different technical indicators.
Returns: A 3-element tuple: ( [(float) ratingTotal, (float) ratingOther, (float) ratingMA ].
countRising(plot)
Calculates the number of times the values in the given series increase in value up to a maximum count of 5.
Parameters:
plot : (series float) The series of values to check for rising values.
Returns: (int) The number of times the values in the series increased in value.
ratingStatus(ratingValue, strongBound, weakBound)
Determines the rating status of a given series based on its values and defined bounds.
Parameters:
ratingValue : (series float) The series of values to determine the rating status for.
strongBound : (series float) The upper bound for a "strong" rating.
weakBound : (series float) The upper bound for a "weak" rating.
Returns: (string) The rating status of the given series ("Strong Buy", "Buy", "Neutral", "Sell", or "Strong Sell").

TurntLibraryLibrary "TurntLibrary"
Collection of functions created for simplification/easy referencing. Includes variations of moving averages, length value oscillators, and a few other simple functions based upon HH/LL values.
ma(source, length, type)
Apply a moving average to a float value
Parameters:
source : Value to be used
length : Number of bars to include in calculation
type : Moving average type to use ("SMA","EMA","RMA","WMA","VWAP","SWMA","LRC")
Returns: Smoothed value of initial float value
curve(src, len, lb1, lb2)
Exaggerates curves of a float value designed for use as an exit signal.
Parameters:
src : Initial value to curve
len : Number of bars to include in calculation
lb1 : (Default = 1) First lookback length
lb2 : (Default = 2) Second lookback length
Returns: Curved Average
fragma(src, len, space, str)
Average of a moving average and the previous value of the moving average
Parameters:
src : Initial float value to use
len : Number of bars to include in calculation
space : Lookback integer for second half of average
str : Moving average type to use ("SMA","EMA","RMA","WMA","VWAP","SWMA","LRC")
Returns: Fragmented Average
maxmin(x, y)
Difference of 2 float values, subtracting the lowest from the highest
Parameters:
x : Value 1
y : Value 2
Returns: The +Difference between 2 float values
oscLen(val, type)
Variable Length using a oscillator value and a corresponding slope shape ("Incline",Decline","Peak","Trough")
Parameters:
val : Oscillator Value to use
type : Slope of length curve ("Incline",Decline","Peak","Trough")
Returns: Variable Length Integer
hlAverage(val, smooth, max, min, type, include)
Average of HH,LL with variable lengths based on the slope shape ("Incline","Decline","Trough") value relative to highest and lowest
Parameters:
val : Source Value to use
smooth
max
min
type
include : Add "val" to the averaging process, instead of more weight to highest or lowest value
Returns: Variable Length Average of Highest Lowest "val"
pct(val)
Convert a positive float / price to a percentage of it's highest value on record
Parameters:
val : Value To convert to a percentage of it's highest value ever
Returns: Percentage
hlrange(x, len)
Difference between Highest High and Lowest Low of float value
Parameters:
x : Value to use in calculation
len : Number of bars to include in calculation
Returns: Difference
midpoint(x, len, smooth)
The average value of the float's Highest High and Lowest Low in a number of bars
Parameters:
x : Value to use in calculation
len
smooth : (Default=na) Optional smoothing type to use ("SMA","EMA","RMA","WMA","VWAP","SWMA","LRC")
Returns: Midpoint
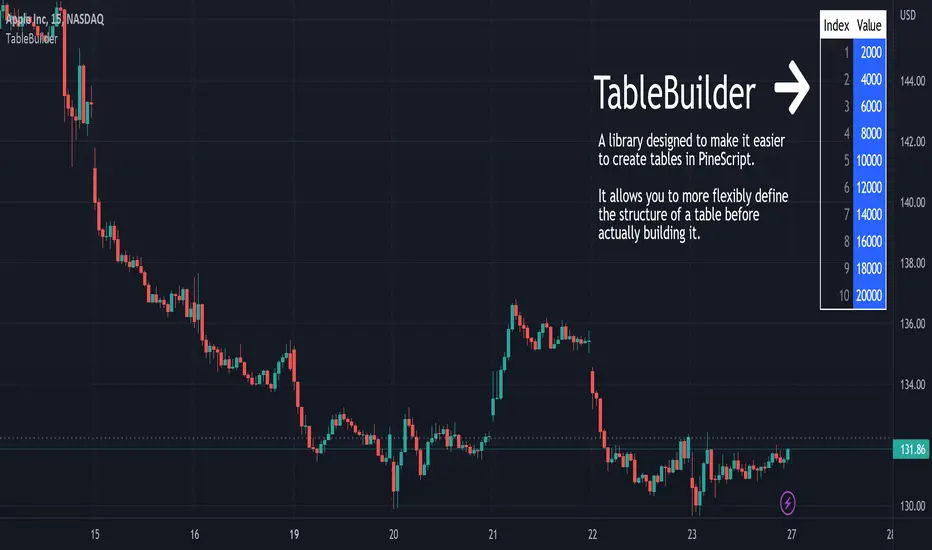
TableBuilderTableBuilder is a library designed to make it easier to create tables in PineScript.
It allows you to more flexibly define the structure of a table before actually building it.
Features:
Style inheritance: styles are inherited from Table, to Column, to Row, and then Cell.
Columns are useful for propagating/reusing style but they are not required.
Add rows with different numbers of cells. The resultant number of columns in the table will be determined by the max number of cells vs the number of defined columns.
Auto text color: Instead of having to set the font color for every cell, the color is automatically determined by the luminosity of the background color.
See the 'Demo' section of the code for an example.
ColorUtility for working with colors.
Get the luminosity of a color and determine the optimal (black or white) foreground color.

ISODateTimeLibrary "ISODateTime"
getDateParts(dateStr)
Get year, month, day from date string.
Parameters:
dateStr : : ISO 8601 format, i.e. "2022-05-04T14:00:00.001000-04:00" or "2022-05-04T14:00:00Z"
Returns: array of int
getTimeParts(dateStr)
Get hour, minute, seconds from date string.
Parameters:
dateStr : : ISO 8601 format, i.e. "2022-05-04T14:00:00.001000-04:00" or "2022-05-04T14:00:00Z"
Returns: array of int
getUTCTimezone(dateStr)
Get UTC timezone.
Parameters:
dateStr : : ISO 8601 format, i.e. "2022-05-04T14:00:00.001000-04:00" or "2022-05-04T14:00:00Z"
Returns: string UTC timezone
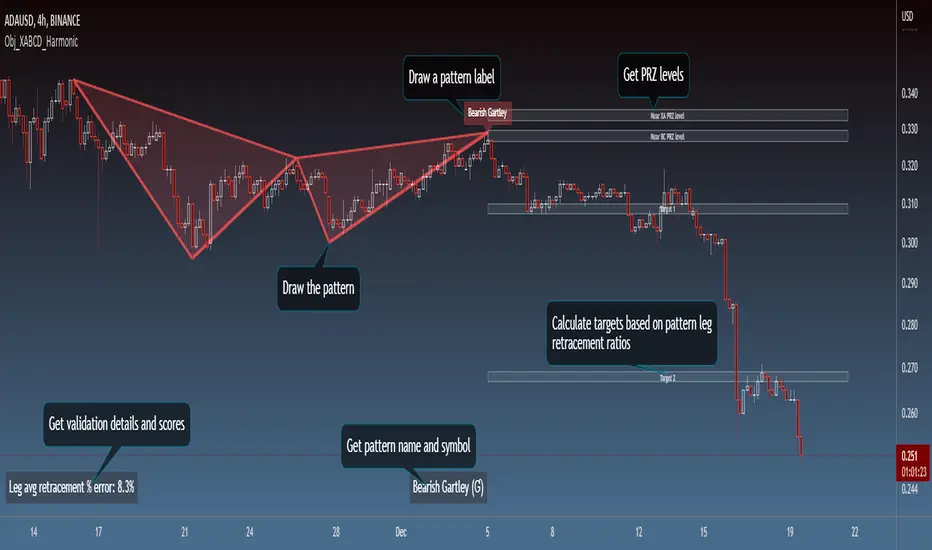
Obj_XABCD_HarmonicLibrary "Obj_XABCD_Harmonic"
Harmonic XABCD Pattern object and associated methods. Easily validate, draw, and get information about harmonic patterns. See example code at the end of the script for details.
init_params(pct_error, pct_asym, types, w_e, w_p, w_d)
Create a harmonic parameters object (used by xabcd_harmonic object for pattern validation and scoring).
Parameters:
pct_error : Allowed % error of leg retracement ratio versus the defined harmonic ratio
pct_asym : Allowed leg length/period asymmetry % (a leg is considered invalid if it is this % longer or shorter than the average length of the other legs)
types : Array of pattern types to validate (1=Gartley, 2=Bat, 3=Butterfly, 4=Crab, 5=Shark, 6=Cypher)
w_e : Weight of ratio % error (used in score calculation, dft = 1)
w_p : Weight of PRZ confluence (used in score calculation, dft = 1)
w_d : Weight of Point D / PRZ confluence (used in score calculation, dft = 1)
Returns: harmonic_params object instance. It is recommended to store and reuse this object for multiple xabcd_harmonic objects rather than creating new params objects unnecessarily.
init(xX, xY, aX, aY, bX, bY, cX, cY, dX, dY, params, tp, p)
Initialize an xabcd_harmonic object instance.
If the pattern is valid, an xabcd_harmonic object instance is returned. If you want to specify your
own validation and scoring parameters, you can do so by passing a harmonic_params object (params).
Or, if you prefer to do your own validation, you can explicitly pass the harmonic pattern type (tp)
and validation will be skipped. You can also pass in an existing xabcd_harmonic instance if you wish
to re-initialize it (e.g. for re-validation and/or re-scoring).
Parameters:
xX : Point X bar index
xY : Point X price/level
aX : Point A bar index
aY : Point A price/level
bX : Point B bar index
bY : Point B price/level
cX : Point C bar index
cY : Point C price/level
dX : Point D bar index
dY : Point D price/level
params : harmonic_params used to validate and score the pattern. Validation will be skipped if a type (tp) is explicitly passed in.
tp : Pattern type
p : xabcd_harmonic object instance to initialize (optional, for re-validation/re-scoring)
Returns: xabcd_harmonic object instance if a valid harmonic, else na
get_name(p)
Get the pattern name
Parameters:
p : Instance of xabcd_harmonic object
Returns: Pattern name (string)
get_symbol(p)
Get the pattern symbol
Parameters:
p : Instance of xabcd_harmonic object
Returns: Pattern symbol (1 byte string)
get_pid(p)
Get the Pattern ID. Patterns of the same type with the same coordinates will have the same Pattern ID.
Parameters:
p : Instance of xabcd_harmonic object
Returns: Pattern ID (string)
set_target(p, target, target_lvl, calc_target)
Set value for a target. Use the calc_target parameter to automatically calculate the target for a specific harmonic ratio.
Parameters:
p : Instance of xabcd_harmonic object
target : Target (1 or 2)
target_lvl : Target price/level (required if calc_target is not specified)
calc_target : Target to auto calculate (required if target is not specified)
Options:
Returns: Target price/level (float)
erase_pattern(p)
Erase the pattern
Parameters:
p : Instance of xabcd_harmonic object
Returns: p
draw_pattern(p)
Draw the pattern
Parameters:
p : Instance of xabcd_harmonic object
Returns: Pattern lines
erase_label(p)
Erase the pattern label
Parameters:
p : Instance of xabcd_harmonic object
Returns: p
draw_label(p, txt, tooltip, clr, txt_clr)
Draw the pattern label. Default text is the pattern name.
Parameters:
p : Instance of xabcd_harmonic object
txt : Label text
tooltip : Tooltip text
clr : Label color
txt_clr : Text color
Returns: Label
harmonic_params
Validation and scoring parameters for a Harmonic Pattern object (xabcd_harmonic)
Fields:
pct_error : Allowed % error of leg retracement ratio versus the defined harmonic ratio
pct_asym
types
w_e
w_p
w_d
xabcd_harmonic
Harmonic Pattern object
Fields:
bull : Bullish pattern flag
tp
xX
xY
aX
aY
bX
bY
cX
cY
dX
dY
r_xb
re_xb
r_ac
re_ac
r_bd
re_bd
r_xd
re_xd
score
score_eAvg
score_prz
score_eD
prz_bN
prz_bF
prz_xN
prz_xF
t1Hit : Target 1 flag
t1
t2Hit
t2
sHit : Stop flag
stop : Stop level
entry : Entry level
eHit
eX
eY
pLines
pLabel
pid
params
Signal AnalyzerThis library contains functions that try to analyze trading signals performance.
Like the % of average returns after a long or short signal is provided or the number of times that signal was correct, in the inmediate 2 candles after the signal.

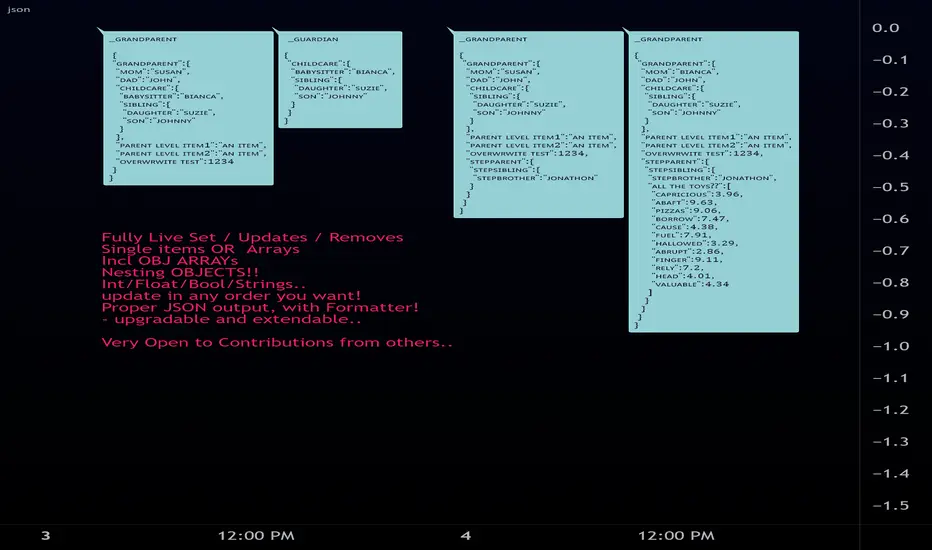
jsonLibrary "json"
JSON Easy Object Create/stringiffy
Functions to add/write JSON
new (name , kind) -> object
set (_item , _obj , _key ) -> key index for parent object's array
add (_obj , _key , _item ) -> key index for parent object's array
write (object , kind ) -> stringified object // (enter kind to cut off key )
============================================
obj
obj Object storage container/item
Fields:
key : (string ) item name
kind : (string ) item's type(for writing)
item : (string ) item (converted to string)
keys : (string ) keys of all sub-items and objects
items : (obj ) nested obj off individual subitems (for later...)
============================================
new(_name, _kind)
create multitype object
Parameters:
_name : (string) Name off object
_kind : (string) Preset Type (_OBJECT if a container item)
Returns: object container/item 2-in-1
============================================
add(_item, _obj, _key)
Set item to object obj item (same as set, prep for future Pine methods)
Parameters:
_item : ( int / float / bool / string )
_obj : (obj multi-type-item object)
_key : ( string )
set(_item, _obj, _key)
Set item to object obj item (same as add, prep for future Pine methods)
Parameters:
_item : ( int / float / bool / string )
_obj : (obj multi-type-item object)
_key : ( string )
addstore(_parent, _child)
Add a object as a subobject to storage (Future upgrade to write/edit)
Parameters:
_parent : to insert obj into
_child : to be inserted
setstore(_child, _parent)
Add a object as a subobject to storage (Future upgrade to write/edit)
Parameters:
_child : to be inserted
_parent : to insert obj into
add(_parent, _child)
Add a object as a string rendered item
Parameters:
_parent : to insert obj into
_child : to be inserted
set(_child, _parent)
Add a object as a string rendered item
Parameters:
_child : to be inserted
_parent : to insert obj into
============================================
write(_object, _key, _itemname)
Write object to string Object
Parameters:
_object : (obj)
_key : (array<(string/int)> )/(string)
_itemname : (string)
Returns: stringified flattened object.
clean_output(_str)
Clean JSON final output
Parameters:
_str : string json item
Returns: cleaned string
WelcomeUDT█ OVERVIEW
This is a simplest example of user-defined types (UDT) or objects , which simplify as alternative to hello world.
█ CREDITS
Tradingview
█ USAGE
These are the types used during initializations, commonly variables.
export type Settings
int bar
float price
string phrase
...
Example of library function to print out label.
export printLabel(Settings setup) =>
if setup.variable
var label lab = na
label.delete(lab)
lab := label.new(setup.bar, setup.price, setup.phrase, color = setup.bg)
else
label.new(setup.bar, setup.price, setup.phrase, color = setup.bg)
Usage of types
Settings setup = Settings.new(bar_index , priceInput, phraseInput, colorInput, variableInput)
Alternative way to write types
Settings setup = Settings.new(
bar = bar_index ,
price = priceInput,
phrase = phraseInput,
variable = variableInput)
Usage of types into custom function / library function.
printLabel(setup)
printLabel(Settings)
Print out label
Parameters:
Settings : types
Returns: Label object
Settings
Initialize type values
Fields:
bar : X position for label
price : Y position for label
phrase : Text for label
bg : Color for label
variable : Boolean for enable new line and delete line

ZigZag█ OVERVIEW
This library is a Pine Script™ programmer’s tool containing custom user-defined types and functions to calculate Zig Zag indicators within their scripts. It is not a stand-alone indicator.
Pine Script™ libraries are publications that contain reusable code for importing into Pine Script™ indicators, strategies, and other libraries. For more information on libraries and incorporating them into your scripts, see the Libraries section of the Pine Script™ User Manual .
█ CONCEPTS
Zig Zag
Zig Zag is a popular indicator that filters out minor price fluctuations to denoise data and emphasize trends. Traders commonly use Zig Zag for trend confirmation, identifying potential support and resistance, and pattern detection. It is formed by identifying significant local high and low points in alternating order and connecting them with straight lines, omitting all other data points from their output. There are several ways to calculate the Zig Zag's data points and the conditions by which its direction changes. This script uses pivots as the data points, which are the highest or lowest values over a defined number of bars before and after them. The direction only reverses when a newly formed pivot deviates from the last Zig Zag point in the opposite direction by an amount greater than or equal to a specified percentage.
To learn more about Zig Zag and how to calculate it, see this entry from the Help Center.
█ FOR Pine Script™ CODERS
Notes
This script's architecture utilizes user-defined types (UDTs) to create custom objects which are the equivalent of variables containing multiple parts, each able to hold independent values of different types . UDTs are the newest addition to Pine Script™ and the most advanced feature the language has seen to date. The feature's introduction creates a new runway for experienced coders to push the boundaries of Pine. We recommend that newcomers to the language explore the basics first before diving into UDTs and objects.
Demonstration Code
Our example code shows a simple use case by displaying a Zig Zag with user-defined settings. A new ZigZag object is instantiated on the first bar using a Settings object to control its attributes. The fields for the Settings object are declared using variables assigned to input.* functions, allowing control of the field values from the script's settings. The `update()` function is invoked on each bar to update the ZigZag object's fields and create new lines and labels when required.
Look first. Then leap.
█ TYPES
This library contains the following types:
Settings
Provides calculation and display attributes to ZigZag objects.
Fields:
devThreshold : The minimum percentage deviation from a point before the ZigZag will change direction.
depth : The number of bars required for pivot detection.
lineColor : Line color.
extendLast : Condition allowing a line to connect the most recent pivot with the current close.
displayReversalPrice : Condition to display the pivot price in the pivot label.
displayCumulativeVolume : Condition to display the cumulative volume for the pivot segment in the pivot label.
displayReversalPriceChange : Condition to display the change in price or percent from the previous pivot in the pivot label.
differencePriceMode : Reversal change display mode. Options are "Absolute" or "Percent".
draw : Condition to display lines and labels.
Point
A coordinate containing time and price information.
Fields:
tm : A value in UNIX time.
price : A value on the Y axis (price).
Pivot
A level of significance used to determine directional movement or potential support and resistance.
Fields:
ln : A line object connecting the `start` and `end` Point objects.
lb : A label object to display pivot values.
isHigh : A condition to determine if the pivot is a pivot high.
vol : Volume for the pivot segment.
start : The coordinate of the previous Point.
end : The coordinate of the current Point.
ZigZag
An object to maintain Zig Zag settings, pivots, and volume.
Fields:
settings : Settings object to provide calculation and display attributes.
pivots : An array of Pivot objects.
sumVol : The volume sum for the pivot segment.
extend : Pivot object used to project a line from the last pivot to the last bar.
█ FUNCTIONS
This library contains the following functions:
lastPivot(this)
Returns the last Pivot of `this` ZigZag if there is at least one Pivot to return, and `na` otherwise.
Parameters:
this : (series ZigZag) A ZigZag object.
Returns: (Pivot) The last Pivot in the ZigZag.
update(this)
Updates `this` ZigZag object with new pivots, volume, lines, labels.
Parameters:
this : (series ZigZag) a ZigZag object.
Returns: (bool) true if a new Zig Zag line is found or the last Zig Zag line has changed.
newInstance(settings)
Instantiates a new ZigZag object with `settings`. If no settings are provided, a default ZigZag object is created.
Parameters:
settings : (series Settings) A Settings object.
Returns: (ZigZag) A new ZigZag instance.

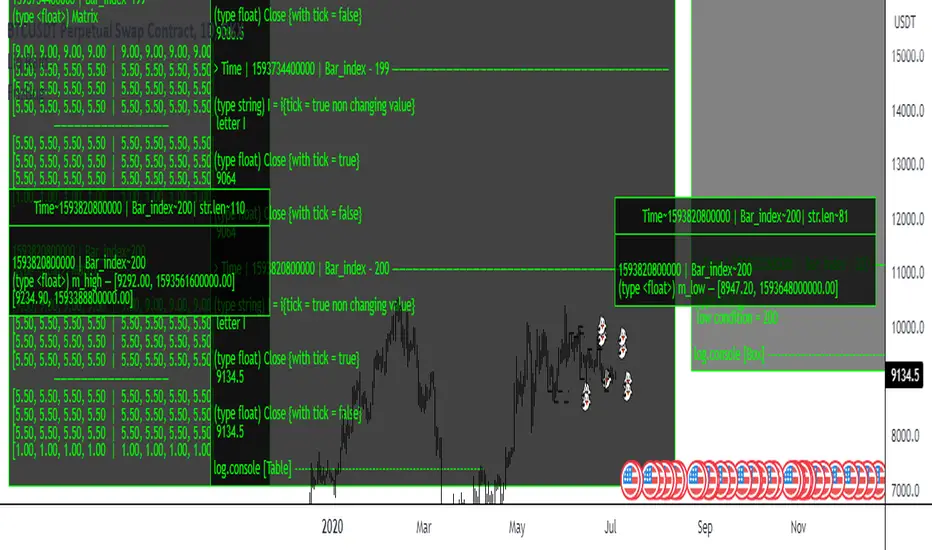
FrizBugLibrary "FrizBug"
Debug Tools | Pinescript Debugging Tool Kit
All in one Debugger - the benefit of wrapper functions to simply wrap variables or outputs and have the code still execute the same. Perfect for Debugging on Pine
str(inp)
Overloaded tostring like Function for all type+including Object Variables will also do arrays and matricies of all Types
Parameters:
inp : All types
Returns: string
print_label(str, x_offset, y, barstate, style, color, textcolor, text_align, size)
Label Helper Function - only needs the Str input to work
Parameters:
str :
x_offset : offset from last bar + or -
y : price of label
barstate : barstate built in variable
style : label style settin7
color : color setting
textcolor : textcolor
text_align : text align setting
size : text_sise
Returns: label
init()
initializes the database arrays
Returns: tuple | 2 matrix (1 matrix is varip(live) the other is reagular var (Bar))
update(log, live, live_console, log_console, live_lbl, log_lbl)
Put at the very end of your code / This updates all of the consoles
Parameters:
log : This matrix is the one used for Bar updates
live : This matrix is the one used for Real Time updates
live_console : on_offs for the consoles and lbls - call in the update function
log_console : on_offs for the consoles and lbls - call in the update function
live_lbl : on_offs for the consoles and lbls - call in the update function
log_lbl : on_offs for the consoles and lbls - call in the update function
Returns: void
log(log, inp, str_label, off, rows, index_cols, bars_back)
Function Will push to the Console offset to the right of Current bar, This is the main Console - it has 2 Feeds left and right (changeable)"
Parameters:
log : Matrix - Log or Live
inp : All types
str_label : (optional) This input will label it on the feed
off : Useful for when you don't want to remove the function"
rows : when printing or logging a matrix this will shorten the output will show last # of rows"
index_cols : When printing or logging a array or matrix this will shorten the array or the columns of a matrix by the #"
bars_back : Adjustment for Bars Back - Default is 1 (0 for barstate.islast)"
Returns: inp - all types (The log and print functions can be used as wrapper functions see usage below for examples)
Print(log, str_label, off, bars_back)
Function can be used to send information to a label style Console, Can be used as a wrapper function, Similar to str.format use with str()
Parameters:
log :
str_label : (optional) Can be used to label Data sent to the Console
off : Useful for when you don't want to remove the function
bars_back : Adjustment for Bars Back - Default is 1 (0 for barstate.islast)
Returns: string
print(inp, str_label, off, bars_back)
This Function can be used to send information to a label style Console, Can be used as a wrapper function, Overload print function
Parameters:
inp : All types
str_label : string (optional) Can be used to label Data sent to the Console
off : Useful for when you don't want to remove the function
bars_back : Adjustment for Bars Back - Default is 1 (0 for barstate.islast)
Returns: inp - all types (The log and print functions can be used as wrapper functions see usage below for examples)
Credits:
@kaigouthro - for the font library
@RicardoSantos - for the concept I used to make this
Thanks!
Use cases at the bottom
BinaryInsertionSortLibrary "BinaryInsertionSort"
Library containing functions which can help create sorted array based on binary insertion sort.
This sorting will be quicker than array.sort function if the sorting needs to be done on every bar and the size of the array is comparatively big.
This is created with the intention of using this to solve a bigger problem posted by @lejmer. Wish me luck!!
binary_insertion_sort(sortedArray, item, order)
binary insertion sort - inserts item into sorted array while maintaining sort order
Parameters:
sortedArray : array which is assumed to be sorted in the requested order
item : float|int item which needs to be inserted into sorted array
order : Sort order - positive number means ascending order whereas negative number represents descending order
Returns: int index at which the item is inserted into sorted array
update_sort_indices(sortIndices, newItemIndex)
adds the sort index of new item added to sorted array and also updates existing sort indices.
Parameters:
sortIndices : array containing sort indices of an array.
newItemIndex : sort index of new item added to sorted array
Returns: void
get_array_of_series(item, order)
Converts series into array and sorted array.
Parameters:
item : float|int series
order : Sort order - positive number means ascending order whereas negative number represents descending order
Returns:
get_sorted_arrays(item, order)
Converts series into array and sorted array. Also calculates the sort order of the value array
Parameters:
item : float|int series
order : Sort order - positive number means ascending order whereas negative number represents descending order
Returns:
POALibrary "POA"
This library is a client script for making a webhook signal formatted string to POABOT server.
entry_message(password, percent, leverage, kis_number)
Create a entry message for POABOT
Parameters:
password : (string) The password of your bot.
percent : (float) The percent for entry based on your wallet balance.
leverage : (int) The leverage of entry. If not set, your levereage doesn't change.
kis_number : (int) The number of koreainvestment account.
Returns: (string) A json formatted string for webhook message.
close_message(password, percent, kis_number)
Create a close message for POABOT
Parameters:
password : (string) The password of your bot.
percent : (float) The percent for close based on your wallet balance.
kis_number : (int) The number of koreainvestment account.
Returns: (string) A json formatted string for webhook message.
exit_message(password, percent)
Create a exit message for POABOT
Parameters:
password : (string) The password of your bot.
percent : (float) The percent for exit based on your wallet balance.
Returns: (string) A json formatted string for webhook message.
in_trade(start_time, end_time)
Create a trade start line
Parameters:
start_time : (int) The start of time.
end_time : (int) The end of time.
Returns: (bool) Get bool for trade based on time range.
PlurexSignalStrategyLibrary "PlurexSignalStrategy"
Provides functions that wrap the built in TradingView strategy functions so you can seemlessly integrate with Plurex Signal automation.
NOTE: Be sure to:
- set your strategy default_qty_value to the default entry percentage of your signal
- set your strategy default_qty_type to strategy.percent_of_equity
- set your strategy pyramiding to some value greater than 1 or something appropriate to your strategy in order to have multiple entries.
long(secret, budgetPercentage, priceLimit, marketOverride)
Open a new long entry. Wraps strategy function and sends plurex message as an alert.
Parameters:
secret : The secret for your Signal on plurex
budgetPercentage : Optional, The percentage of budget to use in the entry.
priceLimit : Optional, The worst price to accept for the entry.
marketOverride : Optional, defaults to the syminfo for the ticker. Use the `plurexMarket` function to build your own.
longAndFixedStopLoss(secret, stop, budgetPercentage, priceLimit, marketOverride)
Open a new long entry. Wraps strategy function and sends plurex message as an alert. Also sets a gobal stop loss for full open position
Parameters:
secret : The secret for your Signal on plurex
stop : The trigger price for the stop loss. See strategy.exit documentation
budgetPercentage : Optional, The percentage of budget to use in the entry.
priceLimit : Optional, The worst price to accept for the entry.
marketOverride : Optional, defaults to the syminfo for the ticker. Use the `plurexMarket` function to build your own.
longAndTrailingStopLoss(secret, trail_offset, trail_price, trail_points, budgetPercentage, priceLimit, marketOverride)
Open a new long entry. Wraps strategy function and sends plurex message as an alert. Also sets a gobal trailing stop loss for full open position. You must set one of trail_price or trail_points.
Parameters:
secret : The secret for your Signal on plurex
trail_offset : See strategy.exit documentation
trail_price : See strategy.exit documentation
trail_points : See strategy.exit documentation
budgetPercentage : Optional, The percentage of budget to use in the entry.
priceLimit : Optional, The worst price to accept for the entry.
marketOverride : Optional, defaults to the syminfo for the ticker. Use the `plurexMarket` function to build your own.
short(secret, budgetPercentage, priceLimit, marketOverride)
Open a new short entry. Wraps strategy function and sends plurex message as an alert.
Parameters:
secret : The secret for your Signal on plurex
budgetPercentage : Optional, The percentage of budget to use in the entry.
priceLimit : Optional, The worst price to accept for the entry.
marketOverride : Optional, defaults to the syminfo for the ticker. Use the `plurexMarket` function to build your own.
shortAndFixedStopLoss(secret, stop, budgetPercentage, priceLimit, marketOverride)
Open a new short entry. Wraps strategy function and sends plurex message as an alert. Also sets a gobal stop loss for full open position
Parameters:
secret : The secret for your Signal on plurex
stop : The trigger price for the stop loss. See strategy.exit documentation
budgetPercentage : Optional, The percentage of budget to use in the entry.
priceLimit : Optional, The worst price to accept for the entry.
marketOverride : Optional, defaults to the syminfo for the ticker. Use the `plurexMarket` function to build your own.
shortAndTrailingStopLoss(secret, trail_offset, trail_price, trail_points, budgetPercentage, priceLimit, marketOverride)
Open a new short entry. Wraps strategy function and sends plurex message as an alert. Also sets a gobal trailing stop loss for full open position. You must set one of trail_price or trail_points.
Parameters:
secret : The secret for your Signal on plurex
trail_offset : See strategy.exit documentation
trail_price : See strategy.exit documentation
trail_points : See strategy.exit documentation
budgetPercentage : Optional, The percentage of budget to use in the entry.
priceLimit : Optional, The worst price to accept for the entry.
marketOverride : Optional, defaults to the syminfo for the ticker. Use the `plurexMarket` function to build your own.
closeAll(secret, marketOverride)
Close all positions. Wraps strategy function and sends plurex message as an alert.
Parameters:
secret : The secret for your Signal on plurex
marketOverride : Optional, defaults to the syminfo for the ticker. Use the `plurexMarket` function to build your own.
closeLongs(secret, marketOverride)
close all longs. Wraps strategy function and sends plurex message as an alert.
Parameters:
secret : The secret for your Signal on plurex
marketOverride : Optional, defaults to the syminfo for the ticker. Use the `plurexMarket` function to build your own.
closeShorts(secret, marketOverride)
close all shorts. Wraps strategy function and sends plurex message as an alert.
Parameters:
secret : The secret for your Signal on plurex
marketOverride : Optional, defaults to the syminfo for the ticker. Use the `plurexMarket` function to build your own.
closeLastLong(secret, marketOverride)
Close last long entry. Wraps strategy function and sends plurex message as an alert.
Parameters:
secret : The secret for your Signal on plurex
marketOverride : Optional, defaults to the syminfo for the ticker. Use the `plurexMarket` function to build your own.
closeLastShort(secret, marketOverride)
Close last short entry. Wraps strategy function and sends plurex message as an alert.
Parameters:
secret : The secret for your Signal on plurex
marketOverride : Optional, defaults to the syminfo for the ticker. Use the `plurexMarket` function to build your own.
closeFirstLong(secret, marketOverride)
Close first long entry. Wraps strategy function and sends plurex message as an alert.
Parameters:
secret : The secret for your Signal on plurex
marketOverride : Optional, defaults to the syminfo for the ticker. Use the `plurexMarket` function to build your own.
closeFirstShort(secret, marketOverride)
Close first short entry. Wraps strategy function and sends plurex message as an alert.
Parameters:
secret : The secret for your Signal on plurex
marketOverride : Optional, defaults to the syminfo for the ticker. Use the `plurexMarket` function to build your own.
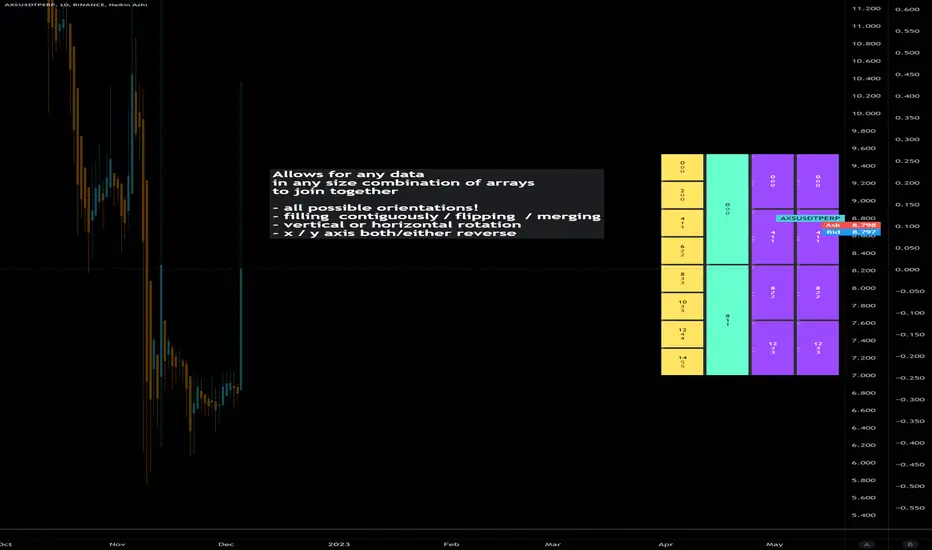
Dynamic Array Table (versatile display methods)Library "datTable"
Dynamic Array Table.... Configurable Shape/Size Table from Arrays
Allows for any data in any size combination of arrays to join together
with:
all possible orientations!
filling all cells contiguously and/or flipping at boundaries
vertical or horizontal rotation
x/y axis direction swapping
all types array inputs for data.
please notify of any bugs. thanks
init(_posit)
Get Table (otional gapping cells)
Parameters:
_posit : String or Int (1-9 3x3 grid L to R)
Returns: Table
coords()
Req'd coords Seperate for VARIP table, non-varip coords
add
Add arrays to display table. coords reset each calc
uses displaytable object, string titles, and color optional array, and second line optional data array.
PlurexSignalCoreLibrary "PlurexSignalCore"
General purpose functions and helpers for use in more specific Plurex Signal alerting scripts and libraries
plurexMarket()
Build a Plurex market string from a base and quote asset symbol.
Returns: A market string that can be used in Plurex Signal messages.
tickerToPlurexMarket()
Builds Plurex market string from the syminfo
Returns: A market string that can be used in Plurex Signal messages.
simpleMessage(secret, action, marketOverride)
Builds Plurex Signal Message json to be sent to a Signal webhook
Parameters:
secret : The secret for your Signal on plurex
action : The action of the message. One of .
marketOverride : Optional, defaults to the syminfo for the ticker. Use the `plurexMarket` function to build your own.
Returns: A json string message that can be used in alerts to send messages to Plurex.
entryMessage(secret, isLong, budgetPercentage, priceLimit, marketOverride)
Builds Plurex Signal Entry Message json to be sent to a Signal webhook with optional parameters for budget and price limits.
Parameters:
secret : The secret for your Signal on plurex
isLong : The action of the message. true for LONG, false for SHORT.
budgetPercentage : Optional, The percentage of budget to use in the entry.
priceLimit : Optional, The worst price to accept for the entry.
marketOverride : Optional, defaults to the syminfo for the ticker. Use the `plurexMarket` function to build your own.
Returns: A json string message that can be used in alerts to send messages to Plurex.
long(secret, budgetPercentage, priceLimit, marketOverride)
Builds Plurex Signal LONG Message json to be sent to a Signal webhook with optional parameters for budget and price limits.
Parameters:
secret : The secret for your Signal on plurex
budgetPercentage : Optional, The percentage of budget to use in the entry.
priceLimit : Optional, The worst price to accept for the entry.
marketOverride : Optional, defaults to the syminfo for the ticker. Use the `plurexMarket` function to build your own.
Returns: A json string message that can be used in alerts to send messages to Plurex.
short(secret, budgetPercentage, priceLimit, marketOverride)
Builds Plurex Signal SHORT Message json to be sent to a Signal webhook with optional parameters for budget and price limits.
Parameters:
secret : The secret for your Signal on plurex
budgetPercentage : Optional, The percentage of budget to use in the entry.
priceLimit : Optional, The worst price to accept for the entry.
marketOverride : Optional, defaults to the syminfo for the ticker. Use the `plurexMarket` function to build your own.
Returns: A json string message that can be used in alerts to send messages to Plurex.
closeAll(secret, marketOverride)
Builds Plurex Signal CLOSE_ALL Message json to be sent to a Signal webhook.
Parameters:
secret : The secret for your Signal on plurex
marketOverride : Optional, defaults to the syminfo for the ticker. Use the `plurexMarket` function to build your own.
Returns: A json string message that can be used in alerts to send messages to Plurex.
closeShorts(secret, marketOverride)
Builds Plurex Signal CLOSE_SHORTS Message json to be sent to a Signal webhook.
Parameters:
secret : The secret for your Signal on plurex
marketOverride : Optional, defaults to the syminfo for the ticker. Use the `plurexMarket` function to build your own.
Returns: A json string message that can be used in alerts to send messages to Plurex.
closeLongs(secret, marketOverride)
Builds Plurex Signal CLOSE_LONGS Message json to be sent to a Signal webhook.
Parameters:
secret : The secret for your Signal on plurex
marketOverride : Optional, defaults to the syminfo for the ticker. Use the `plurexMarket` function to build your own.
Returns: A json string message that can be used in alerts to send messages to Plurex.
closeFirstLong(secret, marketOverride)
Builds Plurex Signal CLOSE_FIRST_LONG Message json to be sent to a Signal webhook.
Parameters:
secret : The secret for your Signal on plurex
marketOverride : Optional, defaults to the syminfo for the ticker. Use the `plurexMarket` function to build your own.
Returns: A json string message that can be used in alerts to send messages to Plurex.
closeLastLong(secret, marketOverride)
Builds Plurex Signal CLOSE_LAST_LONG Message json to be sent to a Signal webhook.
Parameters:
secret : The secret for your Signal on plurex
marketOverride : Optional, defaults to the syminfo for the ticker. Use the `plurexMarket` function to build your own.
Returns: A json string message that can be used in alerts to send messages to Plurex.
closeFirstShort(secret, marketOverride)
Builds Plurex Signal CLOSE_FIRST_SHORT Message json to be sent to a Signal webhook.
Parameters:
secret : The secret for your Signal on plurex
marketOverride : Optional, defaults to the syminfo for the ticker. Use the `plurexMarket` function to build your own.
Returns: A json string message that can be used in alerts to send messages to Plurex.
closeLastShort(secret, marketOverride)
Builds Plurex Signal CLOSE_LAST_SHORT Message json to be sent to a Signal webhook.
Parameters:
secret : The secret for your Signal on plurex
marketOverride : Optional, defaults to the syminfo for the ticker. Use the `plurexMarket` function to build your own.
Returns: A json string message that can be used in alerts to send messages to Plurex.
Stringify - Timeframe Enumeration --> StringLibrary "Stringify"
Cast variable types and enumerations to human-readable Strings
timeframe(string)
Cast a timeframe enumeration to readable string.
Parameters:
string : `T` is a timeframe enumeration ('3D', '120', '15', '5s' ...)
Returns: A string representation of the timeframe or 'NA' if `x` is `na`

EMAFlowLibrary "EMAFlow"
Functions that manipulate a set of 5 MAs created within user-supplied maximum and minimum lengths. The MAs are spaced out (within the range) in a way that approximates how Fibonnaci numbers are spaced.
Using MA flow, as opposed to simple crosses of the minimum and maximum lengths, gives more detail, and can result in faster changes and more resistance to chop, depending how you use it.
f_emaFlowBias()
@function f_emaFlowBias: Gives a bullish or bearish bias reading based on the EMA flow from the user-supplied range.
@param int _min: The minimum length of the EMA set.
@param int _max: The maximum length of the EMA set.
@param: string _source: The source for the EMA set. Must be in standard format (open, close, ohlc4, etc.)
@returns: An integer, representing the bias: 1 is bearish, 2 is slightly bearish, 3 is neutral, 4 is slightly bullish, 5 is bullish.

taLibrary "ta"
Collection of all custom and enhanced TA indicators. Same as enhanced_ta. But, removed all the displays to make it faster.
ma(source, maType, length)
returns custom moving averages
Parameters:
source : Moving Average Source
maType : Moving Average Type : Can be sma, ema, hma, rma, wma, vwma, swma, highlow, linreg, median
length : Moving Average Length
Returns: moving average for the given type and length
atr(maType, length)
returns ATR with custom moving average
Parameters:
maType : Moving Average Type : Can be sma, ema, hma, rma, wma, vwma, swma, highlow, linreg, median
length : Moving Average Length
Returns: ATR for the given moving average type and length
atrpercent(maType, length)
returns ATR as percentage of close price
Parameters:
maType : Moving Average Type : Can be sma, ema, hma, rma, wma, vwma, swma, highlow, linreg, median
length : Moving Average Length
Returns: ATR as percentage of close price for the given moving average type and length
bb(source, maType, length, multiplier, sticky)
returns Bollinger band for custom moving average
Parameters:
source : Moving Average Source
maType : Moving Average Type : Can be sma, ema, hma, rma, wma, vwma, swma, highlow, linreg, median
length : Moving Average Length
multiplier : Standard Deviation multiplier
sticky : - sticky boundaries which will only change when value is outside boundary.
Returns: Bollinger band with custom moving average for given source, length and multiplier
bbw(source, maType, length, multiplier, sticky)
returns Bollinger bandwidth for custom moving average
Parameters:
source : Moving Average Source
maType : Moving Average Type : Can be sma, ema, hma, rma, wma, vwma, swma, highlow, linreg, median
length : Moving Average Length
multiplier : Standard Deviation multiplier
sticky : - sticky boundaries which will only change when value is outside boundary.
Returns: Bollinger Bandwidth for custom moving average for given source, length and multiplier
bpercentb(source, maType, length, multiplier, sticky)
returns Bollinger Percent B for custom moving average
Parameters:
source : Moving Average Source
maType : Moving Average Type : Can be sma, ema, hma, rma, wma, vwma, swma, highlow, linreg, median
length : Moving Average Length
multiplier : Standard Deviation multiplier
sticky : - sticky boundaries which will only change when value is outside boundary.
Returns: Bollinger Percent B for custom moving average for given source, length and multiplier
kc(source, maType, length, multiplier, useTrueRange, sticky)
returns Keltner Channel for custom moving average
Parameters:
source : Moving Average Source
maType : Moving Average Type : Can be sma, ema, hma, rma, wma, vwma, swma, highlow, linreg, median
length : Moving Average Length
multiplier : Standard Deviation multiplier
useTrueRange : - if set to false, uses high-low.
sticky : - sticky boundaries which will only change when value is outside boundary.
Returns: Keltner Channel for custom moving average for given souce, length and multiplier
kcw(source, maType, length, multiplier, useTrueRange, sticky)
returns Keltner Channel Width with custom moving average
Parameters:
source : Moving Average Source
maType : Moving Average Type : Can be sma, ema, hma, rma, wma, vwma, swma, highlow, linreg, median
length : Moving Average Length
multiplier : Standard Deviation multiplier
useTrueRange : - if set to false, uses high-low.
sticky : - sticky boundaries which will only change when value is outside boundary.
Returns: Keltner Channel Width for custom moving average
kpercentk(source, maType, length, multiplier, useTrueRange, sticky)
returns Keltner Channel Percent K Width with custom moving average
Parameters:
source : Moving Average Source
maType : Moving Average Type : Can be sma, ema, hma, rma, wma, vwma, swma, highlow, linreg, median
length : Moving Average Length
multiplier : Standard Deviation multiplier
useTrueRange : - if set to false, uses high-low.
sticky : - sticky boundaries which will only change when value is outside boundary.
Returns: Keltner Percent K for given moving average, source, length and multiplier
dc(length, useAlternateSource, alternateSource, sticky)
returns Custom Donchian Channel
Parameters:
length : - donchian channel length
useAlternateSource : - Custom source is used only if useAlternateSource is set to true
alternateSource : - Custom source
sticky : - sticky boundaries which will only change when value is outside boundary.
Returns: Donchian channel
dcw(length, useAlternateSource, alternateSource, sticky)
returns Donchian Channel Width
Parameters:
length : - donchian channel length
useAlternateSource : - Custom source is used only if useAlternateSource is set to true
alternateSource : - Custom source
sticky : - sticky boundaries which will only change when value is outside boundary.
Returns: Donchian channel width
dpercentd(useAlternateSource, alternateSource, length, sticky)
returns Donchian Channel Percent of price
Parameters:
useAlternateSource : - Custom source is used only if useAlternateSource is set to true
alternateSource : - Custom source
length : - donchian channel length
sticky : - sticky boundaries which will only change when value is outside boundary.
Returns: Donchian channel Percent D
oscillatorRange(source, method, highlowLength, rangeLength, sticky)
oscillatorRange - returns Custom overbought/oversold areas for an oscillator input
Parameters:
source : - Osillator source such as RSI, COG etc.
method : - Valid values for method are : sma, ema, hma, rma, wma, vwma, swma, highlow, linreg, median
highlowLength : - length on which highlow of the oscillator is calculated
rangeLength : - length used for calculating oversold/overbought range - usually same as oscillator length
sticky : - overbought, oversold levels won't change unless crossed
Returns: Dynamic overbought and oversold range for oscillator input
oscillator(type, length, shortLength, longLength, source, highSource, lowSource, method, highlowLength, sticky)
oscillator - returns Choice of oscillator with custom overbought/oversold range
Parameters:
type : - oscillator type. Valid values : cci, cmo, cog, mfi, roc, rsi, stoch, tsi, wpr
length : - Oscillator length - not used for TSI
shortLength : - shortLength only used for TSI
longLength : - longLength only used for TSI
source : - custom source if required
highSource : - custom high source for stochastic oscillator
lowSource : - custom low source for stochastic oscillator
method : - Valid values for method are : sma, ema, hma, rma, wma, vwma, swma, highlow, linreg, median
highlowLength : - length on which highlow of the oscillator is calculated
sticky : - overbought, oversold levels won't change unless crossed
Returns: Oscillator value along with dynamic overbought and oversold range for oscillator input
multibands(bandType, source, maType, length, useTrueRange, sticky, numberOfBands, multiplierStart, multiplierStep)
multibands - returns Choice of oscillator with custom overbought/oversold range
Parameters:
bandType : - Band type - can be either bb or kc
source : - custom source if required
maType : Moving Average Type : Can be sma, ema, hma, rma, wma, vwma, swma, highlow, linreg, median
length : - Oscillator length - not used for TSI
useTrueRange : - if set to false, uses high-low.
sticky : - for sticky borders which only change upon source crossover/crossunder
numberOfBands : - Number of bands to generate
multiplierStart : - Starting ATR or Standard deviation multiplier for first band
multiplierStep : - Incremental value for multiplier for each band
Returns: array of band values sorted in ascending order
mbandoscillator(bandType, source, maType, length, useTrueRange, stickyBands, numberOfBands, multiplierStart, multiplierStep)
mbandoscillator - Multiband oscillator created on the basis of bands
Parameters:
bandType : - Band type - can be either bb or kc
source : - custom source if required
maType : Moving Average Type : Can be sma, ema, hma, rma, wma, vwma, swma, highlow, linreg, median
length : - Oscillator length - not used for TSI
useTrueRange : - if set to false, uses high-low.
stickyBands : - for sticky borders which only change upon source crossover/crossunder for band detection
numberOfBands : - Number of bands to generate
multiplierStart : - Starting ATR or Standard deviation multiplier for first band
multiplierStep : - Incremental value for multiplier for each band
Returns: oscillator currentStates - Array containing states for last n bars
