Uptrick: Volatility Weighted CloudIntroduction
The Volatility Weighted Cloud (VWC) is a trend-tracking overlay that combines adaptive volatility-based bands with a multi-source smoothed price cloud to visualize market bias. It provides users with a dynamic structure that adapts to volatility conditions while maintaining a persistent visual record of trend direction. By incorporating configurable smoothing techniques, percentile-ranked volatility, and multi-line cloud construction, the indicator allows traders to interpret price context more effectively without relying on raw price movement alone.
Overview
The script builds a smoothed price basis using the open, and close prices independently, and uses these to construct a layered visual cloud. This cloud serves both as a reference for price structure and a potential area of dynamic support and resistance. Alongside this cloud, adaptive upper and lower bands are plotted using volatility that scales with percentile rank. When price closes above or below these bands, the script interprets that as a breakout and updates the trend bias accordingly.
Candle coloring is persistent and reflects the most recent confirmed signal. Labels can optionally be placed on the chart when the trend bias flips, giving traders additional visual reference points. The indicator is designed to be both flexible and visually compact, supporting different strategies and timeframes through its detailed configuration options.
Originality
This script introduces originality through its combined use of percentile-ranked volatility, adaptive envelope sizing, and multi-source cloud construction. Unlike static-band indicators, the Volatility Weighted Cloud adjusts its band width based on where current volatility ranks within a defined lookback range. This dynamic scaling allows for smoother signal behavior during low-volatility environments and more responsive behavior during high-volatility phases.
Additionally, instead of using a single basis line, the indicator computes two separate smoothed lines for open and close. These are rendered into a shaded visual cloud that reflects price structure more completely than traditional moving average overlays. The use of ALMA and MAD, both less commonly applied in volatility-band overlays, adds further control over smoothing behavior and volatility measurement, enhancing its adaptability across different market types.
Inputs
Group: Core
Basis Length (short-term): The number of bars used for calculating the primary basis line. Affects how quickly the basis responds to price changes.
Basis Type: Option to choose between EMA and ALMA. EMA provides a standard exponential average; ALMA offers a centered, Gaussian-weighted average with reduced lag.
ALMA Offset: Determines the balance point of the ALMA window. Only applies when ALMA is selected.
Sigma: Sets the width of the ALMA smoothing window, influencing how much smoothing is applied.
Basis Smoothing EMA: Adds additional EMA-based smoothing to the computed basis line for noise reduction.
Group: Volatility & Bands
Volatility: Choose between StDev (standard deviation) and MAD (median absolute deviation) for measuring price volatility.
Vol Length (short-term): Length of the window used for calculating volatility.
Vol Smoothing EMA: Smooths the raw volatility value to stabilize band behavior.
Min Multiplier: Minimum multiplier applied to volatility when forming the adaptive bands.
Max Multiplier: Maximum multiplier applied at high volatility percentile.
Volatility Rank Lookback: Number of bars used to calculate the percentile rank of current volatility.
Show Adaptive Bands: Enables or disables the display of upper and lower volatility bands on the chart.
Group: Trend Switch Labels
Show Trend Switch Labels: Toggles the appearance of labels when the trend direction changes.
Label Anchor: Defines whether the labels are anchored to recent highs/lows or to the main basis line.
ATR Length (offset): Length used for calculating ATR, which determines label offset distance.
ATR Offset (multiplier): Multiplies the ATR value to place labels away from price bars for better visibility.
Label Size: Allows selection of label size (tiny to huge) to suit different chart setups.
Features
Adaptive Volatility Bands: The indicator calculates volatility using either standard deviation or MAD. It then applies an EMA smoothing layer and scales the band width dynamically based on the percentile rank of volatility over a user-defined lookback window. This avoids fixed-width bands and allows the indicator to adapt to changing volatility regimes in real time.
Volatility Method Options: Users can switch between two volatility measurement methods:
➤ Standard Deviation (StDev): Captures overall price dispersion, but may be sensitive to spikes.
➤ Median Absolute Deviation (MAD): A more robust measure that reduces the effect of outliers, making the bands less jumpy during erratic price behavior.
Basis Type Options: The core price basis used for cloud and bands can be built from:
➤ Exponential Moving Average (EMA): Fast-reacting and widely used in trend systems.
➤ Arnaud Legoux Moving Average (ALMA): A smoother, more centered alternative that offers greater control through offset and sigma parameters.
Multi-Line Basis Cloud: The cloud is formed by plotting two individually smoothed basis lines from open and close prices. A filled area is created between the open and close basis lines. This cloud serves as a dynamic support or resistance zone, allowing users to identify possible reversal areas. Price moving through or rejecting from the cloud can be interpreted contextually, especially when combined with band-based signals.
Persistent Trend Bias Coloring: The indicator uses the last confirmed breakout (above upper band or below lower band) to determine bias. This bias is reflected in the color of every subsequent candle, offering a persistent visual cue until a new signal is triggered. It helps simplify trend recognition, especially in choppy or sideways markets.
Trend Switch Labels: When enabled, the script places labeled markers at the exact bar where the bias direction switches. Labels are anchored either to recent highs/lows or to the main basis line, and spaced vertically using an ATR-based offset. This allows the trader to quickly locate historical trend transitions.
Alert Conditions: Two built-in alert conditions are available:
➤ Long Signal: Triggered when the close crosses above the upper adaptive band.
➤ Short Signal: Triggered when the close crosses below the lower adaptive band.
These conditions can be used for custom alerts, automation, or external signaling tools.
Display Control and Flexibility: Users can disable the adaptive bands for a cleaner layout while keeping the basis cloud and candle coloring active. The indicator can be tuned for fast or slow response depending on the strategy in use, and is suitable for intraday, swing, or position trading.
Summary
The Volatility Weighted Cloud is a configurable trend-following overlay that uses adaptive volatility bands and a structured cloud system to help visualize market bias. By combining EMA or ALMA smoothing with percentile-ranked volatility and a four-line price structure, it provides a flexible and informative charting layer. Its key strengths lie in the use of dynamic envelopes, visually persistent trend indication, and clearly defined breakout zones that adapt to current volatility conditions.
Disclaimer
This indicator is for informational and educational purposes only. Trading involves risk and may not be suitable for all investors. Past performance does not guarantee future results.
指標和策略

pyogi24 Intraday Ichimoku + RSIcustom script to get entry exit
its based on the ichimoku cloud indicator
and the cross over of the leading ang lagging spans to get the signals,
its under development.
i have also integrated the vwap so we know the bias of the trend.
this should work on a trending day.

CVD Divergences (cdikici71 x tncylyv)CVD Divergence
Summary
This indicator brings the powerful and creative divergence detection logic from @cdikici71's popular "cd_RSI_Divergence_Cx" script to the world of volume analysis.
While RSI is a fantastic momentum tool, I personally choose to rely on volume as a primary source of truth. This script was born from the desire to see how true buying and selling pressure—measured by Cumulative Volume Delta (CVD)—diverges from price action. It takes the brilliant engine built by @cdikici71 and applies it to CVD, offering a unique look into market conviction.
What is Cumulative Volume Delta (CVD)?
CVD is a running total of volume that transacted at the ask price (buying) minus volume that transacted at the bid price (selling). In simple terms, it shows whether buyers or sellers have been more aggressive over a period. A rising CVD suggests net buying pressure, while a falling CVD suggests net selling pressure.
Core Features
• Divergence Engine by @cdikici71: The script uses the exact same two powerful methods for finding divergences as the original RSI version:
o Alignment with HTF Sweep: The default, cleaner method for finding high-probability divergences.
o All: A more sensitive method that finds all possible divergences.
• Anchored CVD Periods: You can choose to reset the CVD calculation on a Daily, Weekly, or Monthly basis to analyze buying and selling pressure within specific periods. Or, you can leave it on Continuous to see the all-time flow.
• Automatic Higher Timeframe (HTF) Alignment: To remove the guesswork, the "Auto-Align HTF" option will automatically select a logical higher timeframe for divergence analysis based on your current chart (e.g., 15m chart uses 4H for divergence, 1H chart uses 1D, etc.). You can also turn this off for full manual control.
• Fully Customizable Information Table: An on-screen table keeps you updated on the divergence status. You can easily adjust its Position and Size in the settings to fit your chart layout.
• Built-in Alerts: Alerts are configured for both Bullish and Bearish divergences to notify you as soon as they occur.
How to Use This Indicator
The principle is the same as any divergence strategy, but with the conviction of volume behind it.
• 🔴 Bearish Divergence: Price makes a Higher High, but the CVD makes a Lower High or an equal high. This suggests that the buying pressure is weakening and may not be strong enough to support the new price high.
• 🟢 Bullish Divergence: Price makes a Lower Low, but the CVD makes a Higher Low or an equal low. This suggests that selling pressure is exhausting and the market may be ready for a reversal.
Always use divergence signals as a confluence with your own analysis, support/resistance levels, and market structure.
Huge Thanks and Credit
This script would not exist without the brilliant and creative work of @cdikici71. The entire divergence detection engine, the visualization style, and the core logic are based on his original masterpiece, "cd_RSI_Divergence_Cx". I have simply adapted his framework to a different data source.
If you find this indicator useful, please go and show your support for his original work!
________________________________________
Disclaimer: This is a tool for analysis, not a financial advice signal service. Please use it responsibly as part of a complete trading strategy.

4 Stages of StockThis script uses 40Weekly MA to baseline larges trends in the stock. This is based on Puru's idea of 4 Stage of Stock.
Stage 1 (Basing)
Stage 2 (Advancing)
Stage 3 (Topping)
Stage 4 (Declining)
This is best viewed and understood on weekly charts.

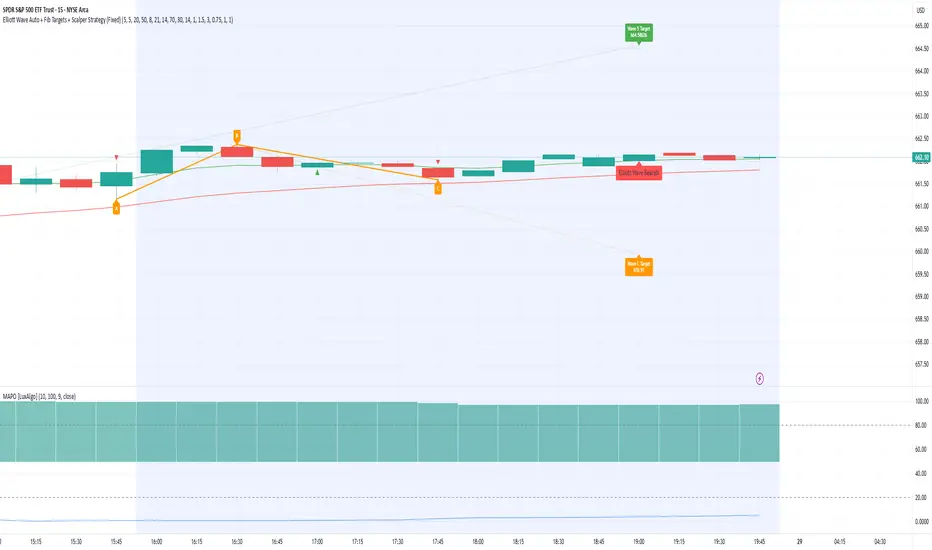
Elliott Wave Auto + Fib Targets + Scalper Strategy (Fixed)// Elliott Wave Auto + Fib Targets + Scalper Strategy
//
// Fixed by expert trader:
// - Replaced table with label-based visualization to avoid 'Column 2 is out of table bounds' error.
// - Uses label.new to display buy/sell signal counts in top-right corner, mimicking table layout.
// - Fixed array.sum() error: Replaced invalid range-based array.sum() with custom sum_array_range() function.
// - Removed barstate usage to fix 'Undeclared identifier barstate' error.
// - Replaced barstate.isconfirmed with true (process every bar).
// - Replaced barstate.isfirstconfirmed with bar_index == 0 (first bar).
// - Replaced strategy.alert with label.new for long/short entry signals (buy/sell markers).
// - Fixed array index out-of-bounds: Protected array.get() calls with size checks.
// - Fixed pyramiding: Set constant pyramiding=4 (max 5 entries); use allow_pyramiding to limit entries.
// - Fixed default_qty_value: Set constant default_qty_value=100.0; use entry_size_pct to scale qty.
// - Replaced alertcondition with labels for Elliott Wave patterns.
// - Fixed partial exits: 50% at TP1 with fixed SL, 50% at TP2 with fixed SL or trailing.
// - Fixed Elliott Wave pivot indexing for alternating H/L check.
// - Ensured proper position sizing and exit logic.
Price Deviation StrategyThis strategy getting in long position only after the price drop
The % of the drop is Determined by SMA for the first trade
The inputs of SMA and % of the drop can be adjust from the User
After that bot start taking safe trades if not take profit from the first trade
The safe trades are Determined by step down deviation % and by quantity
There is no Stop loss is not for one with small tolerance to getting under
Take profit is average price + take profit - note if you use % trailing profit back test is not realistic but is working on real time
Max Safe Trades = 15
Capital max = $30000
Doge-USDT is just a example What the Strategy Can do
Green line - take profit
Black line - Brake even with fee - adjust for exchange

Peak Support/Resistance Lines v1//@version=6
indicator("Peak Support/Resistance Lines", shorttitle="Peak S/R", overlay=true, max_lines_count=500)
// Input parameters
lookback = input.int(5, title="Lookback Period", minval=1, maxval=50)
show_resistance = input.bool(true, title="Show Resistance Lines")
show_support = input.bool(true, title="Show Support Lines")
resistance_color = input.color(color.red, title="Resistance Color")
support_color = input.color(color.green, title="Support Color")
// Function to check if current bar is a peak
is_peak() =>
ta.pivothigh(high, lookback, lookback)
// Function to check if current bar is a valley
is_valley() =>
ta.pivotlow(low, lookback, lookback)
// Main logic
if barstate.isconfirmed
// Check for resistance peaks
if show_resistance
peak_price = is_peak()
if not na(peak_price)
line.new(x1=bar_index - lookback, y1=peak_price, x2=bar_index + 50, y2=peak_price, color=resistance_color, width=1)
// Check for support valleys
if show_support
valley_price = is_valley()
if not na(valley_price)
line.new(x1=bar_index - lookback, y1=valley_price, x2=bar_index + 50, y2=valley_price, color=support_color, width=1)

Smart Money Support/Resistance — LiteSmart Money Support/Resistance — Lite
Overview & Methodology
This indicator identifies support and resistance as zones derived from concentrated buying and selling pressure, rather than relying solely on traditional swing highs/lows. Its design focuses on transparency: how data is sourced, how zones are computed, and how the on‑chart display should be interpreted.
Lower‑Timeframe (LTF) Data
The script requests Up Volume, Down Volume, and Volume Delta from a lower timeframe to expose intrabar order‑flow structure that the chart’s native timeframe cannot show. In practical terms, this lets you see where buyers or sellers briefly dominated inside the body of a higher‑timeframe bar.
bool use_custom_tf_input = input.bool(true, title="Use custom lower timeframe", tooltip="Override the automatically chosen lower timeframe for volume calculations.", group=grpVolume)
string custom_tf_input = input. Timeframe("1", title="Lower timeframe", tooltip="Lower timeframe used for up/down volume calculations (default 5 seconds).", group=grpVolume)
import TradingView/ta/10 as tvta
resolve_lower_tf(useCustom, customTF) =>
useCustom ? customTF :
timeframe.isseconds ? "1S" :
timeframe.isintraday ? "1" :
timeframe.isdaily ? "5" : "60"
get_up_down_volume(lowerTf) =>
= tvta.requestUpAndDownVolume(lowerTf)
var float upVolume = na
var float downVolume = na
var float deltaVolume = na
string lower_tf = resolve_lower_tf(use_custom_tf_input, custom_tf_input)
= get_up_down_volume(lower_tf)
upVolume := u_tmp
downVolume := d_tmp
deltaVolume := dl_tmp
• Data source: TradingView’s ta.requestUpAndDownVolume(lowerTf) via the official TA library.
• Plan capabilities: higher‑tier subscriptions unlock seconds‑based charts and allow more historical bars per chart. This expands both the temporal depth of LTF data and the precision of short‑horizon analysis, while base tiers provide minute‑level data suitable for day/short‑swing studies.
• Coverage clarity: a small on‑chart Coverage Panel reports the active lower timeframe, the number of bars covered, and the latest computed support/resistance ranges so you always know the bounds of valid LTF input.
Core Method
1) Data acquisition (LTF)
The script retrieves three series from the chosen lower timeframe:
– Up Volume (buyers)
– Down Volume (sellers)
– Delta (Up – Down)
2) Rolling window & extrema
Over a user‑defined lookback (Global Volume Period), the algorithm builds rolling arrays of completed bars and scans for extrema:
– Buyers_max / Buyers_min from Up Volume
– Sellers_max / Sellers_min from Down Volume
Only completed bars are considered; the current bar is excluded for stability.
3) Price mapping
The extrema are mapped back to their source candles to obtain price bounds:
– For “maximum” roles the algorithm uses the relevant candle highs.
– For “minimum” roles it uses the relevant candle lows.
These pairs define candidate resistance (max‑based) and support (min‑based) zones or vice versa.
4) Zone construction & minimum width
To ensure practicality on all symbols, zones enforce a minimum vertical thickness of two ticks. This prevents visually invisible or overly thin ranges on instruments with tight ticks.
5) Vertical role resolution
When both max‑ and min‑based zones exist, the script compares their midpoints. If, due to local price structure, the min‑based zone sits above the max‑based zone, display roles are swapped so the higher zone is labeled Resistance and the lower zone Support. Colors/widths are updated accordingly to keep the visual legend consistent.
6) Rendering & panel
Two horizontal lines and a filled box represent each active zone. The Coverage Panel (bottom‑right by default) prints:
– Lower‑timeframe in use
– Number of bars covered by LTF data
– Current Support and Resistance ranges
If the two zones overlap, an additional “Range Market” note is shown.
Key Inputs
• Global Volume Period: shared lookback window for the extrema search.
• Lower timeframe: user‑selectable override of the automatically resolved lower timeframe.
• Visualization toggles: independent show/hide controls and colors for maximum (resistance) and minimum (support) zones.
• Coverage Panel: enable/disable the single‑cell table and its readout.
Operational Notes
• The algorithm aligns all lookups to completed bars (no peeking). Price references are shifted appropriately to avoid using the still‑forming bar in calculations.
• Second‑based lower timeframes improve granularity for scalping and very short‑term entries. Minute‑based lower timeframes provide broader coverage for intraday and short‑swing contexts.
• Use the Coverage Panel to confirm the true extent of available LTF history on your symbol/plan before drawing conclusions from very deep lookbacks.
Visual Walkthrough
A step‑by‑step image sequence accompanies this description. Each figure demonstrates how the indicator reads LTF volume, locates extrema, builds price‑mapped zones, and updates labels/colors when vertical order requires it.
Chart Interpretation
This chart illustrates two distinct perspectives of the Smart Money Support/Resistance — Lite indicator, each derived from different lookback horizons and lower-timeframe (LTF) resolutions.
1- Short-term view (43 bars, 10-second LTF)
Using the most recent 43 completed bars with 10-second intrabar data, the algorithm detects that both maximum and minimum volume extrema fall within a narrow range. The result is a clearly identified range market: resistance between 178.15–184.55 and support between 175.02–179.38.
The Coverage Panel (bottom-right) confirms the scope of valid input: the lower timeframe used, number of bars covered, and the resulting zones. This short-term scan highlights how the indicator adapts to limited data depth, flagging sideways structure where neither side dominates.
2 - Long-term view (120 bars, 30-second LTF)
Over a wider 120-bar lookback with higher-granularity 30-second data, broader supply and demand zones emerge.
– The long-term resistance zone captures the concentration of buyers and sellers at the upper boundary of recent price history.
– The long-term support zone anchors to the opposite side of the distribution, derived from maxima and minima of both buying and selling pressure.
These zones reflect deeper structural levels where market participants previously committed significant volume.
Combined Perspective
By aligning the short-term and long-term outputs, the chart shows how the indicator distinguishes immediate consolidation (range market) from more durable support and resistance levels derived from extended history. This dual resolution approach makes clear that support and resistance are not static lines but dynamic zones, dependent on both timeframe depth and the resolution of intrabar volume data.

Order Block Volumatic FVG StrategyInspired by: Volumatic Fair Value Gaps —
License: CC BY-NC-SA 4.0 (Creative Commons Attribution–NonCommercial–ShareAlike).
This script is a non-commercial derivative work that credits the original author and keeps the same license.
What this strategy does
This turns BigBeluga’s visual FVG concept into an entry/exit strategy. It scans bullish and bearish FVG boxes, measures how deep price has mitigated into a box (as a percentage), and opens a long/short when your mitigation threshold and filters are satisfied. Risk is managed with a fixed Stop Loss % and a Trailing Stop that activates only after a user-defined profit trigger.
Additions vs. the original indicator
✅ Strategy entries based on % mitigation into FVGs (long/short).
✅ Lower-TF volume split using upticks/downticks; fallback if LTF data is missing (distributes prior bar volume by close’s position in its H–L range) to avoid NaN/0.
✅ Per-FVG total volume filter (min/max) so you can skip weak boxes.
✅ Age filter (min bars since the FVG was created) to avoid fresh/immature boxes.
✅ Bull% / Bear% share filter (the 46%/53% numbers you see inside each FVG).
✅ Optional candle confirmation and cooldown between trades.
✅ Risk management: fixed SL % + Trailing Stop with a profit trigger (doesn’t trail until your trigger is reached).
✅ Pine v6 safety: no unsupported args, no indexof/clamp/when, reverse-index deletes, guards against zero/NaN.
How a trade is decided (logic overview)
Detect FVGs (same rules as the original visual logic).
For each FVG currently intersected by the bar, compute:
Mitigation % (how deep price has entered the box).
Bull%/Bear% split (internal volume share).
Total volume (printed on the box) from LTF aggregation or fallback.
Age (bars) since the box was created.
Apply your filters:
Mitigation ≥ Long/Short threshold.
Volume between your min and max (if enabled).
Age ≥ min bars (if enabled).
Bull% / Bear% within your limits (if enabled).
(Optional) the current candle must be in trade direction (confirm).
If multiple FVGs qualify on the same bar, the strategy uses the most recent one.
Enter long/short (no pyramiding).
Exit with:
Fixed Stop Loss %, and
Trailing Stop that only starts after price reaches your profit trigger %.
Input settings (quick guide)
Mitigation source: close or high/low. Use high/low for intrabar touches; close is stricter.
Mitigation % thresholds: minimal mitigation for Long and Short.
TOTAL Volume filter: skip FVGs with too little/too much total volume (per box).
Bull/Bear share filter: require, e.g., Long only if Bull% ≥ 50; avoid Short when Bull% is high (Short Bull% max).
Age filter (bars): e.g., ≥ 20–30 bars to avoid fresh boxes.
Confirm candle: require candle direction to match the trade.
Cooldown (bars): minimum bars between entries.
Risk:
Stop Loss % (fixed from entry price).
Activate trailing at +% profit (the trigger).
Trailing distance % (the trailing gap once active).
Lower-TF aggregation:
Auto: TF/Divisor → picks 1/3/5m automatically.
Fixed: choose 1/3/5/15m explicitly.
If LTF can’t be fetched, fallback allocates prior bar’s volume by its close position in the bar’s H–L.
Suggested starting presets (you should optimize per market)
Mitigation: 60–80% for both Long/Short.
Bull/Bear share:
Long: Bull% ≥ 50–70, Bear% ≤ 100.
Short: Bull% ≤ 60 (avoid shorting into strong support), Bear% ≥ 0–70 as you prefer.
Age: ≥ 20–30 bars.
Volume: pick a min that filters noise for your symbol/timeframe.
Risk: SL 4–6%, trailing trigger 1–2%, distance 1–2% (crypto example).
Set slippage/fees in Strategy Properties.
Notes, limitations & best practices
Data differences: The LTF split uses request.security_lower_tf. If the exchange/data feed has sparse LTF data, the fallback kicks in (it’s deliberate to avoid NaNs but is a heuristic).
Real-time vs backtest: The current bar can update until close; results on historical bars use closed data. Use “Bar Replay” to understand intrabar effects.
No pyramiding: Only one position at a time. Modify pyramiding in the header if you need scaling.
Assets: For spot/crypto, TradingView “volume” is exchange volume; in some markets it may be tick volume—interpret filters accordingly.
Risk disclosure: Past performance ≠ future results. Use appropriate position sizing and risk controls; this is not financial advice.
Credits
Visual FVG concept and original implementation: BigBeluga.
This derivative strategy adds entry/exit logic, volume/age/share filters, robust LTF handling, and risk management while preserving the original spirit.
License remains CC BY-NC-SA 4.0 (non-commercial, attribution required, share-alike).

Delta Volume Signals by Claudio [hapharmonic]Modifications:
Percentages without decimals.
I replaced the 'Current Volume' row with two boxes: "Δ Vol" and its value, which changes color depending on the direction of the bearish/bullish candle.
Signals can change color in the settings.
Box spacing so the table doesn't constantly change size.
To be modified:
The Net Volume sign shouldn't change to negative when the candle is red.
If anyone does this, let me know...
claudio.ventola@hotmail.com
Best regards!

Multi-Oscillator Adaptive Kernel with MomentumMulti-Oscillator Adaptive Kernel w. Momentum
An adaptation of the indicator by AlphaAlgos : Multi-Oscillator-Adaptive-Kernel (MOAK) with Divergence . Please find the description of the indicator in the above link.
Apart from adding labels to show trend/momentum changes, the following changes have been made to the original script:
1. Sensitivity is used in the computation to scale the fast MOAK signal,
2. Selection between two indicator modes:
Trending - (the original script method) assesses whether smoothed MOAK is above/below 0 - for up/down trends respectively.
Momentum - assesses whether the fast MOAK signal is above/below the smoothed MOAK, and can be used to indicate potential trend reversals as momentum of current trend fades.
FSVZO | Lyro RSFSVZO | Lyro RS
This script is a technical analysis tool called the FSVZO, or Fourier Smoothed Volume Zone Oscillator. It is designed to analyze market momentum and trend strength by combining price and volume data with advanced smoothing techniques. The goal is to help identify potential trends, overbought/oversold conditions, and divergence signals in a clear visual format.
Understanding the Indicator's Components
The indicator plots a main oscillator line and several supporting elements on a separate pane below the chart.
The Main Oscillator: This is the primary, colored wave. Its movement and color are key to interpretation.
Trend Direction: The color shifts between bullish and bearish tones based on the momentum of the oscillator. This provides a quick visual reference for the prevailing short-term trend.
Key Levels: Horizontal lines mark significant levels such as +60, +85, -60, and -85. Movements above +60 or below -60 can indicate strong momentum, while approaches to the extreme levels (+85/-85) may suggest overbought or oversold conditions.
Divergence Detection: The indicator can plot labels ("ℝ" for Regular, "ℍ" for Hidden) on the oscillator to signal potential divergences. These occur when the indicator's direction differs from the price action on the main chart and can sometimes foreshadow reversals or continuations.
Moving Average (MA): A central moving average line, based on the oscillator, helps to smooth out the data further and can act as a dynamic support or resistance level within the indicator pane.
White Noise Filter (Optional): This feature displays a histogram that represents market noise. It can be toggled on or off. Analyzing the histogram's behavior may provide additional context on the stability or volatility of the current trend.
Dynamic Background: The background of the indicator pane can change color to highlight periods where the momentum is particularly strong, based on the position of the moving average.
Suggested Use and Interpretation
Traders might use this indicator in several ways:
Trend Identification: Observe the color and position of the main oscillator. A predominantly bullish-colored oscillator above the zero line may suggest an upward trend, while a bearish-colored one below zero may suggest a downward trend.
Signal Confirmation: Look for the oscillator to cross key levels (like +/-40 or +/-60) in the direction of a suspected trend as a confirmation signal.
Divergence Analysis: When the price makes a new high or low that is not confirmed by a new high or low on the FSVZO oscillator (a divergence), it can be a warning of potential weakness in the trend. The "ℝ" and "ℍ" labels help to identify these scenarios.
Extreme Readings: Readings near the +85 or -85 levels can indicate that a price move may be overextended, which could precede a pause or reversal.
Customization Options
The indicator includes settings groups that allow you to adjust its behavior and appearance:
FSVZO Settings: Adjust parameters like Length and Sensitivity to make the oscillator more or less responsive to market movements.
Signals & Display: Modify visual aspects such as Smooth Length and Glowing Amount, or toggle features like the dynamic background on and off.
Colors: Choose from several pre-set color palettes to suit your visual preferences.
⚠️Disclaimer
This indicator is a tool for technical analysis and does not provide guaranteed results. It should be used in conjunction with other analysis methods and proper risk management practices. The creators of this indicator are not responsible for any financial decisions made based on its signals.

Alpha - Multi-Asset Adaptive Trading Strategy# Alpha - Multi-Asset Adaptive Trading Strategy
Overview
Alpha is a comprehensive trading strategy that combines multiple technical analysis components with pre-optimized settings for over 70 different trading instruments across cryptocurrencies, forex, and stocks. The strategy employs an adaptive approach using modified trend detection algorithms, dynamic support/resistance zones, and multi-timeframe confirmation.
Key Features & Originality
1. Adaptive Trend Detection System
- Modified trend-following algorithm with amplitude-based channel deviation
- Dynamic channel width adjustment based on ATR (Average True Range)
- Dual-layer trend confirmation using both price action and momentum indicators
2. Pre-Configured Asset Optimization
The strategy includes carefully backtested parameter sets for:
- **Cryptocurrencies**: BTC, ETH, and 40+ altcoin pairs
- **Forex Pairs**: Major and minor currency pairs
- **Stocks**: TSLA, AAPL, GOOG
- **Commodities**: Gold, Silver, Platinum
- Each configuration is optimized for specific timeframes (5m, 15m, 30m, 45m, 1h)
3. Advanced Risk Management
- Multiple take profit levels (4 targets with customizable position sizing)
- Dynamic stop-loss options (ATR-based or percentage-based)
- Position size allocation across profit targets (default: 30%, 30%, 30%, 10%)
4. Multi-Timeframe Analysis Dashboard
- Real-time analysis across 4 configurable timeframes
- Comprehensive performance metrics display
- Visual representation of current market conditions
5. Market Condition Filtering
- RSI-based trend strength filtering
- ATR-based volatility filtering
- Sideways market detection to avoid choppy conditions
- Customizable filter combinations (ATR only, RSI only, both, or disabled)
How to Use
Initial Setup
1. **Select Asset Configuration**: Choose your trading pair from the "Strategies" dropdown menu
2. **Enable Strategy**: Enter "Alpha" in the code confirmation field
3. **Adjust Timeframe**: Match your chart timeframe to the selected strategy configuration
Parameter Customization
- **Trendline Settings**: Adjust amplitude and channel deviation for sensitivity
- **TP/SL Method**: Choose between ATR-based or percentage-based targets
- **Filtering Options**: Select appropriate market filters for your trading style
- **Backtest Period**: Set the number of days for strategy testing (max 60)
Signal Interpretation
- **BUY/SELL Labels**: Primary entry signals based on trend changes
- **Support/Resistance Zones**: Visual zones showing key price levels
- **Dashboard**: Real-time display of position status, targets, and performance metrics
Important Considerations
Limitations and Warnings
- **Backtesting Period**: Results shown are based on historical data from the specified backtest period
- **No Guarantee**: Past performance does not guarantee future results
- **Market Conditions**: Strategy performance varies with market volatility and trending conditions
- **Repainting**: Some signals may repaint if "Wait For Confirmed Bar" is disabled
Risk Warnings
- The pre-configured settings are starting points and may require adjustment for current market conditions
- Always use appropriate position sizing and risk management
- Test thoroughly on demo accounts before live trading
- Monitor and adjust parameters regularly as market dynamics change
Technical Components
Core Indicators Used
- Modified trend detection with amplitude-based channels
- RSI (Relative Strength Index) for momentum confirmation
- ATR (Average True Range) for volatility measurement
- Support/Resistance detection using pivot points
- Bollinger Band variant for trend confirmation
Alert Functionality
The strategy includes comprehensive alert options for:
- Entry signals (long and short)
- Take profit levels (TP1, TP2, TP3, TP4)
- Stop loss triggers
- Integration with trading bots via webhook messages
Recommended Usage
Best Practices
1. Start with the pre-configured settings for your chosen asset
2. Run backtests over different time periods to verify performance
3. Use the dashboard to monitor real-time strategy performance
4. Adjust filters based on current market conditions
5. Always use stop losses and proper risk management
Timeframe Recommendations
- **Short-Term**: Use 5m, 15m configurations for scalping
- **Mid-Term**: Use 30m, 45m configurations for day trading
- **Long-Term**: Use 1h configurations for swing trading
Updates and Support
The strategy parameters are regularly reviewed and optimized. Users should periodically check for updates to ensure they have the latest configurations.
Disclaimer
This strategy is for educational and informational purposes only. Trading involves substantial risk of loss. Users should conduct their own research and consider their financial situation before trading. The author is not responsible for any trading losses incurred using this strategy.

Trend Fib Zone Bounce (TFZB) [KedArc Quant]Description:
Trend Fib Zone Bounce (TFZB) trades with the latest confirmed Supply/Demand zone using a single, configurable Fib pullback (0.3/0.5/0.6). Trade only in the direction of the most recent zone and use a single, configurable fib level for pullback entries.
• Detects market structure via confirmed swing highs/lows using a rolling window.
• Draws Supply/Demand zones (bearish/bullish rectangles) from the latest MSS (CHOCH or BOS) event.
• Computes intra zone Fib guide rails and keeps them extended in real time.
• Triggers BUY only inside bullish zones and SELL only inside bearish zones when price touches the selected fib and closes back beyond it (bounce confirmation).
• Optional labels print BULL/BEAR + fib next to the triangle markers.
What it does
Finds structure using confirmed swing highs/lows (you choose the confirmation length).
Builds the latest zone (bullish = demand, bearish = supply) after a CHOCH/BOS event.
Draws intra-zone “guide rails” (Fib lines) and extends them live.
Signals only with the trend of that zone:
BUY inside a bullish zone when price tags the selected Fib and closes back above it.
SELL inside a bearish zone when price tags the selected Fib and closes back below it.
Optional labels print BULL/BEAR + Fib next to triangles for quick context
Why this is different
Most “zone + fib + signal” tools bolt together several indicators, or fire counter-trend signals because they don’t fully respect structure. TFZB is intentionally minimal:
Single bias source: the latest confirmed zone defines direction; nothing else overrides it.
Single entry rule: one Fib bounce (0.3/0.5/0.6 selectable) inside that zone—no counter-trend trades by design.
Clean visuals: you can show only the most recent zone, clamp overlap, and keep just the rails that matter.
Deterministic & transparent: every plot/label comes from the code you see—no external series or hidden smoothing
How it helps traders
Cuts decision noise: you always know the bias and the only entry that matters right now.
Forces discipline: if price isn’t inside the active zone, you don’t trade.
Adapts to volatility: pick 0.3 in strong trends, 0.5 as the default, 0.6 in chop.
Non-repainting zones: swings are confirmed after Structure Length bars, then used to build zones that extend forward (they don’t “teleport” later)
How it works (details)
*Structure confirmation
A swing high/low is only confirmed after Structure Length bars have elapsed; the dot is plotted back on the original bar using offset. Expect a confirmation delay of about Structure Length × timeframe.
*Zone creation
After a CHOCH/BOS (momentum shift / break of prior swing), TFZB draws the new Supply/Demand zone from the swing anchors and sets it active.
*Fib guide rails
Inside the active zone TFZB projects up to five Fib lines (defaults: 0.3 / 0.5 / 0.7) and extends them as time passes.
*Entry logic (with-trend only)
BUY: bar’s low ≤ fib and close > fib inside a bullish zone.
SELL: bar’s high ≥ fib and close < fib inside a bearish zone.
*Optionally restrict to one signal per zone to avoid over-trading.
(Optional) Aggressive confirm-bar entry
When do the swing dots print?
* The code confirms a swing only after `structureLen` bars have elapsed since that candidate high/low.
* On a 5-min chart with `structureLen = 10`, that’s about 50 minutes later.
* When the swing confirms, the script plots the dot back on the original bar (via `offset = -structureLen`). So you *see* the dot on the old bar, but it only appears on the chart once the confirming bar arrives.
> Practical takeaway: expect swing markers to appear roughly `structureLen × timeframe` later. Zones and signals are built from those confirmed swings.
Best timeframe for this Indicator
Use the timeframe that matches your holding period and the noise level of the instrument:
* Intraday :
* 5m or 15m are the sweet spots.
* Suggested `structureLen`:
* 5m: 10–14 (confirmation delay \~50–70 min)
* 15m: 8–10 (confirmation delay \~2–2.5 hours)
* Keep Entry Fib at 0.5 to start; try 0.3 in strong trends, 0.6 in chop.
* Tip: avoid the first 10–15 minutes after the open; let the initial volatility set the early structure.
* Swing/overnight:
* 1h or 4h.
* `structureLen`:
* 1h: 6–10 (6–10 hours confirmation)
* 4h: 5–8 (20–32 hours confirmation)
* 1m scalping: not recommended here—the confirmation lag relative to the noise makes zones less reliable.
Inputs (all groups)
Structure
• Show Swing Points (structureTog)
o Plots small dots on the bar where a swing point is confirmed (offset back by Structure Length).
• Structure Length (structureLen)
o Lookback used to confirm swing highs/lows and determine local structure. Higher = fewer, stronger swings; lower = more reactive.
Zones
• Show Last (zoneDispNum)
o Maximum number of zones kept on the chart when Display All Zones is off.
• Display All Zones (dispAll)
o If on, ignores Show Last and keeps all zones/levels.
• Zone Display (zoneFilter): Bullish Only / Bearish Only / Both
o Filters which zone types are drawn and eligible for signals.
• Clean Up Level Overlap (noOverlap)
o Prevents fib lines from overlapping when a new zone starts near the previous one (clamps line start/end times for readability).
Fib Levels
Each row controls whether a fib is drawn and how it looks:
• Toggle (f1Tog…f5Tog): Show/hide a given fib line.
• Level (f1Lvl…f5Lvl): Numeric ratio in . Defaults active: 0.3, 0.5, 0.7 (0 and 1 off by default).
• Line Style (f1Style…f5Style): Solid / Dashed / Dotted.
• Bull/Bear Colors (f#BullColor, f#BearColor): Per-fib color in bullish vs bearish zones.
Style
• Structure Color: Dot color for confirmed swing points.
• Bullish Zone Color / Bearish Zone Color: Rectangle fills (transparent by default).
Signals
• Entry Fib for Signals (entryFibSel): Choose 0.3, 0.5 (default), or 0.6 as the trigger line.
• Show Buy/Sell Signals (showSignals): Toggles triangle markers on/off.
• One Signal Per Zone (oneSignalPerZone): If on, suppresses additional entries within the same zone after the first trigger.
• Show Signal Text Labels (Bull/Bear + Fib) (showSignalLabels): Adds a small label next to each triangle showing zone bias and the fib used (e.g., BULL 0.5 or BEAR 0.3).
How TFZB decides signals
With trend only:
• BUY
1. Latest active zone is bullish.
2. Current bar’s close is inside the zone (between top and bottom).
3. The bar’s low ≤ selected fib and it closes > selected fib (bounce).
• SELL
1. Latest active zone is bearish.
2. Current bar’s close is inside the zone.
3. The bar’s high ≥ selected fib and it closes < selected fib.
Markers & labels
• BUY: triangle up below the bar; optional label “BULL 0.x” above it.
• SELL: triangle down above the bar; optional label “BEAR 0.x” below it.
Right-Panel Swing Log (Table)
What it is
A compact, auto-updating log of the most recent Swing High/Low events, printed in the top-right of the chart.
It helps you see when a pivot formed, when it was confirmed, and at what price—so you know the earliest bar a zone-based signal could have appeared.
Columns
Type – Swing High or Swing Low.
Date – Calendar date of the swing bar (follows the chart’s timezone).
Swing @ – Time of the original swing bar (where the dot is drawn).
Confirm @ – Time of the bar that confirmed that swing (≈ Structure Length × timeframe after the swing). This is also the earliest moment a new zone/entry can be considered.
Price – The swing price (high for SH, low for SL).
Why it’s useful
Clarity on repaint/confirmation: shows the natural delay between a swing forming and being usable—no guessing.
Planning & journaling: quick reference of today’s pivots and prices for notes/backtesting.
Scanning intraday: glance to see if you already have a confirmed zone (and therefore valid fib-bounce entries), or if you’re still waiting.
Context for signals: if a fib-bounce triangle appears before the time listed in Confirm @, it’s not a valid trade (you were too early).
Settings (Inputs → Logging)
Log swing times / Show table – turn the table on/off.
Rows to keep – how many recent entries to display.
Show labels on swing bar – optional tags on the chart (“Swing High 11:45”, “Confirm SH 14:15”) that match the table.
Recommended defaults
• Structure Length: 10–20 for intraday; 20–40 for swing.
• Entry Fib for Signals: 0.5 to start; try 0.3 in stronger trends and 0.6 in choppier markets.
• One Signal Per Zone: ON (prevents over trading).
• Zone Display: Both.
• Fib Lines: Keep 0.3/0.5/0.7 on; turn on 0 and 1 only if you need anchors.
Alerts
Two alert conditions are available:
• BUY signal – fires when a with trend bullish bounce at the selected fib occurs inside a bullish zone.
• SELL signal – fires when a with trend bearish bounce at the selected fib occurs inside a bearish zone.
Create alerts from the chart’s Alerts panel and select the desired condition. Use Once Per Bar Close to avoid intrabar flicker.
Notes & tips
• Swing dots are confirmed only after Structure Length bars, so they plot back in time; zones built from these confirmed swings do not repaint (though they extend as new bars form).
• If you don’t see a BUY where you expect one, check: (1) Is the active zone bullish? (2) Did the candle’s low actually pierce the selected fib and close above it? (3) Is One Signal Per Zone suppressing a second entry?
• You can hide visual clutter by reducing Show Last to 1–3 while keeping Display All Zones off.
Glossary
• CHOCH (Change of Character): A shift where price breaks beyond the last opposite swing while local momentum flips.
• BOS (Break of Structure): A cleaner break beyond the prior swing level in the current momentum direction.
• MSS: Either CHOCH or BOS – any event that spawns a new zone.
Extension ideas (optional)
• Add fib extensions (1.272 / 1.618) for target lines.
• Zone quality score using ATR normalization to filter weak impulses.
• HTF filter to only accept zones aligned with a higher timeframe trend.
⚠️ Disclaimer This script is provided for educational purposes only.
Past performance does not guarantee future results.
Trading involves risk, and users should exercise caution and use proper risk management when applying this strategy.

BOCS Channel Scalper Indicator - Mean Reversion Alert System# BOCS Channel Scalper Indicator - Mean Reversion Alert System
## WHAT THIS INDICATOR DOES:
This is a mean reversion trading indicator that identifies consolidation channels through volatility analysis and generates alert signals when price enters entry zones near channel boundaries. **This indicator version is designed for manual trading with comprehensive alert functionality.** Unlike automated strategies, this tool sends notifications (via popup, email, SMS, or webhook) when trading opportunities occur, allowing you to manually review and execute trades. The system assumes price will revert to the channel mean, identifying scalp opportunities as price reaches extremes and preparing to bounce back toward center.
## INDICATOR VS STRATEGY - KEY DISTINCTION:
**This is an INDICATOR with alerts, not an automated strategy.** It does not execute trades automatically. Instead, it:
- Displays visual signals on your chart when entry conditions are met
- Sends customizable alerts to your device/email when opportunities arise
- Shows TP/SL levels for reference but does not place orders
- Requires you to manually enter and exit positions based on signals
- Works with all TradingView subscription levels (alerts included on all plans)
**For automated trading with backtesting**, use the strategy version. For manual control with notifications, use this indicator version.
## ALERT CAPABILITIES:
This indicator includes four distinct alert conditions that can be configured independently:
**1. New Channel Formation Alert**
- Triggers when a fresh BOCS channel is identified
- Message: "New BOCS channel formed - potential scalp setup ready"
- Use this to prepare for upcoming trading opportunities
**2. Long Scalp Entry Alert**
- Fires when price touches the long entry zone
- Message includes current price, calculated TP, and SL levels
- Notification example: "LONG scalp signal at 24731.75 | TP: 24743.2 | SL: 24716.5"
**3. Short Scalp Entry Alert**
- Fires when price touches the short entry zone
- Message includes current price, calculated TP, and SL levels
- Notification example: "SHORT scalp signal at 24747.50 | TP: 24735.0 | SL: 24762.75"
**4. Any Entry Signal Alert**
- Combined alert for both long and short entries
- Use this if you want a single alert stream for all opportunities
- Message: "BOCS Scalp Entry: at "
**Setting Up Alerts:**
1. Add indicator to chart and configure settings
2. Click the Alert (⏰) button in TradingView toolbar
3. Select "BOCS Channel Scalper" from condition dropdown
4. Choose desired alert type (Long, Short, Any, or Channel Formation)
5. Set "Once Per Bar Close" to avoid false signals during bar formation
6. Configure delivery method (popup, email, webhook for automation platforms)
7. Save alert - it will fire automatically when conditions are met
**Alert Message Placeholders:**
Alerts use TradingView's dynamic placeholder system:
- {{ticker}} = Symbol name (e.g., NQ1!)
- {{close}} = Current price at signal
- {{plot_1}} = Calculated take profit level
- {{plot_2}} = Calculated stop loss level
These placeholders populate automatically, creating detailed notification messages without manual configuration.
## KEY DIFFERENCE FROM ORIGINAL BOCS:
**This indicator is designed for traders seeking higher trade frequency.** The original BOCS indicator trades breakouts OUTSIDE channels, waiting for price to escape consolidation before entering. This scalper version trades mean reversion INSIDE channels, entering when price reaches channel extremes and betting on a bounce back to center. The result is significantly more trading opportunities:
- **Original BOCS**: 1-3 signals per channel (only on breakout)
- **Scalper Indicator**: 5-15+ signals per channel (every touch of entry zones)
- **Trade Style**: Mean reversion vs trend following
- **Hold Time**: Seconds to minutes vs minutes to hours
- **Best Markets**: Ranging/choppy conditions vs trending breakouts
This makes the indicator ideal for active day traders who want continuous alert opportunities within consolidation zones rather than waiting for breakout confirmation. However, increased signal frequency also means higher potential commission costs and requires disciplined trade selection when acting on alerts.
## TECHNICAL METHODOLOGY:
### Price Normalization Process:
The indicator normalizes price data to create consistent volatility measurements across different instruments and price levels. It calculates the highest high and lowest low over a user-defined lookback period (default 100 bars). Current close price is normalized using: (close - lowest_low) / (highest_high - lowest_low), producing values between 0 and 1 for standardized volatility analysis.
### Volatility Detection:
A 14-period standard deviation is applied to the normalized price series to measure price deviation from the mean. Higher standard deviation values indicate volatility expansion; lower values indicate consolidation. The indicator uses ta.highestbars() and ta.lowestbars() to identify when volatility peaks and troughs occur over the detection period (default 14 bars).
### Channel Formation Logic:
When volatility crosses from a high level to a low level (ta.crossover(upper, lower)), a consolidation phase begins. The indicator tracks the highest and lowest prices during this period, which become the channel boundaries. Minimum duration of 10+ bars is required to filter out brief volatility spikes. Channels are rendered as box objects with defined upper and lower boundaries, with colored zones indicating entry areas.
### Entry Signal Generation:
The indicator uses immediate touch-based entry logic. Entry zones are defined as a percentage from channel edges (default 20%):
- **Long Entry Zone**: Bottom 20% of channel (bottomBound + channelRange × 0.2)
- **Short Entry Zone**: Top 20% of channel (topBound - channelRange × 0.2)
Long signals trigger when candle low touches or enters the long entry zone. Short signals trigger when candle high touches or enters the short entry zone. Visual markers (arrows and labels) appear on chart, and configured alerts fire immediately.
### Cooldown Filter:
An optional cooldown period (measured in bars) prevents alert spam by enforcing minimum spacing between consecutive signals. If cooldown is set to 3 bars, no new long alert will fire until 3 bars after the previous long signal. Long and short cooldowns are tracked independently, allowing both directions to signal within the same period.
### ATR Volatility Filter:
The indicator includes a multi-timeframe ATR filter to avoid alerts during low-volatility conditions. Using request.security(), it fetches ATR values from a specified timeframe (e.g., 1-minute ATR while viewing 5-minute charts). The filter compares current ATR to a user-defined minimum threshold:
- If ATR ≥ threshold: Alerts enabled
- If ATR < threshold: No alerts fire
This prevents notifications during dead zones where mean reversion is unreliable due to insufficient price movement. The ATR status is displayed in the info table with visual confirmation (✓ or ✗).
### Take Profit Calculation:
Two TP methods are available:
**Fixed Points Mode**:
- Long TP = Entry + (TP_Ticks × syminfo.mintick)
- Short TP = Entry - (TP_Ticks × syminfo.mintick)
**Channel Percentage Mode**:
- Long TP = Entry + (ChannelRange × TP_Percent)
- Short TP = Entry - (ChannelRange × TP_Percent)
Default 50% targets the channel midline, a natural mean reversion target. These levels are displayed as visual lines with labels and included in alert messages for reference when manually placing orders.
### Stop Loss Placement:
Stop losses are calculated just outside the channel boundary by a user-defined tick offset:
- Long SL = ChannelBottom - (SL_Offset_Ticks × syminfo.mintick)
- Short SL = ChannelTop + (SL_Offset_Ticks × syminfo.mintick)
This logic assumes channel breaks invalidate the mean reversion thesis. SL levels are displayed on chart and included in alert notifications as suggested stop placement.
### Channel Breakout Management:
Channels are removed when price closes more than 10 ticks outside boundaries. This tolerance prevents premature channel deletion from minor breaks or wicks, allowing the mean reversion setup to persist through small boundary violations.
## INPUT PARAMETERS:
### Channel Settings:
- **Nested Channels**: Allow multiple overlapping channels vs single channel
- **Normalization Length**: Lookback for high/low calculation (1-500, default 100)
- **Box Detection Length**: Period for volatility detection (1-100, default 14)
### Scalping Settings:
- **Enable Long Scalps**: Toggle long alert generation on/off
- **Enable Short Scalps**: Toggle short alert generation on/off
- **Entry Zone % from Edge**: Size of entry zone (5-50%, default 20%)
- **SL Offset (Ticks)**: Distance beyond channel for stop (1+, default 5)
- **Cooldown Period (Bars)**: Minimum spacing between alerts (0 = no cooldown)
### ATR Filter:
- **Enable ATR Filter**: Toggle volatility filter on/off
- **ATR Timeframe**: Source timeframe for ATR (1, 5, 15, 60 min, etc.)
- **ATR Length**: Smoothing period (1-100, default 14)
- **Min ATR Value**: Threshold for alert enablement (0.1+, default 10.0)
### Take Profit Settings:
- **TP Method**: Choose Fixed Points or % of Channel
- **TP Fixed (Ticks)**: Static distance in ticks (1+, default 30)
- **TP % of Channel**: Dynamic target as channel percentage (10-100%, default 50%)
### Appearance:
- **Show Entry Zones**: Toggle zone labels on channels
- **Show Info Table**: Display real-time indicator status
- **Table Position**: Corner placement (Top Left/Right, Bottom Left/Right)
- **Long Color**: Customize long signal color (default: darker green for readability)
- **Short Color**: Customize short signal color (default: red)
- **TP/SL Colors**: Customize take profit and stop loss line colors
- **Line Length**: Visual length of TP/SL reference lines (5-200 bars)
## VISUAL INDICATORS:
- **Channel boxes** with semi-transparent fill showing consolidation zones
- **Colored entry zones** labeled "LONG ZONE ▲" and "SHORT ZONE ▼"
- **Entry signal arrows** below/above bars marking long/short alerts
- **TP/SL reference lines** with emoji labels (⊕ Entry, 🎯 TP, 🛑 SL)
- **Info table** showing channel status, last signal, entry/TP/SL prices, risk/reward ratio, and ATR filter status
- **Visual confirmation** when alerts fire via on-chart markers synchronized with notifications
## HOW TO USE:
### For 1-3 Minute Scalping with Alerts (NQ/ES):
- ATR Timeframe: "1" (1-minute)
- ATR Min Value: 10.0 (for NQ), adjust per instrument
- Entry Zone %: 20-25%
- TP Method: Fixed Points, 20-40 ticks
- SL Offset: 5-10 ticks
- Cooldown: 2-3 bars to reduce alert spam
- **Alert Setup**: Configure "Any Entry Signal" for combined long/short notifications
- **Execution**: When alert fires, verify chart visuals, then manually place limit order at entry zone with provided TP/SL levels
### For 5-15 Minute Day Trading with Alerts:
- ATR Timeframe: "5" or match chart
- ATR Min Value: Adjust to instrument (test 8-15 for NQ)
- Entry Zone %: 20-30%
- TP Method: % of Channel, 40-60%
- SL Offset: 5-10 ticks
- Cooldown: 3-5 bars
- **Alert Setup**: Configure separate "Long Scalp Entry" and "Short Scalp Entry" alerts if you trade directionally based on bias
- **Execution**: Review channel structure on alert, confirm ATR filter shows ✓, then enter manually
### For 30-60 Minute Swing Scalping with Alerts:
- ATR Timeframe: "15" or "30"
- ATR Min Value: Lower threshold for broader market
- Entry Zone %: 25-35%
- TP Method: % of Channel, 50-70%
- SL Offset: 10-15 ticks
- Cooldown: 5+ bars or disable
- **Alert Setup**: Use "New Channel Formation" to prepare for setups, then "Any Entry Signal" for execution alerts
- **Execution**: Larger timeframes allow more analysis time between alert and entry
### Webhook Integration for Semi-Automation:
- Configure alert webhook URL to connect with platforms like TradersPost, TradingView Paper Trading, or custom automation
- Alert message includes all necessary order parameters (direction, entry, TP, SL)
- Webhook receives structured data when signal fires
- External platform can auto-execute based on alert payload
- Still maintains manual oversight vs full strategy automation
## USAGE CONSIDERATIONS:
- **Manual Discipline Required**: Alerts provide opportunities but execution requires judgment. Not all alerts should be taken - consider market context, trend, and channel quality
- **Alert Timing**: Alerts fire on bar close by default. Ensure "Once Per Bar Close" is selected to avoid false signals during bar formation
- **Notification Delivery**: Mobile/email alerts may have 1-3 second delay. For immediate execution, use desktop popups or webhook automation
- **Cooldown Necessity**: Without cooldown, rapidly touching price action can generate excessive alerts. Start with 3-bar cooldown and adjust based on alert volume
- **ATR Filter Impact**: Enabling ATR filter dramatically reduces alert count but improves quality. Track filter status in info table to understand when you're receiving fewer alerts
- **Commission Awareness**: High alert frequency means high potential trade count. Calculate if your commission structure supports frequent scalping before acting on all alerts
## COMPATIBLE MARKETS:
Works on any instrument with price data including stock indices (NQ, ES, YM, RTY), individual stocks, forex pairs (EUR/USD, GBP/USD), cryptocurrency (BTC, ETH), and commodities. Volume-based features are not included in this indicator version. Multi-timeframe ATR requires higher-tier TradingView subscription for request.security() functionality on timeframes below chart timeframe.
## KNOWN LIMITATIONS:
- **Indicator does not execute trades** - alerts are informational only; you must manually place all orders
- **Alert delivery depends on TradingView infrastructure** - delays or failures possible during platform issues
- **No position tracking** - indicator doesn't know if you're in a trade; you must manage open positions independently
- **TP/SL levels are reference only** - you must manually set these on your broker platform; they are not live orders
- **Immediate touch entry can generate many alerts** in choppy zones without adequate cooldown
- **Channel deletion at 10-tick breaks** may be too aggressive or lenient depending on instrument tick size
- **ATR filter from lower timeframes** requires TradingView Premium/Pro+ for request.security()
- **Mean reversion logic fails** in strong breakout scenarios - alerts will fire but trades may hit stops
- **No partial closing capability** - full position management is manual; you determine scaling out
- **Alerts do not account for gaps** or overnight price changes; morning alerts may be stale
## RISK DISCLOSURE:
Trading involves substantial risk of loss. This indicator provides signals for educational and informational purposes only and does not constitute financial advice. Past performance does not guarantee future results. Mean reversion strategies can experience extended drawdowns during trending markets. Alerts are not guaranteed to be profitable and should be combined with your own analysis. Stop losses may not fill at intended levels during extreme volatility or gaps. Never trade with capital you cannot afford to lose. Consider consulting a licensed financial advisor before making trading decisions. Always verify alerts against current market conditions before executing trades manually.
## ACKNOWLEDGMENT & CREDITS:
This indicator is built upon the channel detection methodology created by **AlgoAlpha** in the "Smart Money Breakout Channels" indicator. Full credit and appreciation to AlgoAlpha for pioneering the normalized volatility approach to identifying consolidation patterns. The core channel formation logic using normalized price standard deviation is AlgoAlpha's original contribution to the TradingView community.
Enhancements to the original concept include: mean reversion entry logic (vs breakout), immediate touch-based alert generation, comprehensive alert condition system with customizable notifications, multi-timeframe ATR volatility filtering, cooldown period for alert management, dual TP methods (fixed points vs channel percentage), visual TP/SL reference lines, and real-time status monitoring table. This indicator version is specifically designed for manual traders who prefer alert-based decision making over automated execution.

Best MA Finder: Sharpe/Sortino ScannerThis script, Best MA Finder: Sharpe/Sortino Scanner, is a tool designed to identify the moving average (SMA or EMA) that best acts as a dynamic trend threshold on a chart, based on risk-adjusted historical performance. It scans a wide range of MA lengths (SMA or EMA) and selects the one whose simple price vs MA crossover delivered the strongest results using either the Sharpe ratio or the Sortino ratio. Reading it is intuitive: when price spent time above the selected MA, conditions were on average more favorable in the backtest; below, less favorable. It is a trend and risk gauge, not an overbought or oversold signal.
What it does:
- Runs individual long-only crossover backtests for many MA lengths across short to very long horizons.
- For each length, measures the total number of trades, the annualized Sharpe ratio, and the annualized Sortino ratio.
- Uses the chosen metric value (Sharpe or Sortino) as the score to rank candidates.
- Applies a minimum trade filter to discard statistically weak results.
- Optionally applies a local stability filter to prefer a length that also outperforms its close neighbors by at least a small margin.
- Selects the optimal MA and displays it on the chart with a concise summary table.
How to use it:
- Choose MA type: SMA or EMA.
- Choose the metric: Sharpe or Sortino.
- Set the minimum trade count to filter out weak samples.
- Select the risk-free mode:
Auto: uses a short-term risk-free rate for USD-priced symbols when available.
Manual: you provide a risk-free ticker.
None: no risk-free rate.
- Optionally enable stability controls: neighbor radius and epsilon.
- Toggle the on-chart summary table as needed.
On-chart output:
- The selected optimal MA is plotted.
- The optional table shows MA length, number of trades, chosen metric value annualized, and the annual risk-free rate used.
Key features:
- Risk-adjusted optimization via Sharpe or Sortino for fair, comparable assessment.
- Broad MA scan with SMA and EMA support.
- Optional stability filter to avoid one-off spikes.
- Clear and auditable presentation directly on the chart.
Use cases:
- Traders who want a defensible, data-driven trend threshold without manual trial and error.
- Swing and trend-following workflows across timeframes and asset classes.
- Quick SMA vs EMA comparisons using risk-adjusted results.
Limitations:
- Not a full trading strategy with position sizing, costs, funding, slippage, or stops.
- Long-only, one position at a time.
- Discrete set of MA lengths, not a continuous optimizer.
- Requires sufficient price history and, if used, a reliable risk-free series.
This script is open-source and built from original logic. It does not replicate closed-source scripts or reuse significant external components.

Z-Score Trend Channels [BackQuant]Z-Score Trend Channels
A self-contained price-statistics framework that turns a rolling z-score into price channels, bias states, and trade markers. Run either trend-following or mean-reversion from the same tool with clear, on-chart context.
What it is
A rolling statistical map that measures how far price is from its recent average in standard-deviation units (z-score).
Adaptive channels drawn in price space from fixed z thresholds, so the rails breathe with volatility.
A simple trend proxy from z-score momentum to separate trending from ranging conditions.
On-chart signals for pullback entries, stretched extremes, and practical exits.
Core idea (plain English math)
Rolling mean and volatility - Over a lookback you get the average price and its standard deviation.
Z-score - How many standard deviations the current price is above or below its average: z = (price - mean) / stdev. z near 0 means near average; positive is above; negative is below.
Noise control - An EMA smooths the raw z to reduce jitter and false flickers.
Channels back in price - Fixed z levels are converted back to price to form the upper, lower, and extreme rails.
Trend proxy - A smoothed change in z is used as a lightweight trend-strength line. Positive strength with positive z favors uptrend; negative strength with negative z favors downtrend.
What you see on the chart
Channels and fills - Mean, upper, lower, and optional extreme lines. The area mean->upper tints with the bearish color, mean->lower tints with the bullish color.
Background tint (optional) - Soft green, red, or neutral based on detected trend state.
Signals - Bullish Entry (triangle up) when z exits the oversold zone upward; Bearish Entry (triangle down) when z exits the overbought zone downward; Extreme markers (diamonds) at the extreme bands with a one-bar turn.
Table - Current z, trend state, trend strength, distance to bands, market state tag, and a quick volatility regime label.
Edge labels - MEAN, OB, and OS labels slightly projected forward with level values.
Inputs you will actually use
Z-Score Period - Lookback for mean and stdev. Larger = slower and steadier rails, smaller = more reactive.
Smoothing Period - EMA on z. Lower = earlier but choppier flips; higher = later but cleaner.
Price Source - Default hlc3. Choose close if you prefer session-close logic.
Upper and Lower Thresholds - Default around +2.0 and -2.0. Tighten for more signals, widen for fewer and stronger.
Extreme Upper and Lower - Deeper stretch guards, e.g., +/- 2.5.
Strength Period - EMA on z momentum. Sets how fast the trend proxy flips.
Trend Threshold - Minimum absolute z to accept a directional bias.
Visual toggles - Channels, signals, background tint, stats table, colors, and optional last-bar trend label.
How to use it: trend-following playbook
Read the state - Uptrend when z > Trend Threshold and trend strength > 0. Downtrend when z < -Trend Threshold and trend strength < 0. Neutral otherwise.
Entries - In an uptrend, prefer Bullish Entry signals that fire near the lower channel. In a downtrend, prefer Bearish Entry signals that fire near the upper channel.
Stops - Conservative: beyond the extreme channel on your side. Tighter: just outside the standard band that framed the signal.
Exits - For longs, exit or trim on a cross back through z = 0 or a clean tag of the upper threshold. For shorts, mirror with z = 0 up-cross or tag of the lower threshold. You can also reduce if trend strength flips against you.
Adds - In strong trends, additional signals near your side’s band can be add points. Avoid adding once z hovers near the opposite band for several bars.
How to use it: mean-reversion playbook
Find stretch - Standard reversions: Bullish Entry when z leaves the oversold zone upward; Bearish Entry when z leaves the overbought zone downward. Aggressive reversions: Extreme markers at extreme bands with a one-bar turn.
Entries - Take the signal as price exits the zone. Prefer setups where trend strength is near zero or tilting against the prior push.
Targets - First target is the mean line. A runner can aim for the opposite standard channel if momentum keeps flipping.
Stops - Outside the extreme band beyond your entry. If fading without extremes, place risk just beyond the opposite standard band.
Filters - Optional: skip counter-trend fades against a very strong trend state unless your risk is tight and predefined.
Reading the stats table
Current Z-Score - Magnitude and sign of displacement now.
Trend State - Uptrend, Downtrend, or Ranging.
Trend Strength - Smoothed z momentum. Higher absolute values imply stronger directional conviction.
Distance to Upper/Lower - Percent distance from price to each band, useful for sizing targets or judging room left.
Market State - Overbought, Oversold, Extreme OB, Extreme OS, or Normal.
Volatility Regime - High, Normal, or Low relative to recent distribution. Expect bands to widen in High and tighten in Low.
Parameter guidance (conceptual)
Z-Score Period - Choose longer for a structural mean, shorter for a reactive mean.
Smoothing Period - Lower for earlier but noisier reads; higher for slower but steadier reads.
Thresholds - Start around +/- 2.0. Tighten for scalping or quiet ranges. Widen for noisy or fast markets.
Trend Threshold and Strength Period - Raise to avoid weak, transient bias. Lower to capture earlier regime shifts.
Practical examples
Trend pullback long - State shows Uptrend. Price tests the lower channel; z dips near or below the lower threshold; a Bullish Entry prints. Stop just below extreme lower; first target mean; keep a runner if trend strength stays positive.
Mean-revert short - State is Ranging. z tags the extreme upper, an Extreme Bearish marker prints, then a Bearish Entry prints on the leave. Stop above extreme upper; target the mean; consider a runner toward the lower channel if strength turns negative.
Potential Questions you might have
Why z-score instead of fixed offsets - Because the bands adapt with volatility. When the tape gets quiet the rails tighten, when it runs hot the rails expand. Your entries stay normalized.
Do I need both modes - No. Many users run only trend pullbacks or only mean-reversions. The tool lets you toggle what you need and keep the chart readable.
Multi-timeframe workflow - A common approach is to set bias from a higher timeframe’s trend state and execute on a lower timeframe’s signals that align with it.
Summary
Z-Score Trend Channels gives you an adaptive mean, volatility-aware rails, a simple trend lens, and clear signals. Trade the trend by buying pullbacks in green and selling pullbacks in red, or fade stretched extremes back to the mean with defined risk. One framework, two strategies, consistent logic.

ATR Bands over 50D SMA (% method)Indicator that shows multiples of ATR% above the 50d SMA as bands on a chart, building off of
Jeff Sun 's methodology. You should tinker with the settings to chose your multiples, colors and which multiple lines to show. I don't know if the negative multiple lines have any use, so I turn mine off. Offered as is. I am not a programmer. Note the other indicators shown on the print screen are not mine.
BOCS Channel Scalper Strategy - Automated Mean Reversion System# BOCS Channel Scalper Strategy - Automated Mean Reversion System
## WHAT THIS STRATEGY DOES:
This is an automated mean reversion trading strategy that identifies consolidation channels through volatility analysis and executes scalp trades when price enters entry zones near channel boundaries. Unlike breakout strategies, this system assumes price will revert to the channel mean, taking profits as price bounces back from extremes. Position sizing is fully customizable with three methods: fixed contracts, percentage of equity, or fixed dollar amount. Stop losses are placed just outside channel boundaries with take profits calculated either as fixed points or as a percentage of channel range.
## KEY DIFFERENCE FROM ORIGINAL BOCS:
**This strategy is designed for traders seeking higher trade frequency.** The original BOCS indicator trades breakouts OUTSIDE channels, waiting for price to escape consolidation before entering. This scalper version trades mean reversion INSIDE channels, entering when price reaches channel extremes and betting on a bounce back to center. The result is significantly more trading opportunities:
- **Original BOCS**: 1-3 signals per channel (only on breakout)
- **Scalper Version**: 5-15+ signals per channel (every touch of entry zones)
- **Trade Style**: Mean reversion vs trend following
- **Hold Time**: Seconds to minutes vs minutes to hours
- **Best Markets**: Ranging/choppy conditions vs trending breakouts
This makes the scalper ideal for active day traders who want continuous opportunities within consolidation zones rather than waiting for breakout confirmation. However, increased trade frequency also means higher commission costs and requires tighter risk management.
## TECHNICAL METHODOLOGY:
### Price Normalization Process:
The strategy normalizes price data to create consistent volatility measurements across different instruments and price levels. It calculates the highest high and lowest low over a user-defined lookback period (default 100 bars). Current close price is normalized using: (close - lowest_low) / (highest_high - lowest_low), producing values between 0 and 1 for standardized volatility analysis.
### Volatility Detection:
A 14-period standard deviation is applied to the normalized price series to measure price deviation from the mean. Higher standard deviation values indicate volatility expansion; lower values indicate consolidation. The strategy uses ta.highestbars() and ta.lowestbars() to identify when volatility peaks and troughs occur over the detection period (default 14 bars).
### Channel Formation Logic:
When volatility crosses from a high level to a low level (ta.crossover(upper, lower)), a consolidation phase begins. The strategy tracks the highest and lowest prices during this period, which become the channel boundaries. Minimum duration of 10+ bars is required to filter out brief volatility spikes. Channels are rendered as box objects with defined upper and lower boundaries, with colored zones indicating entry areas.
### Entry Signal Generation:
The strategy uses immediate touch-based entry logic. Entry zones are defined as a percentage from channel edges (default 20%):
- **Long Entry Zone**: Bottom 20% of channel (bottomBound + channelRange × 0.2)
- **Short Entry Zone**: Top 20% of channel (topBound - channelRange × 0.2)
Long signals trigger when candle low touches or enters the long entry zone. Short signals trigger when candle high touches or enters the short entry zone. This captures mean reversion opportunities as price reaches channel extremes.
### Cooldown Filter:
An optional cooldown period (measured in bars) prevents signal spam by enforcing minimum spacing between consecutive signals. If cooldown is set to 3 bars, no new long signal will fire until 3 bars after the previous long signal. Long and short cooldowns are tracked independently, allowing both directions to signal within the same period.
### ATR Volatility Filter:
The strategy includes a multi-timeframe ATR filter to avoid trading during low-volatility conditions. Using request.security(), it fetches ATR values from a specified timeframe (e.g., 1-minute ATR while trading on 5-minute charts). The filter compares current ATR to a user-defined minimum threshold:
- If ATR ≥ threshold: Trading enabled
- If ATR < threshold: No signals fire
This prevents entries during dead zones where mean reversion is unreliable due to insufficient price movement.
### Take Profit Calculation:
Two TP methods are available:
**Fixed Points Mode**:
- Long TP = Entry + (TP_Ticks × syminfo.mintick)
- Short TP = Entry - (TP_Ticks × syminfo.mintick)
**Channel Percentage Mode**:
- Long TP = Entry + (ChannelRange × TP_Percent)
- Short TP = Entry - (ChannelRange × TP_Percent)
Default 50% targets the channel midline, a natural mean reversion target. Larger percentages aim for opposite channel edge.
### Stop Loss Placement:
Stop losses are placed just outside the channel boundary by a user-defined tick offset:
- Long SL = ChannelBottom - (SL_Offset_Ticks × syminfo.mintick)
- Short SL = ChannelTop + (SL_Offset_Ticks × syminfo.mintick)
This logic assumes channel breaks invalidate the mean reversion thesis. If price breaks through, the range is no longer valid and position exits.
### Trade Execution Logic:
When entry conditions are met (price in zone, cooldown satisfied, ATR filter passed, no existing position):
1. Calculate entry price at zone boundary
2. Calculate TP and SL based on selected method
3. Execute strategy.entry() with calculated position size
4. Place strategy.exit() with TP limit and SL stop orders
5. Update info table with active trade details
The strategy enforces one position at a time by checking strategy.position_size == 0 before entry.
### Channel Breakout Management:
Channels are removed when price closes more than 10 ticks outside boundaries. This tolerance prevents premature channel deletion from minor breaks or wicks, allowing the mean reversion setup to persist through small boundary violations.
### Position Sizing System:
Three methods calculate position size:
**Fixed Contracts**:
- Uses exact contract quantity specified in settings
- Best for futures traders (e.g., "trade 2 NQ contracts")
**Percentage of Equity**:
- position_size = (strategy.equity × equity_pct / 100) / close
- Dynamically scales with account growth
**Cash Amount**:
- position_size = cash_amount / close
- Maintains consistent dollar exposure regardless of price
## INPUT PARAMETERS:
### Position Sizing:
- **Position Size Type**: Choose Fixed Contracts, % of Equity, or Cash Amount
- **Number of Contracts**: Fixed quantity per trade (1-1000)
- **% of Equity**: Percentage of account to allocate (1-100%)
- **Cash Amount**: Dollar value per position ($100+)
### Channel Settings:
- **Nested Channels**: Allow multiple overlapping channels vs single channel
- **Normalization Length**: Lookback for high/low calculation (1-500, default 100)
- **Box Detection Length**: Period for volatility detection (1-100, default 14)
### Scalping Settings:
- **Enable Long Scalps**: Toggle long entries on/off
- **Enable Short Scalps**: Toggle short entries on/off
- **Entry Zone % from Edge**: Size of entry zone (5-50%, default 20%)
- **SL Offset (Ticks)**: Distance beyond channel for stop (1+, default 5)
- **Cooldown Period (Bars)**: Minimum spacing between signals (0 = no cooldown)
### ATR Filter:
- **Enable ATR Filter**: Toggle volatility filter on/off
- **ATR Timeframe**: Source timeframe for ATR (1, 5, 15, 60 min, etc.)
- **ATR Length**: Smoothing period (1-100, default 14)
- **Min ATR Value**: Threshold for trade enablement (0.1+, default 10.0)
### Take Profit Settings:
- **TP Method**: Choose Fixed Points or % of Channel
- **TP Fixed (Ticks)**: Static distance in ticks (1+, default 30)
- **TP % of Channel**: Dynamic target as channel percentage (10-100%, default 50%)
### Appearance:
- **Show Entry Zones**: Toggle zone labels on channels
- **Show Info Table**: Display real-time strategy status
- **Table Position**: Corner placement (Top Left/Right, Bottom Left/Right)
- **Color Settings**: Customize long/short/TP/SL colors
## VISUAL INDICATORS:
- **Channel boxes** with semi-transparent fill showing consolidation zones
- **Colored entry zones** labeled "LONG ZONE ▲" and "SHORT ZONE ▼"
- **Entry signal arrows** below/above bars marking long/short entries
- **Active TP/SL lines** with emoji labels (⊕ Entry, 🎯 TP, 🛑 SL)
- **Info table** showing position status, channel state, last signal, entry/TP/SL prices, and ATR status
## HOW TO USE:
### For 1-3 Minute Scalping (NQ/ES):
- ATR Timeframe: "1" (1-minute)
- ATR Min Value: 10.0 (for NQ), adjust per instrument
- Entry Zone %: 20-25%
- TP Method: Fixed Points, 20-40 ticks
- SL Offset: 5-10 ticks
- Cooldown: 2-3 bars
- Position Size: 1-2 contracts
### For 5-15 Minute Day Trading:
- ATR Timeframe: "5" or match chart
- ATR Min Value: Adjust to instrument (test 8-15 for NQ)
- Entry Zone %: 20-30%
- TP Method: % of Channel, 40-60%
- SL Offset: 5-10 ticks
- Cooldown: 3-5 bars
- Position Size: Fixed contracts or 5-10% equity
### For 30-60 Minute Swing Scalping:
- ATR Timeframe: "15" or "30"
- ATR Min Value: Lower threshold for broader market
- Entry Zone %: 25-35%
- TP Method: % of Channel, 50-70%
- SL Offset: 10-15 ticks
- Cooldown: 5+ bars or disable
- Position Size: % of equity recommended
## BACKTEST CONSIDERATIONS:
- Strategy performs best in ranging, mean-reverting markets
- Strong trending markets produce more stop losses as price breaks channels
- ATR filter significantly reduces trade count but improves quality during low volatility
- Cooldown period trades signal quantity for signal quality
- Commission and slippage materially impact sub-5-minute timeframe performance
- Shorter timeframes require tighter entry zones (15-20%) to catch quick reversions
- % of Channel TP adapts better to varying channel sizes than fixed points
- Fixed contract sizing recommended for consistent risk per trade in futures
**Backtesting Parameters Used**: This strategy was developed and tested using realistic commission and slippage values to provide accurate performance expectations. Recommended settings: Commission of $1.40 per side (typical for NQ futures through discount brokers), slippage of 2 ticks to account for execution delays on fast-moving scalp entries. These values reflect real-world trading costs that active scalpers will encounter. Backtest results without proper cost simulation will significantly overstate profitability.
## COMPATIBLE MARKETS:
Works on any instrument with price data including stock indices (NQ, ES, YM, RTY), individual stocks, forex pairs (EUR/USD, GBP/USD), cryptocurrency (BTC, ETH), and commodities. Volume-based features require data feed with volume information but are optional for core functionality.
## KNOWN LIMITATIONS:
- Immediate touch entry can fire multiple times in choppy zones without adequate cooldown
- Channel deletion at 10-tick breaks may be too aggressive or lenient depending on instrument tick size
- ATR filter from lower timeframes requires higher-tier TradingView subscription (request.security limitation)
- Mean reversion logic fails in strong breakout scenarios leading to stop loss hits
- Position sizing via % of equity or cash amount calculates based on close price, may differ from actual fill price
- No partial closing capability - full position exits at TP or SL only
- Strategy does not account for gap openings or overnight holds
## RISK DISCLOSURE:
Trading involves substantial risk of loss. Past performance does not guarantee future results. This strategy is for educational purposes and backtesting only. Mean reversion strategies can experience extended drawdowns during trending markets. Stop losses may not fill at intended levels during extreme volatility or gaps. Thoroughly test on historical data and paper trade before risking real capital. Use appropriate position sizing and never risk more than you can afford to lose. Consider consulting a licensed financial advisor before making trading decisions. Automated trading systems can malfunction - monitor all live positions actively.
## ACKNOWLEDGMENT & CREDITS:
This strategy is built upon the channel detection methodology created by **AlgoAlpha** in the "Smart Money Breakout Channels" indicator. Full credit and appreciation to AlgoAlpha for pioneering the normalized volatility approach to identifying consolidation patterns. The core channel formation logic using normalized price standard deviation is AlgoAlpha's original contribution to the TradingView community.
Enhancements to the original concept include: mean reversion entry logic (vs breakout), immediate touch-based signals, multi-timeframe ATR volatility filtering, flexible position sizing (fixed/percentage/cash), cooldown period filtering, dual TP methods (fixed points vs channel percentage), automated strategy execution with exit management, and real-time position monitoring table.

Volume Delta Volume Signals by Claudio [hapharmonic]// This Pine Script™ code is subject to the terms of the Mozilla Public License 2.0 at mozilla.org
// © hapharmonic
//@version=6
FV = format.volume
FP = format.percent
indicator('Volume Delta Volume Signals by Claudio ', format = FV, max_bars_back = 4999, max_labels_count = 500)
//------------------------------------------
// Settings |
//------------------------------------------
bool usecandle = input.bool(true, title = 'Volume on Candles',display=display.none)
color C_Up = input.color(#12cef8, title = 'Volume Buy', inline = ' ', group = 'Style')
color C_Down = input.color(#fe3f00, title = 'Volume Sell', inline = ' ', group = 'Style')
// ✅ Nueva entrada para colores de señales
color buySignalColor = input.color(color.new(color.green, 0), "Buy Signal Color", group = "Signals")
color sellSignalColor = input.color(color.new(color.red, 0), "Sell Signal Color", group = "Signals")
string P_ = input.string(position.top_right,"Position",options = ,
group = "Style",display=display.none)
string sL = input.string(size.small , 'Size Label', options = , group = 'Style',display=display.none)
string sT = input.string(size.normal, 'Size Table', options = , group = 'Style',display=display.none)
bool Label = input.bool(false, inline = 'l')
History = input.bool(true, inline = 'l')
// Inputs for EMA lengths and volume confirmation
bool MAV = input.bool(true, title = 'EMA', group = 'EMA')
string volumeOption = input.string('Use Volume Confirmation', title = 'Volume Option', options = , group = 'EMA',display=display.none)
bool useVolumeConfirmation = volumeOption == 'none' ? false : true
int emaFastLength = input(12, title = 'Fast EMA Length', group = 'EMA',display=display.none)
int emaSlowLength = input(26, title = 'Slow EMA Length', group = 'EMA',display=display.none)
int volumeConfirmationLength = input(6, title = 'Volume Confirmation Length', group = 'EMA',display=display.none)
string alert_freq = input.string(alert.freq_once_per_bar_close, title="Alert Frequency",
options= ,group = "EMA",
tooltip="If you choose once_per_bar, you will receive immediate notifications (but this may cause interference or indicator repainting).
However, if you choose once_per_bar_close, it will wait for the candle to confirm the signal before notifying.",display=display.none)
//------------------------------------------
// UDT_identifier |
//------------------------------------------
type OHLCV
float O = open
float H = high
float L = low
float C = close
float V = volume
type VolumeData
float buyVol
float sellVol
float pcBuy
float pcSell
bool isBuyGreater
float higherVol
float lowerVol
color higherCol
color lowerCol
//------------------------------------------
// Calculate volumes and percentages |
//------------------------------------------
calcVolumes(OHLCV ohlcv) =>
var VolumeData data = VolumeData.new()
data.buyVol := ohlcv.V * (ohlcv.C - ohlcv.L) / (ohlcv.H - ohlcv.L)
data.sellVol := ohlcv.V - data.buyVol
data.pcBuy := data.buyVol / ohlcv.V * 100
data.pcSell := 100 - data.pcBuy
data.isBuyGreater := data.buyVol > data.sellVol
data.higherVol := data.isBuyGreater ? data.buyVol : data.sellVol
data.lowerVol := data.isBuyGreater ? data.sellVol : data.buyVol
data.higherCol := data.isBuyGreater ? C_Up : C_Down
data.lowerCol := data.isBuyGreater ? C_Down : C_Up
data
//------------------------------------------
// Get volume data |
//------------------------------------------
ohlcv = OHLCV.new()
volData = calcVolumes(ohlcv)
// Plot volumes and create labels
plot(ohlcv.V, color=color.new(volData.higherCol, 90), style=plot.style_columns, title='Total',display = display.all - display.status_line)
plot(ohlcv.V, color=volData.higherCol, style=plot.style_stepline_diamond, title='Total2', linewidth = 2,display = display.pane)
plot(volData.higherVol, color=volData.higherCol, style=plot.style_columns, title='Higher Volume', display = display.all - display.status_line)
plot(volData.lowerVol , color=volData.lowerCol , style=plot.style_columns, title='Lower Volume',display = display.all - display.status_line)
S(D,F)=>str.tostring(D,F)
volStr = S(math.sign(ta.change(ohlcv.C)) * ohlcv.V, FV)
buyVolStr = S(volData.buyVol , FV )
sellVolStr = S(volData.sellVol , FV )
// ✅ MODIFICACIÓN: Porcentaje sin decimales
buyPercentStr = str.tostring(math.round(volData.pcBuy)) + " %"
sellPercentStr = str.tostring(math.round(volData.pcSell)) + " %"
totalbuyPercentC_ = volData.buyVol / (volData.buyVol + volData.sellVol) * 100
sup = not na(ohlcv.V)
if sup
TC = text.align_center
CW = color.white
var table tb = table.new(P_, 6, 6, bgcolor = na, frame_width = 2, frame_color = chart.fg_color, border_width = 1, border_color = CW)
tb.cell(0, 0, text = 'Volume Candles', text_color = #FFBF00, bgcolor = #0E2841, text_halign = TC, text_valign = TC, text_size = sT)
tb.merge_cells(0, 0, 5, 0)
tb.cell(0, 1, text = 'Current Volume', text_color = CW, bgcolor = #0B3040, text_halign = TC, text_valign = TC, text_size = sT)
tb.merge_cells(0, 1, 1, 1)
tb.cell(0, 2, text = 'Buy', text_color = #000000, bgcolor = #92D050, text_halign = TC, text_valign = TC, text_size = sT)
tb.cell(1, 2, text = 'Sell', text_color = #000000, bgcolor = #FF0000, text_halign = TC, text_valign = TC, text_size = sT)
tb.cell(0, 3, text = buyVolStr, text_color = CW, bgcolor = #074F69, text_halign = TC, text_valign = TC, text_size = sT)
tb.cell(1, 3, text = sellVolStr, text_color = CW, bgcolor = #074F69, text_halign = TC, text_valign = TC, text_size = sT)
tb.cell(0, 5, text = 'Net: ' + volStr, text_color = CW, bgcolor = #074F69, text_halign = TC, text_valign = TC, text_size = sT)
tb.merge_cells(0, 5, 1, 5)
tb.cell(0, 4, text = buyPercentStr, text_color = CW, bgcolor = #074F69, text_halign = TC, text_valign = TC, text_size = sT)
tb.cell(1, 4, text = sellPercentStr, text_color = CW, bgcolor = #074F69, text_halign = TC, text_valign = TC, text_size = sT)
cellCount = 20
filledCells = 0
for r = 5 to 1 by 1
for c = 2 to 5 by 1
if filledCells < cellCount * (totalbuyPercentC_ / 100)
tb.cell(c, r, text = '', bgcolor = C_Up)
else
tb.cell(c, r, text = '', bgcolor = C_Down)
filledCells := filledCells + 1
filledCells
if Label
sp = ' '
l = label.new(bar_index, ohlcv.V,
text=str.format('Net: {0} Buy: {1} ({2}) Sell: {3} ({4}) {5}/\ {5}l {5}l',
volStr, buyVolStr, buyPercentStr, sellVolStr, sellPercentStr, sp),
style=label.style_none, textcolor=volData.higherCol, size=sL, textalign=text.align_left)
if not History
(l ).delete()
//------------------------------------------
// Draw volume levels on the candlesticks |
//------------------------------------------
float base = na,float value = na
bool uc = usecandle and sup
if volData.isBuyGreater
base := math.min(ohlcv.O, ohlcv.C)
value := base + math.abs(ohlcv.O - ohlcv.C) * (volData.pcBuy / 100)
else
base := math.max(ohlcv.O, ohlcv.C)
value := base - math.abs(ohlcv.O - ohlcv.C) * (volData.pcSell / 100)
barcolor(sup ? color.new(na, na) : ohlcv.C < ohlcv.O ? color.red : color.green,display = usecandle? display.all:display.none)
UseC = uc ? volData.higherCol:color.new(na, na)
plotcandle(uc?base:na, uc?base:na, uc?value:na, uc?value:na,
title='Body', color=UseC, bordercolor=na, wickcolor=UseC,
display = usecandle ? display.all - display.status_line : display.none, force_overlay=true,editable=false)
plotcandle(uc?ohlcv.O:na, uc?ohlcv.H:na, uc?ohlcv.L:na, uc?ohlcv.C:na,
title='Fill', color=color.new(UseC,80), bordercolor=UseC, wickcolor=UseC,
display = usecandle ? display.all - display.status_line : display.none, force_overlay=true,editable=false)
//------------------------------------------------------------
// Plot the EMA and filter out the noise with volume control. |
//------------------------------------------------------------
float emaFast = ta.ema(ohlcv.C, emaFastLength)
float emaSlow = ta.ema(ohlcv.C, emaSlowLength)
bool signal = emaFast > emaSlow
color c_signal = signal ? C_Up : C_Down
float volumeMA = ta.sma(ohlcv.V, volumeConfirmationLength)
bool crossover = ta.crossover(emaFast, emaSlow)
bool crossunder = ta.crossunder(emaFast, emaSlow)
isVolumeConfirmed(source, length, ma) =>
math.sum(source > ma ? source : 0, length) >= math.sum(source < ma ? source : 0, length)
bool ISV = isVolumeConfirmed(ohlcv.V, volumeConfirmationLength, volumeMA)
bool crossoverConfirmed = crossover and (not useVolumeConfirmation or ISV)
bool crossunderConfirmed = crossunder and (not useVolumeConfirmation or ISV)
PF = MAV ? emaFast : na
PS = MAV ? emaSlow : na
p1 = plot(PF, color = c_signal, editable = false, force_overlay = true, display = display.pane)
plot(PF, color = color.new(c_signal, 80), linewidth = 10, editable = false, force_overlay = true, display = display.pane)
plot(PF, color = color.new(c_signal, 90), linewidth = 20, editable = false, force_overlay = true, display = display.pane)
plot(PF, color = color.new(c_signal, 95), linewidth = 30, editable = false, force_overlay = true, display = display.pane)
plot(PF, color = color.new(c_signal, 98), linewidth = 45, editable = false, force_overlay = true, display = display.pane)
p2 = plot(PS, color = c_signal, editable = false, force_overlay = true, display = display.pane)
plot(PS, color = color.new(c_signal, 80), linewidth = 10, editable = false, force_overlay = true, display = display.pane)
plot(PS, color = color.new(c_signal, 90), linewidth = 20, editable = false, force_overlay = true, display = display.pane)
plot(PS, color = color.new(c_signal, 95), linewidth = 30, editable = false, force_overlay = true, display = display.pane)
plot(PS, color = color.new(c_signal, 98), linewidth = 45, editable = false, force_overlay = true, display = display.pane)
fill(p1, p2, top_value=crossover ? emaFast : emaSlow,
bottom_value =crossover ? emaSlow : emaFast,
top_color =color.new(c_signal, 80),
bottom_color =color.new(c_signal, 95)
)
// ✅ Usar colores configurables para señales
plotshape(crossoverConfirmed and MAV, style=shape.triangleup , location=location.belowbar, color=buySignalColor , size=size.small, force_overlay=true,display =display.pane)
plotshape(crossunderConfirmed and MAV, style=shape.triangledown, location=location.abovebar, color=sellSignalColor, size=size.small, force_overlay=true,display =display.pane)
string msg = '--------- '+"Buy volume ="+buyVolStr+" Buy Percent = "+buyPercentStr+" Sell volume = "+sellVolStr+" Sell Percent = "+sellPercentStr+" Net = "+volStr+' ---------'
if crossoverConfirmed
alert("Price (" + str.tostring(close) + ") Crossed over MA " + msg, alert_freq)
if crossunderConfirmed
alert("Price (" + str.tostring(close) + ") Crossed under MA " + msg, alert_freq)

❄️ Lin Kuei Elite SuperTrend ⚔️Lin Kuei Elite SuperTrend - Technical Analysis Indicator
Overview
The Lin Kuei Elite SuperTrend is an advanced trend-following indicator that enhances the traditional SuperTrend algorithm with multiple layers of analysis and sophisticated visual effects. Built on Pine Script v6, it provides traders with dynamic trend identification, signal generation, and comprehensive market intelligence.
Core Algorithm
The indicator calculates SuperTrend using an enhanced ATR (Average True Range) methodology with adaptive smoothing and rank-based multipliers. The core logic determines trend direction by comparing price action to dynamically adjusted upper and lower bands, creating clear trend reversals and continuation signals.
Key Components:
Enhanced ATR calculation with EMA smoothing
Rank-based sensitivity scaling (0.8x to 1.6x multipliers)
Volume and momentum filtering options
Multi-timeframe shadow clone analysis
Assassin Rank System
The indicator features four distinct operational modes that adjust sensitivity and visual complexity:
Shadow Ninja (Conservative): 80% sensitivity with stable, low-noise signals ideal for risk-averse traders seeking high-confidence entries.
Ice Warrior (Balanced): Standard 100% sensitivity providing optimal balance between responsiveness and stability for most trading scenarios.
Frost Master (Aggressive): 130% sensitivity with enhanced trend detection for experienced traders in volatile markets.
Grandmaster Sub-Zero (Ultimate): 160% sensitivity with maximum responsiveness and exclusive visual effects for professional-level analysis.
Visual Features
Frost Aura Effects: Multi-layered glow effects around the main trend line with dynamic transparency based on trend velocity, creating visual depth and trend strength indication.
Shadow Clone Technique: Displays fast and slow SuperTrend variants using different ATR periods (0.7x and 1.5x) to provide confirmation and early warning signals.
Future Sight Projections: Three predictive projection lines showing potential trend continuation based on current velocity and acceleration calculations.
Quantum Particles: Animated particle effects positioned above and below the main trend line, appearing at regular intervals to enhance visual appeal.
Protection Zones: Shaded areas around the main trend line representing dynamic support/resistance zones calculated at 30% of the adjusted ATR.
Signal Generation
The indicator generates two primary signal types:
Trend Change Signals: Triangle markers appear when the trend direction shifts from bullish to bearish or vice versa, with confirmation based on price position relative to the calculated bands.
Rank-Specific Signals: Higher ranks display additional character-based signals (snowflake, fire, ice cube, lightning) with corresponding size scaling based on the selected assassin rank.
Technical Specifications
Input Parameters:
ATR Period: 10 (adjustable 1-50)
Ice Multiplier: 3.0 (adjustable 0.5-10.0)
Crystallization Period: 2 (adjustable 1-10)
Line Thickness: 4 (adjustable 1-8)
Optional Filters:
Volume confirmation with threshold settings
Momentum filtering based on 5-period price changes
Noise reduction capabilities
Intelligence Dashboard
A compact real-time dashboard displays:
Current assassin rank and associated color coding
Trend direction with visual indicators
Power level classification (LOW/MODERATE/HIGH/EXTREME)
Protection zone status
Signal system status
Battle readiness assessment
Alert System
Comprehensive alert functionality includes:
Basic trend change notifications
Rank-specific ultimate technique alerts
Customizable message content for different signal types
Use Cases
The indicator suits multiple trading styles:
Trend Following: Primary trend identification with clear entry/exit points
Swing Trading: Medium-term trend changes with protection zones for position management
Scalping: Fast rank settings for quick trend reversals (use with caution due to increased noise)
Risk Management: Protection zones help determine stop-loss placement and position sizing
Limitations
This indicator is a trend-following tool and may generate false signals in ranging or choppy markets. The multiple visual effects, while aesthetically appealing, may cause information overload for some users. Higher sensitivity ranks increase signal frequency but also false signal probability. The indicator works best in trending market conditions and should be combined with other forms of analysis for optimal results.
The thematic elements (assassin ranks, frost/fire imagery) are purely cosmetic and do not affect the underlying mathematical calculations, which remain based on established technical analysis principles.

SCTI - D14SCTI - D14 Comprehensive Technical Analysis Suite
English Description
SCTI D14 is an advanced multi-component technical analysis indicator designed for professional traders and analysts. This comprehensive suite combines multiple analytical tools into a single, powerful indicator that provides deep market insights across various timeframes and methodologies.
Core Components:
1. EMA System (Exponential Moving Averages)
13 customizable EMA lines with periods ranging from 8 to 2584
Fibonacci-based periods (8, 13, 21, 34, 55, 89, 144, 233, 377, 610, 987, 1597, 2584)
Color-coded visualization for easy trend identification
Individual toggle controls for each EMA line
2. TFMA (Multi-Timeframe Moving Averages)
Cross-timeframe analysis with 3 independent EMA calculations
Real-time labels showing trend direction and price relationships
Customizable timeframes for each moving average
Percentage deviation display from current price
3. PMA (Precision Moving Average Cloud)
7-layer moving average system with customizable periods
Fill areas between moving averages for trend visualization
Support and resistance zone identification
Dynamic color-coded trend clouds
4. VWAP (Volume Weighted Average Price)
Multiple anchor points (Session, Week, Month, Quarter, Year, Earnings, Dividends, Splits)
Standard deviation bands for volatility analysis
Automatic session detection and anchoring
Statistical price level identification
5. Advanced Divergence Detector
12 technical indicators for divergence analysis (MACD, RSI, Stochastic, CCI, Williams %R, Bias, Momentum, OBV, VW-MACD, CMF, MFI, External)
Regular and hidden divergences detection
Bullish and bearish signals with visual confirmation
Customizable sensitivity and filtering options
Real-time alerts for divergence formations
6. Volume Profile & Node Analysis
Comprehensive volume distribution analysis
Point of Control (POC) identification
Value Area High/Low (VAH/VAL) calculations
Volume peaks and troughs detection
Support and resistance levels based on volume
7. Smart Money Concepts
Market structure analysis with Break of Structure (BOS) and Change of Character (CHoCH)
Internal and swing structure detection
Equal highs and lows identification
Fair Value Gaps (FVG) detection and visualization
Liquidity zones and institutional flow analysis
8. Trading Sessions
9 major trading sessions (Asia, Sydney, Tokyo, Shanghai, Hong Kong, Europe, London, New York, NYSE)
Real-time session status and countdown timers
Session volume and performance tracking
Customizable session boxes and labels
Statistical session analysis table
Key Features:
Modular Design: Enable/disable any component independently
Real-time Analysis: Live updates with market data
Multi-timeframe Support: Works across all chart timeframes
Customizable Alerts: Set alerts for any detected pattern or signal
Professional Visualization: Clean, organized display with customizable colors
Performance Optimized: Efficient code for smooth chart performance
Use Cases:
Trend Analysis: Identify market direction using multiple EMA systems
Entry/Exit Points: Use divergences and structure breaks for timing
Risk Management: Utilize volume profiles and session analysis for better positioning
Multi-timeframe Analysis: Confirm signals across different timeframes
Institutional Analysis: Track smart money flows and market structure
Perfect For:
Day traders seeking comprehensive market analysis
Swing traders needing multi-timeframe confirmation
Professional analysts requiring detailed market structure insights
Algorithmic traders looking for systematic signal generation
---
中文描述
SCTI - D14是一个先进的多组件技术分析指标,专为专业交易者和分析师设计。这个综合套件将多种分析工具整合到一个强大的指标中,在各种时间框架和方法论中提供深度市场洞察。
核心组件:
1. EMA系统(指数移动平均线)
13条可定制EMA线,周期从8到2584
基于斐波那契的周期(8, 13, 21, 34, 55, 89, 144, 233, 377, 610, 987, 1597, 2584)
颜色编码可视化,便于趋势识别
每条EMA线的独立切换控制
2. TFMA(多时间框架移动平均线)
跨时间框架分析,包含3个独立的EMA计算
实时标签显示趋势方向和价格关系
每个移动平均线的可定制时间框架
显示与当前价格的百分比偏差
3. PMA(精密移动平均云)
7层移动平均系统,周期可定制
移动平均线间填充区域用于趋势可视化
支撑阻力区域识别
动态颜色编码趋势云
4. VWAP(成交量加权平均价格)
多个锚点(交易时段、周、月、季、年、财报、分红、拆股)
标准差带用于波动性分析
自动时段检测和锚定
统计价格水平识别
5. 高级背离检测器
12个技术指标用于背离分析(MACD、RSI、随机指标、CCI、威廉姆斯%R、Bias、动量、OBV、VW-MACD、CMF、MFI、外部指标)
常规和隐藏背离检测
看涨看跌信号配视觉确认
可定制敏感度和过滤选项
背离形成的实时警报
6. 成交量分布与节点分析
全面的成交量分布分析
控制点(POC)识别
价值区域高/低点(VAH/VAL)计算
成交量峰值和低谷检测
基于成交量的支撑阻力水平
7. 聪明钱概念
市场结构分析,包括结构突破(BOS)和结构转变(CHoCH)
内部和摆动结构检测
等高等低识别
公允价值缺口(FVG)检测和可视化
流动性区域和机构资金流分析
8. 交易时区
9个主要交易时段(亚洲、悉尼、东京、上海、香港、欧洲、伦敦、纽约、纽交所)
实时时段状态和倒计时器
时段成交量和表现跟踪
可定制时段框和标签
统计时段分析表格
主要特性:
模块化设计:可独立启用/禁用任何组件
实时分析:随市场数据实时更新
多时间框架支持:适用于所有图表时间框架
可定制警报:为任何检测到的模式或信号设置警报
专业可视化:清洁、有序的显示界面,颜色可定制
性能优化:高效代码确保图表流畅运行
使用场景:
趋势分析:使用多重EMA系统识别市场方向
入场/出场点:利用背离和结构突破进行时机选择
风险管理:利用成交量分布和时段分析进行更好定位
多时间框架分析:在不同时间框架间确认信号
机构分析:跟踪聪明钱流向和市场结构
适用于:
寻求全面市场分析的日内交易者
需要多时间框架确认的摆动交易者
需要详细市场结构洞察的专业分析师
寻求系统化信号生成的算法交易者

PSAR+EMA+Hull+BBDescription
This all-in-one indicator combines four proven tools:
Parabolic SAR (Everget) — trend direction and potential reversals.
Exponential Moving Averages (20/50/100/200) — customizable lengths, colors, and offsets.
Hull Suite (InSilico) — smooth trend detection with multiple variations (HMA, THMA, EHMA).
Bollinger Bands — volatility and dynamic support/resistance.
Features
Toggle each module on/off in settings.
Fully configurable inputs (lengths, colors, offsets, multipliers).
Optional PSAR labels, highlights, and state fill.
Hull can color candles, draw band fills, and pull from higher timeframes.
Bollinger Bands include multiple basis types, stdev multipliers, and fill transparency.
Built-in alerts: PSAR direction change, Hull trending up/down.
Category
Trend Analysis (with Volatility as secondary).
