VWAP Pullback + EMA Stack + SAR (TIGHT) PROFIT LOCKVWAP Script with all kinds of toggles and settings please use it and play around with it.
樞軸點和水平

Stark Overnight Levelsovernight levels with asia high, asia low, midnight open, london high, london low

ORB Breakout Strategy with VWAP and Volume FiltersOverview
This strategy implements the classic Opening Range Breakout (ORB) methodology, a well-documented approach in trading literature that has been used by institutional and retail traders for decades. The strategy identifies the high and low of the first 15 minutes of the trading session, then trades breakouts with defined risk management.
This implementation includes multiple customizable filters (VWAP, Volume, Candle Strength) that traders can enable, disable, and tune to find configurations that work for their specific markets and trading style.
How It Works
Opening Range Calculation
The strategy captures the high and low of the first N bars after the session open (default: 3 bars on a 5-minute chart = 15 minutes). These levels become the breakout triggers for the session.
Entry Logic
Long Entry: When a bar closes above the ORB High and all enabled filters pass
Short Entry: When a bar closes below the ORB Low and all enabled filters pass
Exit Logic
Take Profit: Configurable multiple of the ORB range (default: 1x = full range beyond breakout level)
Stop Loss: Opposite side of the ORB range
Breakeven: Optional stop adjustment to entry price when trade reaches configurable profit threshold
Session Close: All positions automatically closed at end of trading session
Configurable Filters
All filters can be independently enabled or disabled:
1. VWAP Filter
Requires price above/below session-anchored VWAP
Requires VWAP slope confirmation (configurable lookback and minimum slope)
Purpose: Align trades with intraday trend direction
2. Volume Filter
Requires minimum volume on the breakout bar
Purpose: Confirm institutional participation in the breakout
3. Candle Strength Filter
Requires close in upper/lower portion of the bar range
Purpose: Filter out weak breakouts with poor conviction
Strategy Properties
Initial Capital - $50.000USD
Position Size - 1 contract (fixed)
Commission - $4.00 per contract
Slippage - 2 ticks
Margin - 1%
Pyramiding - Disabled
Backtest Results (NQ)
Recent Performance (Jan 2025 - Jan 2026)
Total Trades - 243
Win Rate - 39.09%
Profit Factor - 1.03
Net P&L - $3,581 (+7.16%)
Max Drawdown - $25,447 (39.96%)
Long-Term Performance (2010 - 2026)
Total Trades - 1699
Win Rate - 37.61%
Profit Factor - 0.756
Net P&L - ($49,632) (-99.26%)
Max Drawdown - $50,262 (99.27%)
Important: Long-term results show negative expectancy with default settings. This strategy is published as a research framework, not a ready-to-trade system. Users are encouraged to experiment with different configurations to find their edge.
Settings Guide
Main Settings
ORB Bars: Number of bars for opening range (3 = 15 min on 5-min chart)
Trading Session: Time window for trading (e.g., 0930-1200 for morning only)
Timezone: Your market's timezone
Take Profit: Multiple of ORB range for target
Breakeven Trigger: Distance to move stop to entry
Max Trades Per Day: Daily trade limit
VWAP Filter
Use VWAP Filter: Enable/disable
VWAP Slope Lookback: Bars to measure VWAP direction
Min VWAP Slope: Minimum slope threshold
Volume Filter
Use Volume Filter: Enable/disable
Min Breakout
Volume: Minimum contracts required
Candle Strength Filter
Use Candle Strength Filter: Enable/disable
Min Candle Strength: Required close position (0.7 = top/bottom 30%)
Research Suggestions
This strategy provides a foundation for exploring ORB-based approaches. Consider testing:
Different ORB periods: 5, 10, 15, or 30 minutes
Session variations: Morning only (0930-1200), afternoon, or full day
Direction bias: Long-only or short-only based on daily trend
Filter combinations: Different mixes of VWAP, volume, and candle filters
Take profit ratios: 0.5x, 1x, 1.5x, or 2x ORB range
Market regimes: Performance may vary in trending vs ranging markets
Different instruments: Test on ES, NQ, MNQ, or other futures
Visual Elements
Orange Background: ORB forming period
Green Background: Active trading session
Green Line: ORB High level
Red Line: ORB Low level
VWAP Line: Green = upslope, Red = downslope, Gray = flat
White Line: Trade entry price
Lime Line: Take profit level
Red Line: Stop loss level
Orange Line: Breakeven trigger level
Blue Background: Breakeven activated
Triangles: Entry signals (only appear when trade executes)
Limitations
Negative long-term expectancy: Default settings do not produce profitable results over extended periods
Parameter sensitivity: Results highly dependent on filter settings and market conditions
Market regime dependent: May perform differently in trending vs choppy markets
Commission impact: Frequent trading accumulates significant transaction costs
Curve fitting risk: Optimized settings may not persist in future markets
Disclaimer
This strategy is provided for educational and research purposes only. It does not constitute financial advice.
Past performance does not guarantee future results
Backtested results may not reflect actual trading conditions
The long-term backtest shows significant negative returns
Always paper trade before risking real capital
Never risk more than you can afford to lose
Conduct your own research and due diligence
This is a research framework designed for traders to explore and customize, not a plug-and-play trading system.

Golder/Silter SetupsGolden/Silver Strategy
Overview
The Tony Rago Golden/Silver Strategy is a high-precision mean-reversion system specifically engineered for the Nasdaq (NQ/MNQ). It leverages the psychological 100-point price blocks to identify institutional exhaustion and reversal points.
Unlike standard "grid" bots, this strategy uses a sophisticated "Arm & Fire" logic: it requires a specific price "touch" to arm the setup, followed by a retracement to a "Golden" entry level to execute.
Key Logic: The 100-Point Grid
The strategy divides price action into 100-point blocks (e.g., 19500 to 19600).
Golden Setup (Long): Triggered when price touches the 50 level (mid-point). The order is placed at the 26 level on the retracement.
Silver Setup (Short): Triggered when price touches the 00 or 100 levels (block boundaries). The order is placed at the 77 or 26 levels on the retracement.
Professional Risk Management
This edition features a Dual-Contract Management system designed for Prop Firm consistency:
Contract 1 (The Scalp): Aims for a quick 24-point target (TP1) to secure realized gains and cover costs.
Contract 2 (The Runner): Stays in the trade for an extended 51-point target (TP2).
Automated Break-Even (BE): The moment TP1 is hit, the Stop Loss for the Runner is automatically moved to the entry price (plus a small offset). This ensures a "risk-free" environment for the remainder of the trade.
Independent Stop Losses: The Scalp and the Runner use different SL distances to account for Nasdaq volatility, preventing a single "noise" wick from wiping out the entire position.
Intelligent Filters
ADX Range Filter: The strategy monitors market trend strength. It only allows trades when the ADX is below a user-defined threshold (default 25), ensuring you only play mean-reversion during ranging or "choppy" markets.
MA Visual Semaphor: The 50 EMA changes color dynamically based on ADX (Lime/Green for Range, Orange/Red for Trend), giving you an instant visual "Go/No-Go" signal.
Time-Session Filtering: Optimized for three custom sessions (NY Open, Mid-Day Reversal, and Late Night). Outside these sessions, the strategy can "Arm" setups in memory but will not "Fire" orders.
How to Use
Timeframe: Optimized for 1-Minute or 2-Minute charts for precision entry.
Asset: Nasdaq 100 (NQ, MNQ) or similar high-volatility indices.
Setup: * Enable Session Filters to avoid news volatility.
Adjust TP/SL in Points (1 Point = 4 Ticks) to suit your specific risk appetite.
Watch for the "Armados" labels—these indicate the system is ready and waiting for the Golden/Silver entry.
Visual Interface
Dynamic Boxes: Real-time visual representation of your TP1, TP2, and SL levels.
Activation Labels: Clear indications of when a Long or Short setup has been "Armed" in memory.
Status Dashboard: A clean top-right table showing current ADX values, Session status, and Risk settings.
Disclaimer
Trading involves significant risk. This strategy is a tool for decision support and backtesting. Past performance does not guarantee future results. Always test on a demo account before risking live capital.


Liquidity Retest Strategy (Apicode) - TP/SL Lines FixedTechnical Documentation:
1. Purpose and underlying concept
This strategy targets a common behavior in liquid markets: liquidity sweeps around meaningful support/resistance levels, followed by a retest and rejection (reversal) with confirmation.
The core thesis is that many initial “breaks” are not continuation moves, but rather stop-runs and order harvesting. After the sweep, price reclaims the level and closes back on the opposite side, offering a structured entry with defined risk.
The strategy includes:
Support/Resistance detection via pivots
Dynamic selection of the “working” level using an ATR-based proximity window
Rejection validation via candle structure (wick + close)
Optional filters: volume, VWAP-like bias, and EMA trend
Risk management with static TP/SL (ATR-based or %), plus trailing stop (ATR-based or %), with per-trade lines plotted
2. Main components
2.1. Volatility metric: ATR
atr = ta.atr(atrLength) is used in two essential places:
Level selection (proximity to S/R): prevents trading levels that are too far from current price.
Sweep validation (minimum wick size): requires the wick to extend beyond the level by a volatility-relative amount.
Optionally, ATR can also be used for:
Static TP/SL (when usePercent = false)
Trailing stop (when useTrailPercent = false)
2.2. Building S/R levels with pivots
Pivots are detected using:
pivotHigh = ta.pivothigh(pivotLookback, rightBars)
pivotLow = ta.pivotlow(pivotLookback, rightBars)
Each confirmed pivot is stored in arrays:
resistanceLevels for resistance
supportLevels for support
The array size is capped by maxLevels, which reduces noise and manages chart resource usage (lines).
2.3. Selecting the “best” level each bar
On each bar, a single support S and/or resistance R candidate is chosen:
Support: nearest level below price (L < price)
Resistance: nearest level above price (L > price)
Only levels within atr * maxDistATR are considered
This produces dynamic “working levels” that adapt to price location and volatility.
2.4. Rejection pattern (retest + sweep)
After selecting the working level:
Support rejection (long setup)
Conditions:
Low touches/crosses support: low <= S
Close reclaims above: close > S
Bullish candle: close > open
Sufficient wick below the level (liquidity sweep): (S - low) >= atr * minWickATR
This aims to capture a stop sweep below support followed by immediate recovery.
Resistance rejection (short setup)
Symmetric conditions:
High touches/crosses resistance: high >= R
Close rejects back below: close < R
Bearish candle: close < open
Sufficient wick above the level: (high - R) >= atr * minWickATR
2.5. Optional filters
Final signals are the rejection pattern AND enabled filters:
1.- Volume filter
High volume is defined as: volume > SMA(volume, 20) * volMult
When useVolFilter = true, setups require relatively elevated participation
2.- VWAP-like bias filter
A VWAP-like series is computed over vwapLength (typical price weighted by volume)
When useVWAPFilter = true:
- Longs only if close > vwap
- Shorts only if close < vwap
3.- EMA trend filter
Uptrend if EMA(fast) > EMA(slow)
When useTrendFilter = true:
- Longs only in uptrend
- Shorts only in downtrend
2.6. Backtest time window (time filter)
To keep testing focused and reduce long-history noise:
useMaxLookbackDays enables the filter
maxLookbackDays defines how many days back from timenow entries are allowed
Entries are permitted only when time >= startTime.
3. Entry rules and position control
3.1. Entries
strategy.entry('Long', strategy.long) when longSetup and no long position is open
strategy.entry('Short', strategy.short) when shortSetup and no short position is open
No pyramiding is allowed (pyramiding = 0). Position gating is handled by:
Long allowed if strategy.position_size <= 0
Short allowed if strategy.position_size >= 0
4. Risk management: TP/SL and trailing (with plotted lines)
4.1. Detecting entry/exit events
Events are identified via changes in strategy.position_size:
LongEntry: transition into a long
shortEntry: transition into a short
flatExit: transition back to flat
This drives per-trade line creation, updates, and cleanup of state variables.
4.2. Static TP/SL
On entry, entryPrice := strategy.position_avg_price is stored.
Percent mode (usePercent = true)
Long:
staticSL = entryPrice*(1 - slPerc/100)
staticTP = entryPrice*(1 + tpPerc/100)
Short:
staticSL = entryPrice*(1 + slPerc/100)
staticTP = entryPrice*(1 - tpPerc/100)
ATR mode (usePercent = false)
Long:
staticSL = entryPrice - atrAtEntry*slATR
staticTP = entryPrice + atrAtEntry*tpATR
Short:
staticSL = entryPrice + atrAtEntry*slATR
staticTP = entryPrice - atrAtEntry*tpATR
4.3. Trailing stop (custom)
While a position is open, the script tracks the most favorable excursion:
Long: hhSinceEntry = highest high since entry
Short: llSinceEntry = lowest low since entry
A trailing candidate is computed:
Percent trailing (useTrailPercent = true)
Long: trailCandidate = hhSinceEntry*(1 - trailPerc/100)
Short: trailCandidate = llSinceEntry*(1 + trailPerc/100)
ATR trailing (useTrailPercent = false)
Long: trailCandidate = hhSinceEntry - atr*trailATR
Short: trailCandidate = llSinceEntry + atr*trailATR
Then the effective stop is selected:
Long: slUsed = max(staticSL, trailCandidate) when useTrail is enabled
Short: slUsed = min(staticSL, trailCandidate) when useTrail is enabled
If useTrail is disabled, slUsed remains the static stop.
Take profit remains static:
tpUsed = staticTP
Exit orders are issued via:
strategy.exit(..., stop=slUsed, limit=tpUsed)
4.4. Per-trade TP/SL lines
On each entry, two lines are created (SL and TP) via f_createLines().
During the trade, the SL line updates when trailing moves the stop; TP remains fixed.
On exit (flatExit), both lines are finalized on the exit bar and left on the chart as historical references.
This makes it straightforward to visually audit each trade: entry context, intended TP, and trailing evolution until exit.
5. Visualization and debugging
BUY/SELL labels with configurable size (xsize)
Debug mode (showDebug) plots the chosen working support/resistance level each bar
Stored pivot levels are drawn using reusable line slots, projected a fixed 20 bars to the right to keep the chart readable and efficient
6. Parameter guidance and practical notes
pivotLookback / rightBars: controls pivot significance vs responsiveness. Lower rightBars confirms pivots earlier but can increase noise.
maxDistATR: too low may reject valid levels; too high may select distant, less relevant levels.
minWickATR: key quality gate for “real” sweeps. Higher values reduce frequency but often improve signal quality.
Filters:
Volume filter tends to help in ranges and active sessions.
VWAP bias is useful intraday to align trades with session positioning.
EMA trend filter is helpful in directional markets but may remove good mean-reversion setups.
Percent TP/SL: provides consistent behavior across assets with variable volatility, but is less adaptive to sudden regime shifts.
Percent trailing: can capture extensions well; calibrate trailPerc per asset/timeframe (too tight = premature exits).
7. Known limitations
Pivot-derived levels are a heuristic; in strong trends, valid retests may be limited.
The time filter uses timenow; behavior may vary depending on historical context and how the platform evaluates “current time.”
TP/SL and trailing are computed from bar OHLC; in live trading, intrabar sequencing and fills may differ from bar-close simulation.

LR Candles V2.1IMPORTANT: Use this strategy only with Heikin Ashi candles; otherwise, the results will be negative.
The use of this strategy is solely and exclusively under the responsibility of the operator.
To perform testing correctly and as close to market reality as possible, we suggest setting the strategy preferences as follows:
Slippage = 3
Using bar magnifico = Enabled
Commission = Completed
Detail: It is important to include at least 1,000 trades in the test. This provides a certain robustness in the historical analysis of a strategy. Values lower than this may alter the expected results when trading in real life.
Tip:
Play around with different time frames and calibrations on the strategic indicator. Examples include unchecking Ling-Reg, unchecking EMA, or using both in combination. Look for the best probability and results for a specific asset.
The strategy usually performs well on time frames longer than 1 hour; this is what has been observed.

Buy the dips StrategyThis strategy getting in long position only after the price drop- Buy the dips
The % of the drop is Determined by SMA for the first trade
The inputs of SMA and % of the drop can be adjust from the User
After that Strategy start taking safe trades if not take profit from the first trade
The safe trades are Determined by step down deviation % and by quantity
There is no Stop loss is not for one with small tolerance to getting under
if any question ask

ATR ZigZag BreakoutATR ZigZag Breakout
This strategy uses my ATR ZigZag indicator (powered by the ZigZagCore library) to scalp breakouts at volatility-filtered highs and lows.
Everyone knows stops cluster around clear swing highs and lows. Breakout traders often pile in there, too. These levels are predictable areas where aggressive orders hit the tape. The idea here is simple:
→ Let ATR ZigZag define clean, volatility-filtered pivots
→ Arm a stop market order at those pivots
→ Join the breakout when the crowd hits the level
The key to greater success in this simple strategy lies in the ZigZag. Because the pivots are filtered by ATR instead of fixed bar counts or fractals, the levels tend to be more meaningful and less noisy.
This approach is especially suited for intraday trading on volatile instruments (e.g., NQ, GC, liquid crypto pairs).
How It Works
1. Pivot detection
The ATR ZigZag uses an ATR-based threshold to confirm swing highs and lows. Only when price has moved far enough in the opposite direction does a pivot become “official.”
2. Candidate breakout level
When a new swing direction is detected and the most recent high/low has not yet been broken in the current leg, the strategy arms a stop market order at that pivot.
• Long candidate → most recent swing high
• Short candidate → most recent swing low
These “candidate trades” are shown as dotted lines.
3. Entry, SL, and TP
If price breaks through the level, the stop order is filled and a bracket is placed:
• Stop loss = ATR × SL multiplier
• Take profit = SL distance × RR multiplier
Once a level has traded, it is not reused in the same swing leg.
4. Cancel & rotate
If the market reverses and forms a new swing in the opposite direction before the level is hit, the pending order is cancelled and a new candidate is considered in the new direction.
Additional Features
• Optional session filter for backtesting specific trading hours

Double MOST with Pivot and EMAMOST Long Strategy with Multi-Filter Confirmation (Pivot + VAR Trend Filter)
This strategy combines a custom MOST stop-line structure with a moving average trend filter (EMA / VAR / ZLMA), daily pivot levels, and a 9-period VAR filter to generate clean long-only entries.
It aims to capture early trend continuations while avoiding reversals and false breakouts.
✔ Buy Conditions
A long position is opened only if all of the conditions below occur simultaneously:
MA (ort) > MOST Line (s2)
– Confirms that momentum is on the long side.
Price > Daily Pivot (pvt_gun)
– Ensures the market is trading above the day’s fair-value level.
Price > VAR(9)
– Short-term VAR filter to confirm trend strength and reduce noise.
Only the first bar where all conditions turn true generates a position.
✔ Sell Condition
A long position is closed when:
MOST Line (s2) crosses above MA (ort)
– Indicates a momentum shift against the long position.
✔ Execution Style (MetaStock-like)
Strategy operates long-only
Orders are filled on the next bar open, not on the signal bar
Commission: 0.03% (3 bps / on-binde 3)
Position size: 100% of equity per trade
This makes the behavior comparable to classical MetaStock backtesting logic.
✔ Chart Markers
Only actual trade entries and exits are drawn
No repeated signals or overlapping markers
Clean visual trade history
Purpose
This strategy is ideal for traders who want:
A structured long-only trend model
A multi-layer confirmation filter
Clean execution without repaint
High-quality entries above market structure levels

inyerneck Diaper Sniper v16 — LOW VOL V CATCHERDiaper Sniper v16 — Low-Vol Reversal Hunter
Catches dead-cat bounces and V-shaped reversals on the day’s biggest losers.
Designed for pennies and trash stocks that drop 6 %+ from recent high and snap back on any volume + green candle.
Features:
• Tiny green “D” = reversal signal
• Works on 1m → daily
• Fully adjustable filters
Best on low-float runners that bleed hard and bounce harder.
Use tiny size — it fires a lot.
Public version — code visible. No invite-only on Essential plan.
do not alter settings with out first recording defaults.. defaults are quite effective
2025 build. Test at your own risk.

Retracement Strategy [OmegaTools]Retracement Strategy is a systematic trend–retracement framework designed to identify directional opportunities after a confirmed momentum shift, and to manage exits using either trend reversals or overextension conditions. It is built around a smoothed RSI regime filter and a simple, price-based retracement trigger, making it applicable across a wide range of markets and timeframes while remaining transparent and easy to interpret.
The strategy begins by defining the underlying trend through a two-stage RSI signal. A standard RSI is computed over the user-defined Length input, then smoothed with a short moving average to reduce noise. Two symmetric thresholds are derived from the Threshold parameter: an upper band at 100 minus the threshold and a lower band at the threshold itself. When the smoothed RSI crosses above the upper band, the environment is classified as bullish and the internal trend state is set to uptrend. When the smoothed RSI crosses below the lower band, the environment is classified as bearish and the trend state becomes downtrend. When RSI moves back into the central zone between the two bands, the trend is considered neutral. In addition to the current trend, the strategy tracks the last non-neutral trend direction, which is used to detect genuine trend changes rather than transient oscillations.
Once a trend is established, the strategy looks for retracement entries in the direction of that trend. For long setups in an uptrend, it computes the lowest low over the previous Length minus one bars, excluding the current bar. A long signal is generated when price dips below this recent low while the trend state remains bullish. Symmetrically, for short setups in a downtrend, it computes the highest high over the previous Length minus one bars and enters short when price spikes above this recent high while the trend state remains bearish. This logic is designed to capture pullbacks against the prevailing RSI-defined trend, entering when the market tests or slightly violates recent extremes, rather than chasing breakouts. The candles are visually coloured to reflect the detected trend, highlighting bullish and bearish environments while keeping neutral phases distinguishable on the chart. An ATR-based measure is used solely to position the “UP” and “DN” labels on the chart for clearer visualisation of entry points; it does not directly influence position sizing or stop calculation in this implementation.
Take profit and stop loss behaviour are fully parameterized through the “Take Profit” and “Stop Loss” inputs, each offering three modes: None, Trend Change and Extension. When “Trend Change” is selected for the take profit, the strategy will only exit profitable positions when a confirmed trend reversal occurs. For a long position, this means that the strategy will close the trade when the trend state flips from uptrend to downtrend, and the last recorded trend direction validates that this is a genuine reversal rather than a neutral fluctuation; the same logic applies symmetrically for short positions. When “Extension” is selected as the take profit mode, the strategy closes profitable long trades when the smoothed RSI reaches or exceeds the upper threshold, interpreted as an overbought extension within the bullish regime, and closes profitable short trades when the smoothed RSI falls to or below the lower threshold, interpreted as an oversold extension within the bearish regime. When “None” is chosen, the strategy does not apply any explicit take profit logic, leaving trades to be managed by the stop loss settings or by user discretion in backtesting.
The stop loss parameter works in a parallel way. With “Trend Change” selected as stop loss, any open long position is closed when the trend flips from uptrend to downtrend, regardless of whether the trade is currently in profit or loss, and any open short is closed when the trend flips from downtrend to uptrend. This turns the RSI trend regime into a hard invalidation rule: once the underlying momentum structure reverses, the position is exited. With “Extension” selected for stop loss, long positions are closed when RSI falls back below the upper band and moves towards the opposite side of the range, while short positions are closed when RSI rises above the lower band and moves towards the upper side. In practice, this acts as a dynamic exit based on the oscillator moving out of a favourable context for the existing trade. Selecting “None” for stop loss disables these automatic exits, leaving only the take profit logic, if any, to manage the position. Because take profit and stop loss configuration are independent, the user can construct different profiles, such as pure trend-change exits on both sides, pure overextension exits, or a mix (for example, take profit on overextension and stop loss on trend reversal).
This strategy is designed as an analytical and backtesting framework rather than a finished plug-and-play trading system. It does not include position sizing, risk-per-trade controls, multi-timeframe confirmation, volatility filters or instrument-specific fine-tuning. Its primary purpose is to provide a clear, rule-based structure for testing retracement logic within RSI-defined trends, and to allow users to explore how different exit regimes (trend-change based versus extension based) affect performance on their instruments and timeframes of interest.
Nothing in this script or its description should be interpreted as financial advice, investment recommendation or solicitation to buy or sell any financial instrument. Past performance on backtests does not guarantee future results. The behaviour of this strategy can vary significantly across symbols, timeframes and market conditions, and correlations, volatility and liquidity can change without warning. Before considering any live application, users should thoroughly backtest and forward test the strategy on their own data, adjust parameters to their risk profile and instrument characteristics, and integrate proper money management and trade management rules. Use of this script is entirely at the user’s own risk.

15m ORB Breakout NAS100 (5m Mgmt) v6 - OptimizedOpening Range Breakout Strategy
Buy and sell signals are given upon break of market session opening range. Best utilized for 30 minute NY opening range, managed on 5 min timeframe on NAS100. Tweak the settings for higher win rate on backtesting dashboard before implementing strategy.

Trend Pullback System```{"variant":"standard","id":"36492","title":"Trend Pullback System Description"}
Trend Pullback System is a price-action trend continuation model that looks to enter on pullbacks, not breakouts. It’s designed to find high-quality long/short entries inside an already established trend, place the stop at meaningful structure, trail that stop as structure evolves, and warn you when the trade thesis is no longer valid.
Developed by: Mohammed Bedaiwi
---------------------------------
HOW IT WORKS
---------------------------------
1. Trend Detection
• The strategy defines overall bias using moving averages.
• Bullish environment (“uptrend”): price above the slower MA, fast MA above slow MA, and the slow MA is sloping up.
• Bearish environment (“downtrend”): price below the slower MA, fast MA below slow MA, and the slow MA is sloping down.
This prevents trading against chop and focuses on continuation moves in the dominant direction.
2. Pullback + Re-entry Logic
• The script waits for price to pull back into structure (support in an uptrend, resistance in a downtrend), and then push back in the direction of the main trend.
• That “push back” is the setup trigger. We don’t chase the first breakout candle — we buy/sell the retest + resume.
3. Structural Levels (“Diamonds”)
• Green diamond (below bar): bullish pivot low formed while the trend is bullish. This marks defended support.
- Use it as a re-entry zone for longs.
- Use it to trail a stop higher when you’re already long.
- Shorts can take profit here because buyers stepped in.
• Red diamond (above bar): bearish pivot high formed while the trend is bearish. This marks defended resistance.
- Use it as a re-entry zone for shorts.
- Use it to trail a stop lower when you’re already short.
- Longs can take profit here because sellers stepped in.
4. Entry Signals
• BUY arrow (green triangle up under the candle, text like “BUY” / “BUY Zone”):
- LongSetup is true.
- Trend is bullish or turning bullish.
- Price just bounced off recent defended support (green diamond) and reclaimed short-term momentum.
Meaning: enter long here or cover/exit shorts.
• SELL arrow (red triangle down above the candle):
- ShortSetup is true.
- Trend is bearish or turning bearish.
- Price just rolled down from defended resistance (red diamond) and lost short-term momentum.
Meaning: enter short here or take profit on longs.
These are the primary trade entries. They are meant to be actionable.
5. Weak Setups (“W” in yellow)
• Yellow triangle with “W”:
- A possible long/short idea is trying to form, BUT the higher-timeframe confirmation is not fully there yet.
- Think of it as early pressure / early caution, not a full signal.
• You usually watch these areas rather than jumping in immediately.
6. Exit Warning (orange “EXIT” label above a bar)
• The strategy will raise an EXIT marker when you’re in a trade and the *opposite* side just produced a confirmed setup.
- You’re short and a valid longSetup appears → EXIT.
- You’re long and a valid shortSetup appears → EXIT.
• This is basically: “Close or reduce — the other side just took control.”
• It’s not just a trailing stop hit; it’s a regime flip warning.
7. Stop, Target, and Trailing
• On every new setup, the script records:
- Initial stop: recent swing beyond the defended level (below support for longs, above resistance for shorts).
- Initial target: recent opposing swing.
• While you’re in position, if new confirming diamonds print in your favor, the stop can trail toward the new defended level.
• This creates structure-based risk management (not just fixed % or ATR).
8. Reference Levels
• The strategy also plots prior higher-timeframe closes (last week’s close, last month’s close, last year’s close). These can behave as magnets or stall points.
• They’re helpful for take-profit timing and for reading “are we trading above or below last month’s close?”
9. Momentum Panel (hidden by default)
• Internally, the script calculates an SMI-style momentum oscillator with overbought/oversold zones.
• This is optional visual confirmation and does not drive the core entry/exit logic.
---------------------------------
WHAT A TRADE LOOKS LIKE IN REAL PRICE ACTION
---------------------------------
Early warning
• Yellow W + red diamonds + red down arrows = “This is getting weak. Short setups are here.”
• You may also see something like “My Short Entry Id.” That’s where the short side actually engages.
Bearish follow-through, then exhaustion
• Price bleeds down.
• Then the orange EXIT appears.
→ Translation: “If you’re still short, close it. Buyers are stepping in hard. Risk of reversal is now high.”
Regime flip
• Right after EXIT, multiple green BUY arrows fire together (“BUY”, “BUYZone”).
• That’s the true long trigger.
→ This is where you either enter long or flip from short to long.
Expansion leg
• After that flip, price rips up for multiple candles / days / weeks.
• While it runs:
- Green diamonds appear under pullbacks → “dip buy zones / trail stop up here.”
- More BUY arrows show on minor pullbacks → continuation long / scale adds.
Distribution / topping
• Later, you start seeing new yellow W triangles again near local highs. That’s your “careful, this might be topping” warning.
• You finally get a hard red candle, and green diamonds stop stacking.
→ That’s where you tighten risk, scale out, or assume the move is mature.
In plain terms, the model is doing the following for you:
• It puts you short during weakness.
• It tells you when to get OUT of the short.
• It flips you long right as control changes.
• It gives you a structure-based trail the whole way up.
• It warns you again when momentum at the top starts cracking.
That is exactly how the logic was designed.
---------------------------------
QUICK INTERPRETATION CHEAT SHEET
---------------------------------
🔻 Red triangle + “Short Entry” near a red diamond
→ Short entry zone (or take profit on a long).
🟥 Red diamond above bar
→ Sellers defended here. Treat it as resistance. Good place to trail short stops just above that level. Avoid chasing longs straight into it.
🟨 Yellow W
→ Attention only. Early pressure / possible turn. Not fully confirmed.
🟧 EXIT (orange label)
→ The opposite side just printed a real setup. Close the old idea (cover shorts if you’re short, exit longs if you’re long). Thesis invalid.
🟩 Burst of green BUY triangles after EXIT
→ Long entry. Also a “cover shorts now” alert. This is the core money entry in bullish reversals.
💎 Green diamond below bar
→ Bulls defended that level. Good for trailing your long stop up, and good “buy the dip in trend” locations.
📈 Blue / teal MAs stacked and rising
→ Confirmed bullish structure. You’re in trend continuation mode, so dips are opportunities, not automatic exits.
---------------------------------
COLOR / SHAPE KEY
---------------------------------
• Green triangle up (“BUY”, “BUY Zone”):
Long entry / cover shorts / continuation long trigger.
• Red triangle down:
Short entry / take profit on longs / continuation short trigger.
• Orange “EXIT” label:
Opposite side just fired a real setup. The previous trade thesis is now invalid.
• Green diamond below price:
Bullish defended support in an uptrend. Use for dip buys, trailing stops on longs, and objective cover zones for shorts.
• Red diamond above price:
Bearish defended resistance in a downtrend. Use for re-entry shorts, trailing stops on shorts, and objective scale-out zones for longs.
• Yellow “W”:
Weak / early potential setup. Watch it, don’t blindly trust it.
• Moving average bands (fast MA, slow MA, Hull MA):
When stacked and rising, bullish control. When stacked and falling, bearish control.
---------------------------------
INTENT
---------------------------------
This system is built to:
• Trade with momentum, not against it.
• Enter on pullbacks into proven structure, not chase stretched breakouts.
• Automate stop/target logic around actual defended swing levels.
• Warn you when the other side takes over so you don’t give back gains.
Typical usage:
1. In an uptrend, wait for price to pull back, print a green diamond (support proved), then take the first BUY arrow that fires.
2. In a downtrend, wait for a bounce into resistance, print a red diamond (sellers proved), then take the first SELL arrow that fires.
3. Respect EXIT when it appears — that’s the model saying “this trade is done.”
---------------------------------
DISCLAIMER
---------------------------------
This script is for educational and research purposes only. It is not financial advice, investment advice, or a recommendation to buy or sell any security, cryptoasset, or derivative. Markets carry risk. Past performance does not guarantee future results. You are fully responsible for your own decisions, position sizing, risk management, and compliance with all applicable laws and regulations.

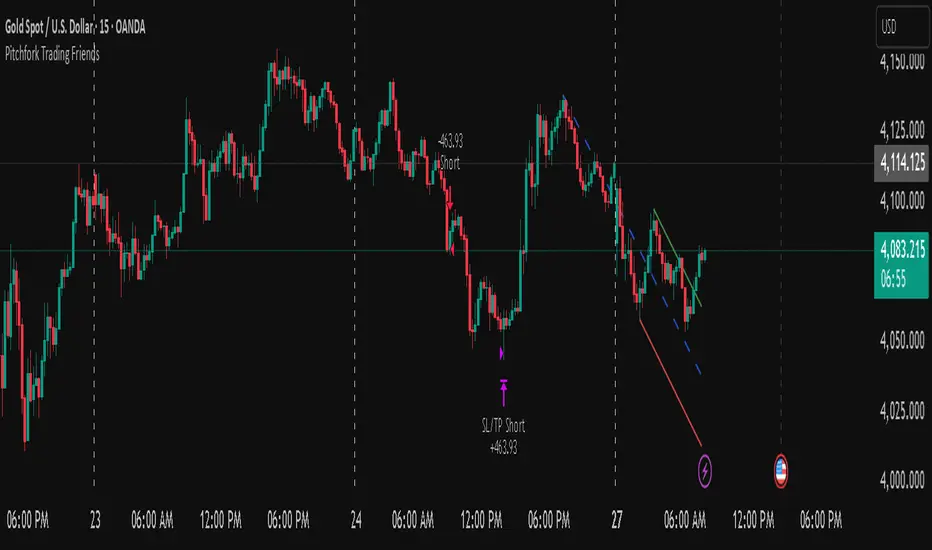
Pitchfork-Trading Friendsuses the pitchfork to give entry and exit zones, and gives a net overall summary for a beginner trader to enter into.
Adaptive Trend 1m ### Overview
The "Adaptive Trend Impulse Parallel SL/TP 1m Realistic" strategy is a sophisticated trading system designed specifically for high-volatility markets like cryptocurrencies on 1-minute timeframes. It combines trend-following with momentum filters and adaptive parameters to dynamically adjust to market conditions, ensuring more reliable entries and risk management. This strategy uses SuperTrend for primary trend detection, enhanced by MACD, RSI, Bollinger Bands, and optional volume spikes. It incorporates parallel stop-loss (SL) and multiple take-profit (TP) levels based on ATR, with options for breakeven and trailing stops after the first TP. Optimized for realistic backtesting on short timeframes, it avoids over-optimization by adapting indicators to market speed and efficiency.
### Principles of Operation
The strategy operates on the principle of adaptive impulse trading, where entry signals are generated only when multiple conditions align to confirm a strong trend reversal or continuation:
1. **Trend Detection (SuperTrend)**: The core signal comes from an adaptive SuperTrend indicator. It calculates upper and lower bands using ATR (Average True Range) with dynamic periods and multipliers. A buy signal occurs when the price crosses above the lower band (from a downtrend), and a sell signal when it crosses below the upper band (from an uptrend). Adaptation is based on Rate of Change (ROC) to measure market speed, shortening periods in fast markets for quicker responses.
2. **Momentum and Trend Filters**:
- **MACD**: Uses adaptive fast and slow lengths. In "Trend Filter" mode (default when "Use MACD Cross" is false), it checks if the MACD line is above/below the signal for long/short. In cross mode, it requires a crossover/crossunder.
- **RSI**: Adaptive period RSI must be above 50 for longs and below 50 for shorts, confirming overbought/oversold conditions dynamically.
- **Bollinger Bands (BB)**: Depending on the mode ("Midline" by default), it requires the price to be above/below the BB midline for longs/shorts, or a breakout in "Breakout" mode. Deviation adapts to market efficiency.
- **Volume Spike Filter** (optional): Entries require volume to exceed an adaptive multiple of its SMA, signaling strong impulse.
3. **Volatility Filter**: Entries are only allowed if current ATR percentage exceeds a historical minimum (adaptive), preventing trades in low-volatility ranges.
4. **Risk Management (Parallel SL/TP)**:
- **Stop-Loss**: Set at an adaptive ATR multiple below/above entry for long/short.
- **Take-Profits**: Three levels at adaptive ATR multiples, with partial position closures (e.g., 51% at TP1, 25% at TP2, remainder at TP3).
- **Post-TP1 Features**: Optional breakeven moves SL to entry after TP1. Trailing SL uses BB midline as a dynamic trail.
- All levels are calculated per trade using the ATR at entry, making them "realistic" for 1m charts by widening SL and tightening initial TPs.
The strategy enters long on buy signals with all filters met, and short on sell signals. It uses pyramid margin (100% long/short) for full position sizing.
Adaptation is driven by:
- **Market Speed (normSpeed)**: Based on ROC, tightens multipliers in volatile periods.
- **Efficiency Ratio (ER)**: Measures trend strength, adjusting periods for trending vs. ranging markets.
This ensures the strategy "adapts" without manual tweaks, reducing false signals in varying conditions.
### Main Advantages
- **Adaptability**: Unlike static strategies, parameters dynamically adjust to market volatility and trend strength, improving performance across ranging and trending phases without over-optimization.
- **Realistic Risk Management for 1m**: Wider SL and tiered TPs prevent premature stops in noisy short-term charts, while partial profits lock in gains early. Breakeven/trailing options protect profits in extended moves.
- **Multi-Filter Confirmation**: Combines trend, momentum, and volume for high-probability entries, reducing whipsaws. The volatility filter avoids flat markets.
- **Debug Visualization**: Built-in plots for signals, levels, and component checks (when "Show Debug" is enabled) help users verify logic on charts.
- **Efficiency**: Low computational load, suitable for real-time trading on TradingView with alerts.
Backtesting shows robust results on volatile assets, with a focus on sustainable risk (e.g., SL at 3x ATR avoids excessive drawdowns).
### Uniqueness
What sets this strategy apart is its **fully adaptive framework** integrating multiple indicators with real-time market metrics (ROC for speed, ER for efficiency). Most trend strategies use fixed parameters, leading to poor adaptation; here, every key input (periods, multipliers, deviations) scales dynamically within bounds, creating a "self-tuning" system. The "parallel SL/TP with 1m realism" adds custom handling for micro-timeframes: tightened initial TPs for quick wins and adaptive min-ATR filter to skip low-vol bars. Unlike generic mashups, it justifies the combination—SuperTrend for trend, MACD/RSI/BB for impulse confirmation, volume for conviction—working synergistically to capture "trend impulses" while filtering noise. The post-TP1 breakeven/trailing tied to BB adds a unique profit-locking mechanism not common in open-source scripts.
### Recommended Settings
These settings are optimized and recommended for trading ASTER/USDT on Bybit, with 1-minute chart, x10 leverage, and cross margin mode. They provide a balanced risk-reward for this volatile pair:
- **Base Inputs**:
- Base ATR Period: 10
- Base SuperTrend ATR Multiplier: 2.5
- Base MACD Fast: 8
- Base MACD Slow: 17
- Base MACD Signal: 6
- Base RSI Period: 9
- Base Bollinger Period: 12
- Bollinger Deviation: 1.8
- Base Volume SMA Period: 19
- Base Volume Spike Multiplier: 1.8
- Adaptation Window: 54
- ROC Length: 10
- **TP/SL Settings**:
- Use Stop Loss: True
- Base SL Multiplier (ATR): 3
- Use Take Profits: True
- Base TP1 Multiplier (ATR): 5.5
- Base TP2 Multiplier (ATR): 10.5
- Base TP3 Multiplier (ATR): 19
- TP1 % Position: 51
- TP2 % Position: 25
- Breakeven after TP1: False
- Trailing SL after TP1: False
- Base Min ATR Filter: 0.001
- Use Volume Spike Filter: True
- BB Condition: Midline
- Use MACD Cross (false=Trend Filter): True
- Show Debug: True
For backtesting, use initial capital of 30 USD, base currency USDT, order size 100 USDT, pyramiding 1, commission 0.1%, slippage 0 ticks, long/short margin 0%.
Always backtest on your platform and use risk management—risk no more than 1-2% per trade. This is not financial advice; trade at your own risk.

Extremum Range MA Crossover Strategy1. Principle of Work & Strategy Logic ⚙️📈
Main idea: The strategy tries to catch the moment of a breakout from a price consolidation range (flat) and the start of a new trend. It combines two key elements:
Moving Average (MA) 📉: Acts as a dynamic support/resistance level and trend filter.
Range Extremes (Range High/Low) 🔺🔻: Define the borders of the recent price channel or consolidation.
The strategy does not attempt to catch absolute tops and bottoms. Instead, it enters an already formed move after the breakout, expecting continuation.
Type: Trend-following, momentum-based.
Timeframes: Works on different TFs (H1, H4, D), but best suited for H4 and higher, where breakouts are more meaningful.
2. Justification of Indicators & Settings ⚙️
A. Moving Average (MA) 📊
Why used: Core of the strategy. It smooths price fluctuations and helps define the trend. The price (via extremes) must cross the MA → signals a potential trend shift or strengthening.
Parameters:
maLength = 20: Default length (≈ one trading month, 20-21 days). Good balance between sensitivity & smoothing.
Lower TF → reduce (10–14).
Higher TF → increase (50).
maSource: Defines price source (default = Close). Alternatives (HL2, HLC3) → smoother, less noisy MA.
maType: Default = EMA (Exponential MA).
Why EMA? Faster reaction to recent price changes vs SMA → useful for breakout strategies.
Other options:
SMA 🟦 – classic, slowest.
WMA 🟨 – weights recent data stronger.
HMA 🟩 – near-zero lag, but “nervous,” more false signals.
DEMA/TEMA 🟧 – even faster & more sensitive than EMA.
VWMA 🔊 – volume-weighted.
ZLEMA ⏱ – reduced lag.
👉 Choice = tradeoff between speed of reaction & false signals.
B. Range Extremes (Previous High/Low) 📏
Why used: Define borders of recent trading range.
prevHigh = local resistance.
prevLow = local support.
Break of these levels on close = trigger.
Parameters:
lookbackPeriod = 5: Searches for highest high / lowest low of last 5 candles. Very recent range.
Higher value (10–20) → wider, stronger ranges but rarer signals.
3. Entry & Exit Rules 🎯
Long signals (BUY) 🟢📈
Condition (longCondition): Previous Low crosses MA from below upwards.
→ Price bounced from the bottom & strong enough to push range border above MA.
Execution: Auto-close short (if any) → open long.
Short signals (SELL) 🔴📉
Condition (shortCondition): Previous High crosses MA from above downwards.
→ Price rejected from the top, upper border failed above MA.
Execution: Auto-close long (if any) → open short.
Exit conditions 🚪
Exit Long (exitLongCondition): Close below prevLow.
→ Uptrend likely ended, range shifts down.
Exit Short (exitShortCondition): Close above prevHigh.
→ Downtrend likely ended, range shifts up.
⚠️ Important: Exit = only on candle close beyond extremes (not just wick).
4. Trading Settings ⚒️
overlay = true → indicators shown on chart.
initial_capital = 10000 💵.
default_qty_type = strategy.cash, default_qty_value = 100 → trades fixed $100 per order (not lots). Can switch to % of equity.
commission_type = strategy.commission.percent, commission_value = 0.1 → default broker fee = 0.1%. Adjust for your broker!
slippage = 3 → slippage = 3 ticks. Adjust to asset liquidity.
currency = USD.
margin_long = 100, margin_short = 100 → no leverage (100% margin).
5. Visualization on Chart 📊
The strategy draws 3 lines:
🔵 MA line (thickness 2).
🔴 Previous High (last N candles).
🟢 Previous Low (last N candles).
Also: entry/exit arrows & equity curve shown in backtest.
Disclaimer ⚠️📌
Risk Warning: This description & code are for educational purposes only. Not financial advice. Trading (Forex, Stocks, Crypto) carries high risk and may lead to full capital loss. You trade at your own risk.
Testing: Always backtest & demo test first. Past results ≠ future profits.
Responsibility: Author of this strategy & description is not responsible for your trading decisions or losses.

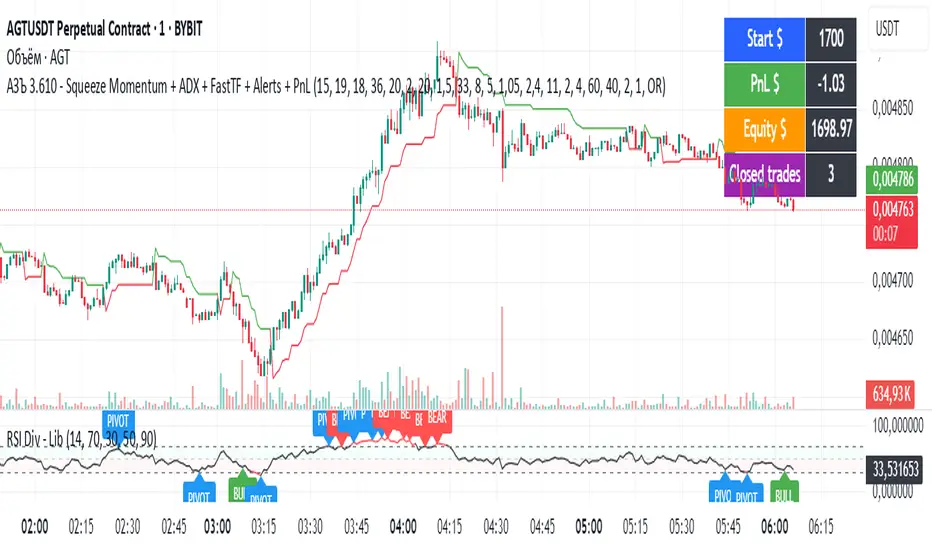
АЗЪ 3.610 - Squeeze Momentum + ADX + FastTF + Alerts + PnLStrata genius squeeze momentum + tester + adx +fast tf
Golden Cross + Support/Resistance + SL/TP + SignalsGolden Cross + Support/Resistance + SL/TP + Signals
Golden Cross + Support/Resistance + SL/TP + Signals

Script_Algo - ORB Strategy with Filters🔍 Core Concept: This strategy combines three powerful technical analysis tools: Range Breakout, the SuperTrend indicator, and a volume filter. Additionally, it features precise customization of the number of candles used to construct the breakout range, enabling optimized performance for specific assets.
🎯 How It Works:
The strategy defines a trading range at the beginning of the trading session based on a selected number of candles.
It waits for a breakout above the upper or below the lower boundary of this range, requiring a candle close.
It filters signals using the SuperTrend indicator for trend confirmation.
It utilizes trading volume to filter out false breakouts.
⚡ Strategy Features
📈 Entry Points:
Long: Candle close above the upper range boundary + SuperTrend confirmation
Short: Candle close below the lower range boundary + SuperTrend confirmation
🛡️ Risk Management:
Stop-Loss: Set at the opposite range boundary.
Take-Profit: Calculated based on a risk/reward ratio (3:1 by default).
Position Size: 10 contracts (configurable).
⚠️ IMPORTANT SETTINGS
🕐 Time Parameters:
Set the correct time and time zone!
❕ATTENTION: The strategy works ONLY with correct time settings! Set the time corresponding to your location and trading session.
📊 This strategy is optimized for trading TESLA stock!
Parameters are tailored to TESLA's volatility, and trading volumes are adequate for signal filtering. Trading time corresponds to the American session.
📈 If you look at the backtesting results, you can see that the strategy could potentially have generated about 70 percent profit on Tesla stock over six months on 5m timeframe. However, this does not guarantee that results will be repeated in the future; remain vigilant.
⚠️ For other assets, the following is required:
Testing and parameter optimization
Adjustment of time intervals and the number of candles forming the range
Calibration of stop-loss and take-profit levels
⚠️ Limitations and Drawbacks
🔗 Automation Constraints:
❌ Cannot be directly connected via Webhook to CFD brokers!
Additional IT solutions are required for automation, thus only manual trading based on signals is possible.
📉 Risk Management:
Do not risk more than 2-3% of your account per trade.
Test on historical data before live use.
Start with a demo account.
💪 Strategy Advantages
✅ Combined approach – multiple signal filters
✅ Clear entry and exit rules
✅ Visual signals on the chart
✅ Volume-based false breakout filtering
✅ Automatic position management
🎯 Usage Recommendations
Always test the strategy on historical data.
Start with small trading volumes.
Ensure time settings are correct.
Adapt parameters to current market volatility.
Use only for stocks – futures and Forex require adaptation.
📚 Suitable Timeframes - M1-M15
Only highly liquid stocks
🍀 I wish all subscribers good luck in trading and steady profits!
📈 May your charts move in the right direction!
⚠️ Remember: Trading involves risk. Do not invest money you cannot afford to lose!

Script_Algo - Fibo Correction Strategy🔹 Core Concept
The strategy is built on combining Fibonacci retracement levels, candlestick pattern confirmation, and trend filtering for trade selection. It performs well on the 1-hour timeframe across many cryptocurrency pairs. Particularly on LINKUSDT over the past year and a half, despite the not very optimal 1:1 risk/reward ratio.
The logic is simple: after a strong impulse move, the price often retraces to key Fibonacci levels (specifically, the 61.8% level). If a confirming candlestick (pattern) appears at this moment, the strategy looks for an entry in the direction of the main trend.
🔹 Indicators Used in the Strategy
ATR (Average True Range) — Used to calculate the stop-loss and take-profit levels.
EMA (9 and 21) — Additional moving averages for assessing the direction of movement (not directly used in entry conditions, but the logic can be expanded to include them).
SMA (Trend Filter, 20 by default) — The trend direction filter. Trades are only opened in its direction.
Fibonacci Levels — The 61.8% retracement level is calculated based on the high and low of the previous candle.
🔹 Entry Conditions
🟢 Long (Buy):
Previous Candle:
Must be green (close higher than open).
Must have a body not smaller than a specified minimum.
The upper wick must not exceed 30% of the body size.
→ This filters out "weak" or "indecisive" candles.
Current Candle:
Price touches or breaches the Fibonacci 61.8% retracement level from the previous range.
Closes above this level.
Closes above the Trend Filter (SMA) line.
A position is opened only if there are no other open trades at the moment.
🔴 Short (Sell):
Previous Candle:
Must be red (close lower than open).
Must have a body not smaller than a specified minimum.
The lower wick must not exceed 30% of the body size.
Current Candle:
Price touches or breaches the Fibonacci 61.8% retracement level from the previous range.
Closes below this level.
Closes below the Trend Filter (SMA) line.
A trade is opened only if there are no other open positions.
🔹 Risk Management
Stop-Loss = ATR × multiplier (default is 5).
Take-Profit = ATR × the same multiplier.
Thus, the default risk/reward ratio is 1:1, but it can be easily adjusted by changing the coefficient. Although, strangely enough, this ratio has shown the best results on some assets on the 1-hour timeframe.
🔹 Chart Visualization
Fibonacci level for Long — Green line with circles.
Fibonacci level for Short — Red line with circles.
Trend Filter line (SMA) — Blue.
🔹 Strengths of the Strategy
✅ Utilizes a proven market pattern — retracement to the 61.8% level.
✅ Further filters entries using trend and candlestick patterns.
✅ Simple, transparent logic that is easy to expand (e.g., adding other Fib levels, an EMA filter, etc.).
🔹 Limitations
⚠️ Performs better in trending markets; can generate false signals during ranging (sideways) conditions.
⚠️ The fixed 1:1 risk/reward ratio is not always optimal and could be refined.
⚠️ Performance depends on the selected timeframe and ATR parameters.
📌 Summary:
The strategy seeks corrective entries in the direction of the trend, confirmed by candlestick patterns. It is versatile and can be applied to forex pairs, cryptocurrencies, and stocks.
⚠️ Not financial advice. Pay close attention to risk management to avoid blowing your account. The strategy is not repainting — I have personally verified it through real testing — but it may not necessarily replicate the same results in the future, as the market is constantly changing. Test it, profit, and good luck to everyone!

PP_Solstice StrategyThis strategy was developed by Vinay with inputs from Warren, Dodgie and others to replicate TOS AGAIG indicators. It is available for free of use.

Professional ORB Strategy - BUY & Sell signal- Ganesh SelvarayarORB 15 mins strategy buy and sell signal, with point system for your target
