MTF Candle [Pt]The Multi-Timeframe (MTF) Candle Tool is a powerful indicator designed for traders who wish to analyze standard candle bars and Heikin Ashi candles of multiple timeframes simultaneously. This tool is ideal for traders who prefer to trade in higher timeframes while keeping a close eye on the lower timeframes for confirmation signals. The indicator works by overlaying standard candle bars or Heikin Ashi candles of a higher timeframe onto the current chart. This allows traders to quickly switch between the current timeframe and the higher timeframe, without having to switch charts.
Features
- Live, real time updating MTF candle
- Custom colors
- Heikin Ashi candle
- Heikin Ashi Inside bar highlight
Ptgambler

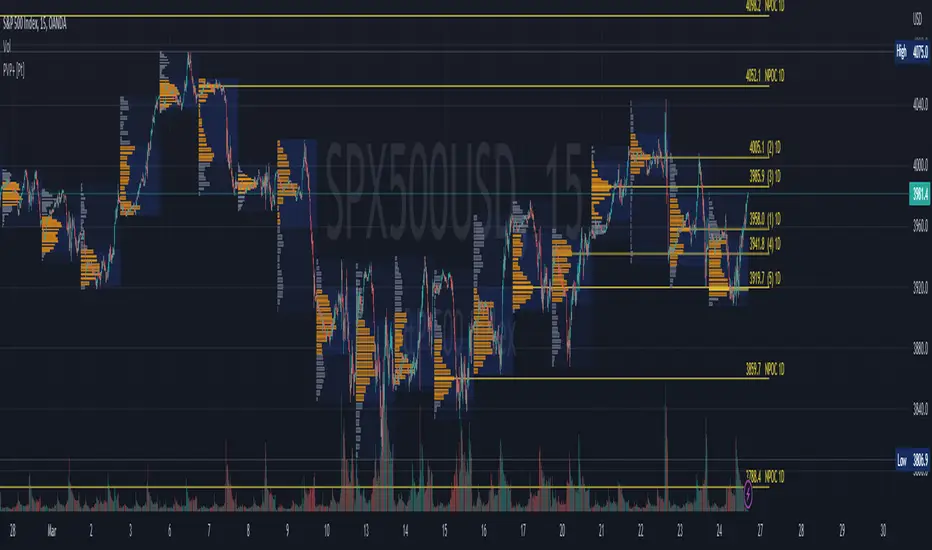
Periodic Volume Profile+ [Pt]This is a + version of my original Periodic Volume Profile indicator
This script includes the following extra unique features.
Show last X number of POC levels
- automatically draws these POC lines
- labels are shown as
- Naked POCs are labelled as NPOC
- label position and text size can be adjusted
Profile Range and Value Area background colors
- Option to color background based on periodic open/close price
Option to show Value Area High (VAH) and Value Area Low (VAL) Prices
What is Volume Profile?
Volume profile is a technical analysis tool that shows the volume of trades at different prices for a given security or market over a specific period of time.
How to effectively use it?
Identify key levels of support and resistance: The Periodic Volume Profile indicator can be used to identify key levels of support and resistance based on the volume of trades at different price levels. High volume areas can indicate strong support or resistance levels, while low volume areas can indicate areas of weakness or potential breakouts.
Assess overall supply and demand: The Periodic Volume Profile indicator can help traders assess overall supply and demand for a security. If there is high volume at a particular price level, this can indicate a high level of demand, while low volume can indicate low demand.
Use it in conjunction with other indicators: The Periodic Volume Profile indicator is best used in conjunction with other technical analysis tools. For example, you can use it with moving averages, trend lines, or other indicators to confirm signals or identify potential entry and exit points.
Consider the overall market context: It's important to consider the overall market context when interpreting volume profile data. For example, a high volume area may not necessarily indicate a strong level of support or resistance if the overall market is in a downtrend.
Monitor changes over time: Keep an eye on how the volume profile changes over time. If there are significant changes in the volume of trades at certain price levels, this could indicate a shift in market sentiment or a change in the underlying fundamentals of the security.
Soheil PKO's 5 min Hitman Scalp - 3MA + Laguerre RSI + ADX [Pt]Someone sent me this strategy found on YouTube. It is Soheil PKO's "The Best and Most Profitable Scalping Strategy" Best way to find out is to code it =)
This strategy uses Moving Average Ribbon, Laguerre RSI, and ADX. This script only displays the MA ribbon, you will need to add Laguerre RSI and ADX separately.
Long Entry Criteria:
- 16 EMA > 48 EMA > 200 SMA
- Laguerre RSI > 80
- ADX > 20
Long Exit Criterion:
- 16 EMA < 48 EMA
Short Entry Criteria:
- 16 EMA < 48 EMA < 200 SMA
- Laguerre RSI < 20
- ADX > 20
Short Exit Criterion:
- 16 EMA > 48 EMA
As mentioned in the video, risk management is very important, especially for scalping strategies. Therefore, I've added option for setting Stop Loss and Price Target in the options for you guys to play with.
All parameters are configurable.
Enjoy~~

TICK - Custom Tickers [Pt]Traditionally, the TICK index is a technical analysis indicator that shows the difference in the number of stocks that are trading on an uptick vs a downtick in a particular period of time. This indicator allows user to choose up to 40 tickers to calculate TICK.
By default, it uses the SPY Top 40 stocks, but can be changed to any tickers.
There are options to show:
- Top 7 , ie. can be used for just showing TICK for FAANGMT => $FB + $AMZN + $AAPL + $NFLX + $GOOG + $MSFT + $TSLA
- Top 10
- Top 20
- Top 30
- Top 40
Data can be displayed in candle bars, line, or both.
Enjoy~

TradePro's 2 EMA + Stoch RSI + ATR StrategySaw TradePro's "NEW BEST HIGHEST PROFITING STRATEGY WITH CRAZY RESULTS - 2 EMA+ Stochastic RSI+ ATR", and was curious on the back testing results. This strategy is an attempt to recreate it.
This strategy uses 50 / 200 EMAs, Stochastic RSI and ATR.
Long Entry Criteria:
- 50 EMA > 200 EMA
- Price closes below 50 EMA
- Stochastic RSI has gone into oversold < 20
- Stochastic RSI crosses up while making higher low from previous cross up
Short Entry Criteria:
- 50 EMA < 200 EMA
- Price closes above 50 EMA
- Stochastic RSI has gone into overbought > 80
- Stochastic RSI crosses down while making lower high from previous cross down
Stop-loss is set to ATR stop-loss
Take Profit is 2x the risk
All parameters are configurable.
Enjoy~~

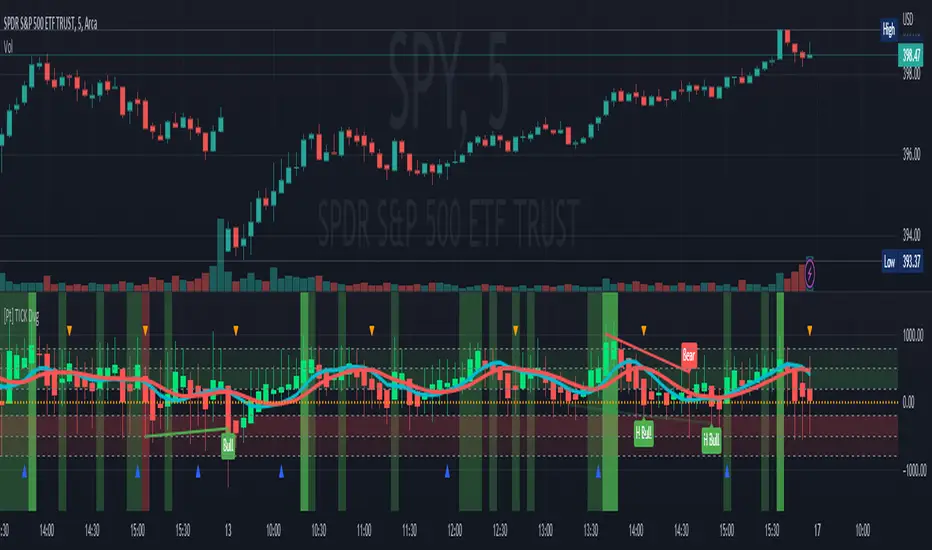
TICK Divergence + Heikin Ashi [Pt]This indicator identifies divergence between NYSE TICK and price, displays TICK in line, bar, or Heikin Ashi format, calculates various types of moving average lines and shows moving average crossovers.
What is TICK
NYSE TICK, also known as the TICK index, is a technical analysis indicator that shows the number of stocks on the New York Stock Exchange (NYSE) that are trading on an uptick or a downtick in a particular period of time. The TICK index is calculated by subtracting the number of stocks trading on a downtick from the number of stocks trading on an uptick. A reading of +1000 on the TICK index, for example, would indicate that there are 1000 more stocks trading on an uptick than on a downtick. The TICK index is often used as a measure of market sentiment, as it can provide insight into whether there is more buying or selling pressure in the market at a given time. A high TICK index reading may suggest that there is strong buying pressure, while a low TICK index reading may indicate that there is more selling pressure in the market.
The TICK index is usually very volatile, so this indicator is best suited for lower timeframes, such as 1 to 5 min charts.
Features
1) Shows bullish, bearish, hidden bullish and hidden bearish divergences
2) Three display modes for TICK data: Line, Bar, Heikin-Ashi
3) Plot various moving average lines and crossovers. Overall background
4) Configurable significant zones. Background colors will change based on closing TICK value.
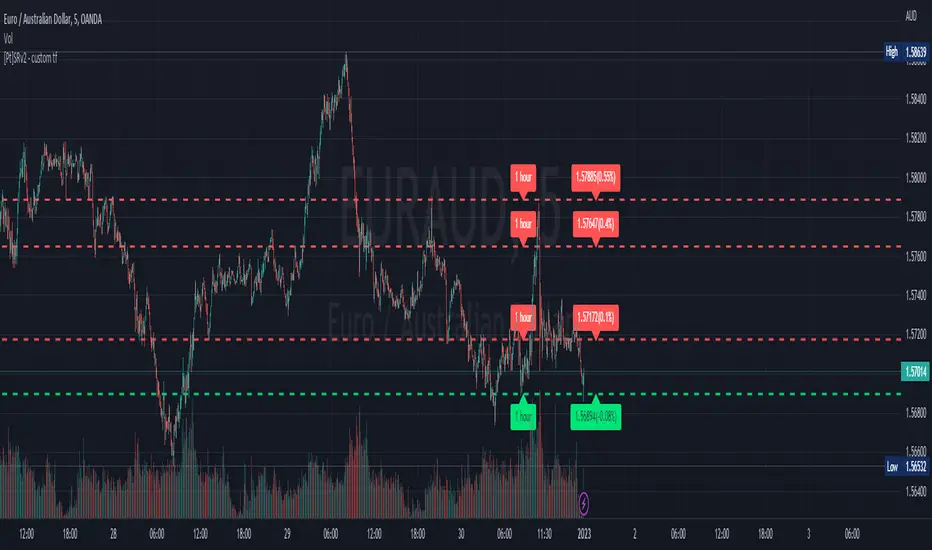
Support Resistance - Dynamic v2 w/ Timeframe optionThis script is a modification from the awesome "Support Resistance - Dynamic v2" by @LonesomeTheBlue
This script is very similar to the original indicator mentioned above, but with a modification that, in my opinion, would be very useful for many traders. It enables the option to choose different timeframe to calculate the S/R levels. Very often, traders would like to use higher timeframes to define S/R levels, rather than using the same timeframe that they are trading at. For example, if trading at 5min, we often use 15min, 30min or 1hr timeframe to define our S/R levels.
For example, below shows S/R levels from three different timeframes:
Hope you find value in this indicator~ Enjoy~