Auto Trend Channel [Anan]Hello Friends..
This is Auto Trend Channel using linear regression ,,
So helpful and smart !
Play with the options to adjust the precision.
*Note that the selected time frame in options must be > your current time frame (logic) to draw lines.
Regression

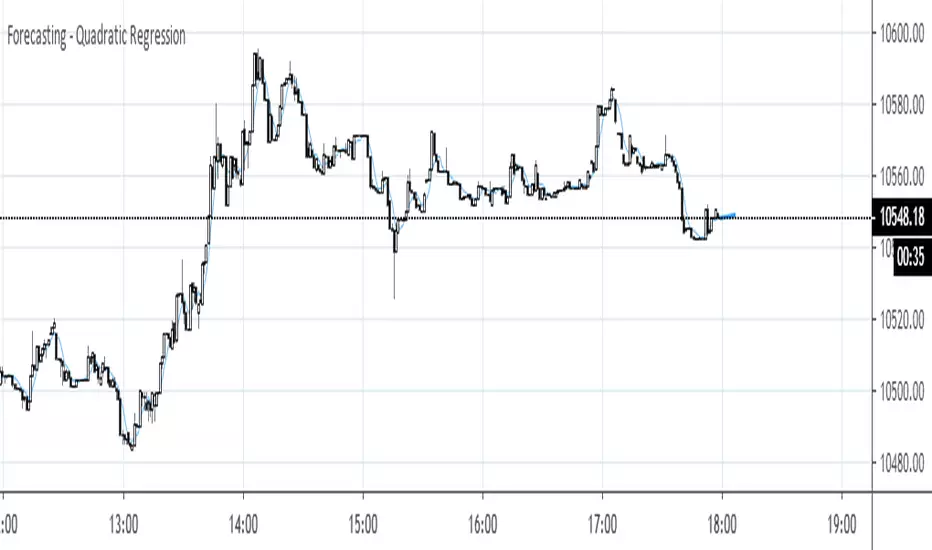
Forecasting - Quadratic RegressionThis script is written totally thanks to Alex Grover (). Here it is implemented in conjunction with the seasonal forecast I showed in one of my previous posts. It takes the calculated QReg curve and extends its last section (Season) into the future (Forecasted periods).
Forecasting - Locally Weighted Regression (rescaled)UPDATE: the original version works only with BTC. Here's a general version with rescaling.

Forecasting - Vanilla Locally Weighted RegressionThere is not much to say - just vanilla locally weighted regression in PineScript 4.
see: medium.com
also: cs229.stanford.edu

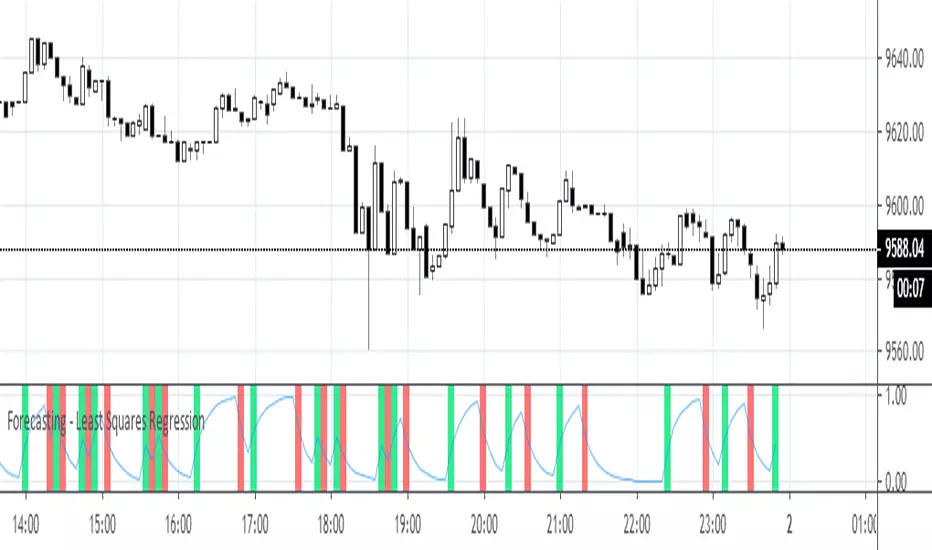
Forecasting - Least Squares RegressionTested on 5m TF with EURUSD. Settings should be modified appropriately for other TFs, lookbacks and securities. This indicator does not repaint.
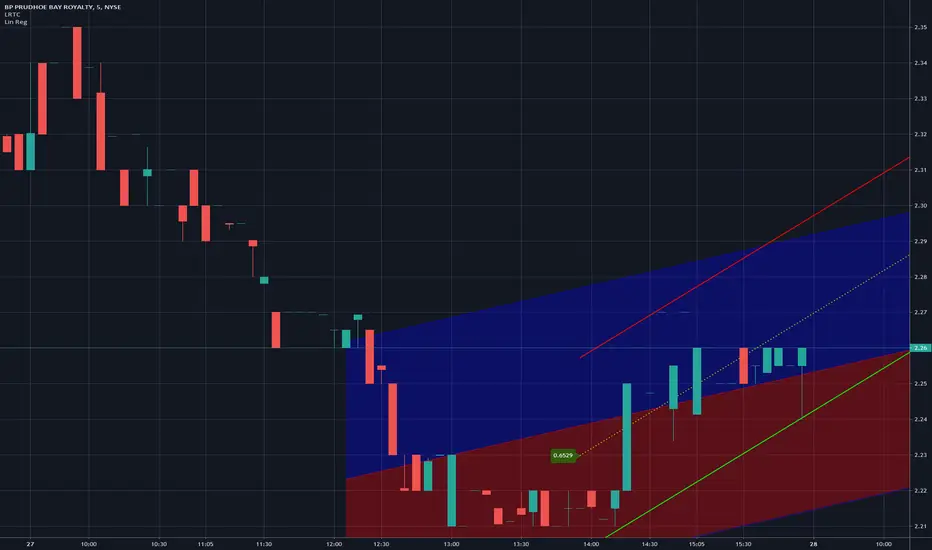
Linear Regression Trend ChannelThis is my first public release of indicator code and my PSv4.0 version of "Linear Regression Channel", as it is more commonly known. It replicates TV's built-in "Linear Regression" without the distraction of heavy red/blue fill bleeding into other indicators. We can't fill() line.new() at this time in Pine Script anyways. I entitled it Linear Regression Trend Channel, simply because it seems more accurate as a proper description. I nicely packaged this to the size of an ordinary napkin within 20 lines of compact code, simplifying the math to the most efficient script I could devise that fits in your pocket. This is commonly what my dense intricate code looks like behind the veil, and if you are wondering why there is no notes, that's because the notation is in the variable naming. I excluded Pearson correlation because it doesn't seem very useful to me, and it would comprise of additional lines of code I would rather avoid in this public release. Pearson correlation is included in my invite-only advanced version of "Enhanced Linear Regression Trend Channel", where I have taken Linear Regression Channeling to another level of fully featured novel attainability using this original source code.
Features List Includes:
"Period" adjustment
"Deviation(s)" adjustment
"Extend Method" option to extend or not extend the upper, medial, and lower channeling
Showcased in the chart below is my free to use "Enhanced Schaff Trend Cycle Indicator", having a common appeal to TV users frequently. If you do have any questions or comments regarding this indicator, I will consider your inquiries, thoughts, and ideas presented below in the comments section, when time provides it. As always, "Like" it if you simply just like it with a proper thumbs up, and also return to my scripts list occasionally for additional postings. Have a profitable future everyone!
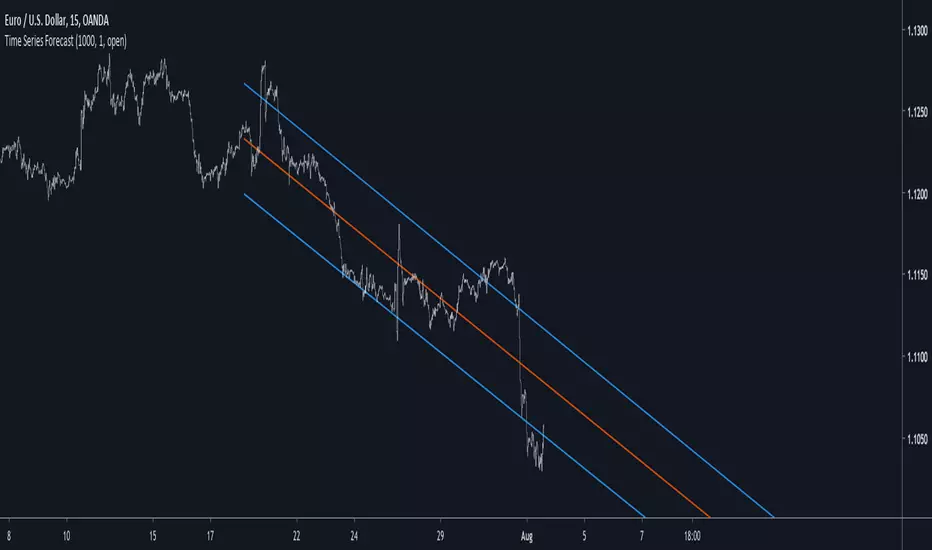
Time Series ForecastIntroduction
Forecasting is a blurry science that deal with lot of uncertainty. Most of the time forecasting is made with the assumption that past values can be used to forecast a time series, the accuracy of the forecast depend on the type of time series, the pre-processing applied to it, the forecast model and the parameters of the model.
In tradingview we don't have much forecasting models appart from the linear regression which is definitely not adapted to forecast financial markets, instead we mainly use it as support/resistance indicator. So i wanted to try making a forecasting tool based on the lsma that might provide something at least interesting, i hope you find an use to it.
The Method
Remember that the regression model and the lsma are closely related, both share the same equation ax + b but the lsma will use running parameters while a and b are constants in a linear regression, the last point of the lsma of period p is the last point of the linear regression that fit a line to the price at time p to 1, try to add a linear regression with count = 100 and an lsma of length = 100 and you will see, this is why the lsma is also called "end point moving average".
The forecast of the linear regression is the linear extrapolation of the fitted line, however the proposed indicator forecast is the linear extrapolation between the value of the lsma at time length and the last value of the lsma when short term extrapolation is false, when short term extrapolation is checked the forecast is the linear extrapolation between the lsma value prior to the last point and the last lsma value.
long term extrapolation, length = 1000
short term extrapolation, length = 1000
How To Use
Intervals are create from the running mean absolute error between the price and the lsma. Those intervals can be interpreted as possible support and resistance levels when using long term extrapolation, make sure that the intervals have been priorly tested, this mean the intervals are more significants.
The short term extrapolation is made with the assumption that the price will follow the last two lsma points direction, the forecast tend to become inaccurate during a trend change or when noise affect heavily the lsma.
You can test both method accuracy with the replay mode.
Comparison With The Linear Regression
Both methods share similitudes, but they have different results, lets compare them.
In blue the indicator and in red a linear regression of both period 200, the linear regression is always extremely conservative since she fit a line using the least squares method, at the contrary the indicator is less conservative which can be an advantage as well as a problem.
Conclusion
Linear models are good when what we want to forecast is approximately linear, thats not the case with market price and this is why other methods are used. But the use of the lsma to provide a forecast is still an interesting method that might require further studies.
Thanks for reading !

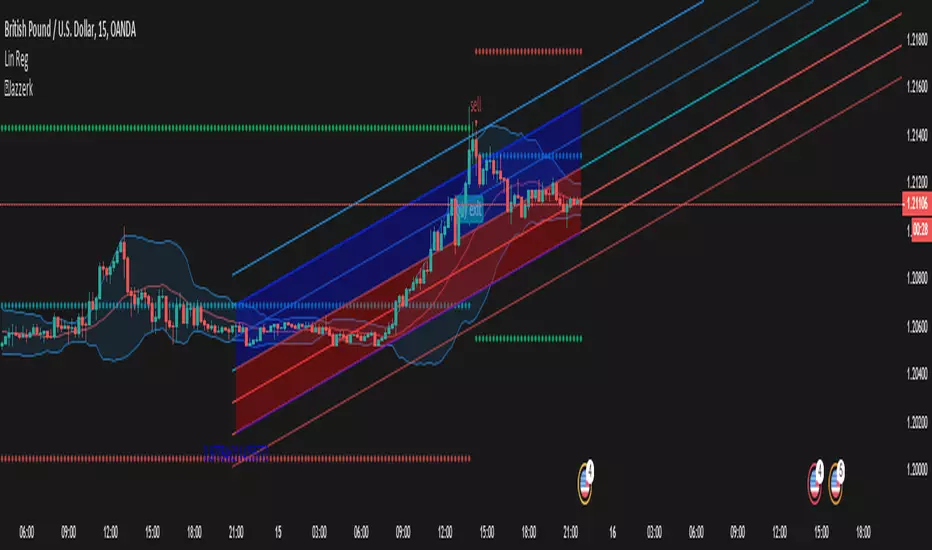
Jazzerkthis is a trading script that searches for market weak points using several indicators.
This is a request by trader Jazzerk
R2-Adaptive RegressionIntroduction
I already mentioned various problems associated with the lsma, one of them being overshoots, so here i propose to use an lsma using a developed and adaptive form of 1st order polynomial to provide several improvements to the lsma. This indicator will adapt to various coefficient of determinations while also using various recursions.
More In Depth
A 1st order polynomial is in the form : y = ax + b , our indicator however will use : y = a*x + a1*x1 + (1 - (a + a1))*y , where a is the coefficient of determination of a simple lsma and a1 the coefficient of determination of an lsma who try to best fit y to the price.
In some cases the coefficient of determination or r-squared is simply the squared correlation between the input and the lsma. The r-squared can tell you if something is trending or not because its the correlation between the rough price containing noise and an estimate of the trend (lsma) . Therefore the filter give more weight to x or x1 based on their respective r-squared, when both r-squared is low the filter give more weight to its precedent output value.
Comparison
lsma and R2 with both length = 100
The result of the R2 is rougher, faster, have less overshoot than the lsma and also adapt to market conditions.
Longer/Shorter terms period can increase the error compared to the lsma because of the R2 trying to adapt to the r-squared. The R2 can also provide good fits when there is an edge, this is due to the part where the lsma fit the filter output to the input (y2)
Conclusion
I presented a new kind of lsma that adapt itself to various coefficient of determination. The indicator can reduce the sum of squares because of its ability to reduce overshoot as well as remaining stationary when price is not trending. It can be interesting to apply exponential averaging with various smoothing constant as long as you use : (1- (alpha+alpha1)) at the end.
Thanks for reading

Momentum Regression @CosmonautCCustom momentum oscillators combined with a custom type of regression to find entries and exits.
Green arrow = long entry/buy
green circle = long exit/hedge into USD
vice versa for red arrows and circles
No risk management/strategy/backtesting done yet. Purely indicator form so far.
Enjoy!

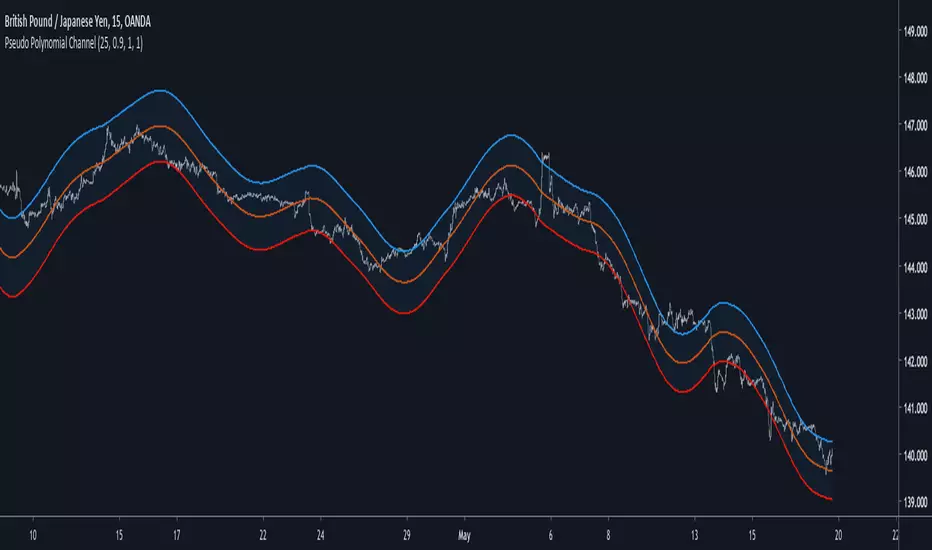
Pseudo Polynomial ChannelIntroduction
Back when i started using pine i made a script called periodic channel who aimed to rescale an average correlated sine wave to the price...don't worked very well. So i tried to fix problems induced by the indicator without much success, i had to redo it from scratch while abandoning the idea of rescaling correlated smooth functions to the price, at that time i also received requests regarding polynomial channel, some plateformes included this indicator, this led me to the idea to estimate it in order to both respond to the periodic channel problems and the requests i received, i have tried many many things and recently i tweaked a linear extrapolation to have an approximation.
Linear Extrapolation To Pseudo Polynomial Regression
I could be wrong but a polynomial regression must use constant parameters in order to provide a really smooth output, at least constant for a set of time. The moving averages forms (Savitzky-Golay moving average) who smooth polynomials across a window to the data don't have such smoothness, so how to estimate a polynomial regression while having a parameter providing control over the smoothness, a response to this is by using a recursive linear extrapolation. I posted a linear extrapolation indicator long ago, i used the same formula while adding a function to morph the output and the input in the form of :
morph * output + (1-morph) * input
How can this provide an estimate of a polynomial regression ? Well i'm not even sure myself but if you use the output as input (morph = 1) for the linear extrapolation function you should get a rough estimate of a line, this is what i thought at first and it proved to be right
Based on this observation i thought that it would be possible to get polynomial results by lowering morph, and as expected it worked well but showed a periodic pattern, this is why i smooth k in line 10.
0.9 for morph work well, higher values create sometimes smoother results but damage heavily the estimation.
Parameters
Morph have been introduced earlier, it control the amount of output and input the linear extrapolation should process, lower values create rougher but more stables results, if you see that the estimation is going nuts lower morph or change length, also lower length if you increase morph .
High overshoot, morph to 0.8 can help have a better estimation at the cost of less smoothness.
Length control the indicator smoothing, this parameter differ heavily from other filters, therefore low values can create mid/long term smoothing, it can also depend on which market instrument you are applying it, so there are no fixed optimal length.
Mult control how spread the bands are, to do so mult multiply the cumulative mean error, you can change this error measurement by anything you want like standard deviation/atr/range but take into account that you may create a separate parameter to control the error instead of length . Mult can be a float and like length can have different optimal values depending on the market the indicator is applied to.
Flatten do exactly what is name imply, it flatten the overall output to have a better estimation, can be a float. The result is less smooth.
Flatten = 2
More Exemples
BTCUSD length = 25 and mult = 4
XPDUSD length = 25 and mult = 1
ALPHABET length = 6 and morph = 0.99
Conclusion
I tried to estimate a polynomial channel by using recursion in the linear extrapolation function. This build is way more stable than the periodic channel but its still a bit inaccurate in my opinion. I hope this code can still help someone build something really nice, if so share your results :)
I apologize for those expecting a legit polynomial channel build but i really don't know how to do that, as i said parameters for the regression must be constants, i hope it still fine :)
Thanks for reading !

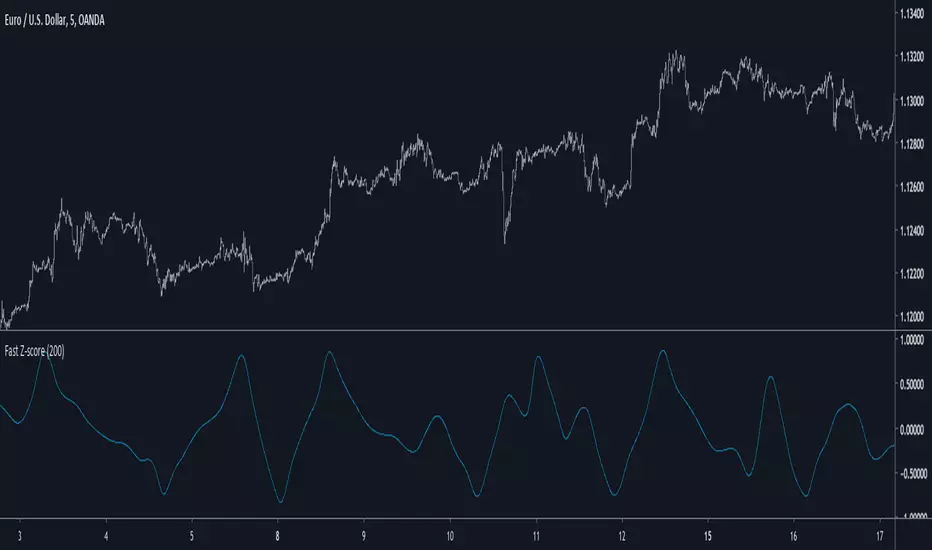
Fast Z-ScoreIntroduction
The ability of the least squares moving average to provide a great low lag filter is something i always liked, however the least squares moving average can have other uses, one of them is using it with the z-score to provide a fast smoothing oscillator.
The Indicator
The indicator aim to provide fast and smooth results. length control the smoothness.
The calculation is inspired from my sample correlation coefficient estimation described here
Instead of using the difference between a moving average of period length/2 and a moving average of period length , we use the difference between a lsma of period length/2 and a lsma of period length , this difference is then divided by the standard deviation. All those calculations use the price smoothed by a moving average as source.
The yellow version don't divide the difference by a standard deviation, you can that it is less reactive. Both version have length = 200
Conclusion
I presented a smooth and responsive version of a z-score, the result could be used to estimate an even faster lsma by using the line rescaling technique and our indicator as correlation coefficient.
Hope you like it, feel free to modify it and share your results ! :)
Notes
I have been requested a lot of indicators lately, from mt4 translations to more complex time series analysis methods, this accumulation of work made that it is impossible for me to publish those within a short period of time, also some are really complex. I apologize in advance for the inconvenience, i will try to do my best !
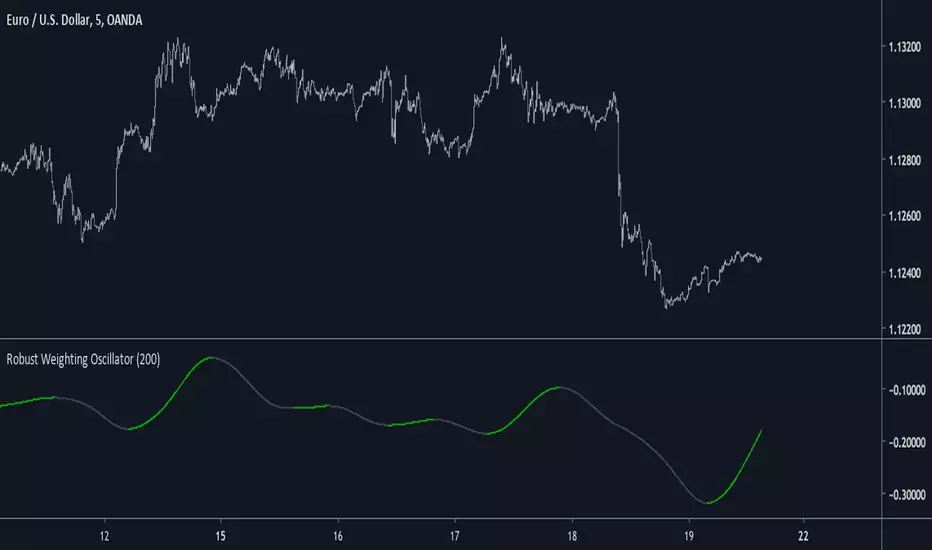
Robust Weighting OscillatorIntroduction
A simple oscillator using a modified lowess architecture, good in term of smoothness and reactivity.
Lowess Regression
Lowess or local regression is a non-parametric (can be used with data not fitting a normal distribution) smoothing method. This method fit a curve to the data using least squares.
In order to have a lowess regression one must use tricube kernel for the weightings w , the weightings are determined using a k-nearest-neighbor model.
lowess is then calculated like so :
Σ (wG(y-a-bx)^2)
Our indicator use G , a , b and remove the square as well as replacing x by y
Conclusion
The oscillator is simple and nothing revolutionary but its still interesting to have new indicators.
Lowess would be a great method to be made on pinescript, i have an estimate but its not that good. Some codes use a simple line equation in order to estimate a lowess smoother, i can describe it as ax + b where a is a smooth oscillator, b some kind of filter defined by lp + bp with lp a smooth low pass filter and bp a bandpass filter, x is a variable dependent of the smoothing span.
Dorsey InertiaThis indicator was originally developed by Donald Dorsey (Stocks & Commodities, V.13:9 (September, 1995): "Refining the Relative Volatility Index").
Inertia is based on Relative Volatility Index (RVI) smoothed using linear regression.
In physics, inertia is the tendency of an object to resist to acceleration. Dorsey chose this name because he believes that trend and inertia are related and that it takes more effort and energy to reverse the direction of a stock or market than to keep it in the same direction. He argues that the volatility is the simplest and most accurate measure of inertia.
When the indicator is below 50, it signals bearish market sentiment and when the indicator is above 50 it signals a bullish trend.
Good luck!

Kirshenbaum BandsThis indicator was originally developed by Paul Kirshenbaum, a mathematician with a Ph.D. in economics from New York University.
It uses the standard error of linear regression lines of the closing price to determine band width. This has the effect of measuring volatility around the current trend, rather than measuring volatility for changes in trend.
Good luck!

HLC Banded Quadratic RegressionHigh/Low/Close Banded Quadratic Regression is now available through this implementation, free for all to use. It's simple purpose is to plot multiple independent parabolic curvatures using a matrix equation that best fits the non-linear data sets of high, low, and close. Features include an available dark background disabled by default for the overlay chart, adjustable regression period, and a banding lines width adjustment. If you have any comments regarding this indicator, I will consider your thoughts and ideas presented below.

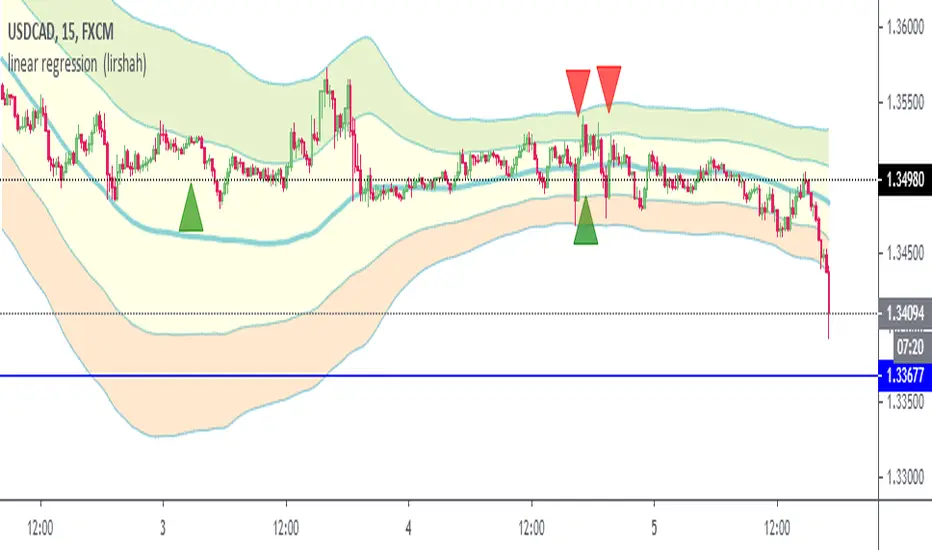
linear regression channel (lirshah)linear regression channel is an indicator which has been written according to linear regression and exponential moving average (ema).
the indicator nicely shows major trend and key levels and has a good performance on almost all pairs and time frames.
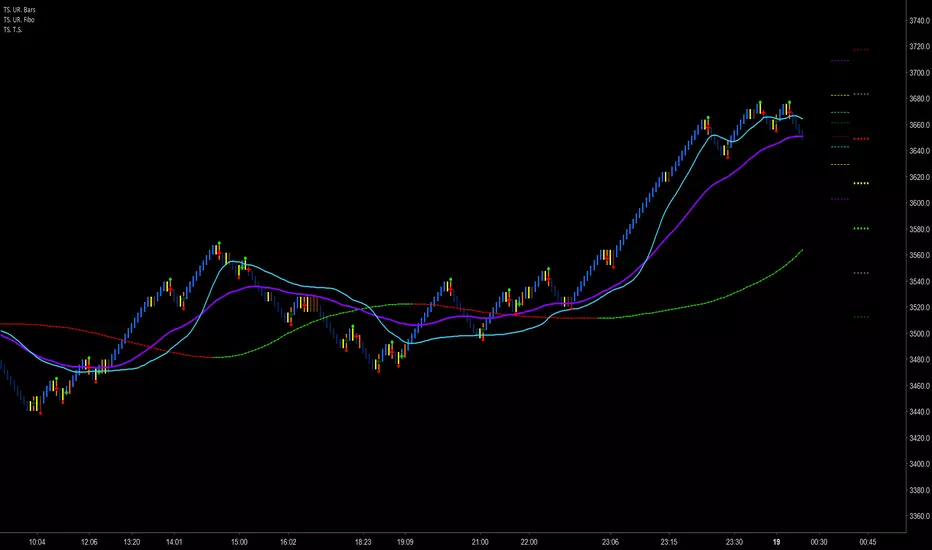
Trader Set - Trailing StopThis is the last tool for my methodology. It provides additional levels of support / resistance that you can use for trailing stop. Like every single tool in this toolbox and methodology, the formula being used is unique and totally original and you can't find it any where else.
Please don't contact me for getting access to these tools, they are only available for my students. Right now, the English version of the website and learning material is under development and soon, when they are ready I'll post a comment under every single script related to this methodology for those who are interested in participating for the course.
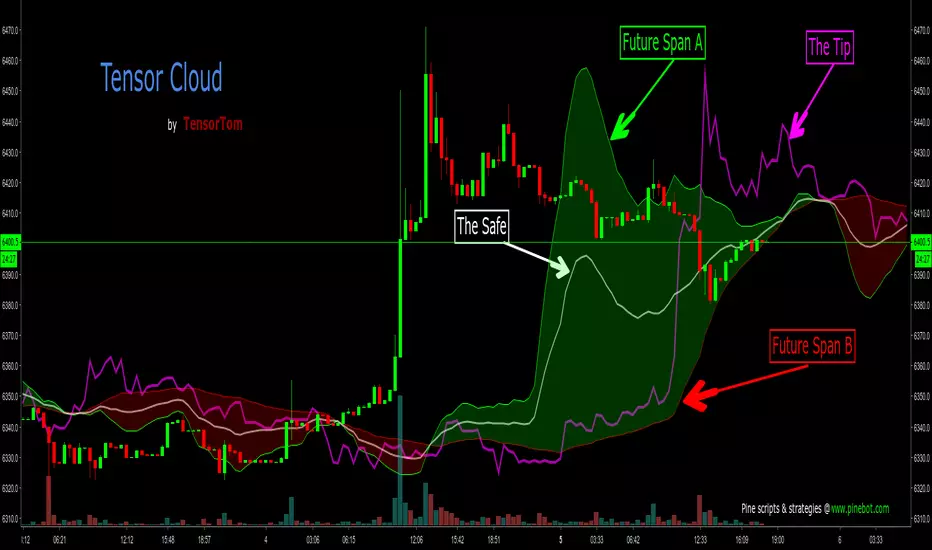
Tensor CloudIntroducing the Tensor Cloud. This is probably the best indicator I've come up with so far. I'm really proud of it. Ichimoku is a brilliant system. It's been around for over half a century and I praise Goichi Hosoda for his brilliant work. However, it's time for something new. I love math and this indicator really showcases that. The Tensor Cloud is an indicator of its own. It is not related to Ichimoku at all. The only thing they have in common is that they both form clouds. The maths in Tensor Cloud are 100% apart.
The Tensor Cloud is mostly comprised of some special forms of linear regression. Let's do a rundown.
Future Span A (Green)
This is one predictor using a linear regression technique. Future Span A is one of the two lines that makes up a Tensor Cloud. From here on out it will traditionally be colored green. It can be used as both a predictor on its own and comprising the Tensor Cloud. This can also be viewed as sort of a long signal when crossing up Future Span B. This line can also be used to help identify levels of support and resistance.
Future Span B (Red)
This is another form of linear regression meant specifically to work alongside Future Span A. This is the second line that comprises a Tensor Cloud. From here on out it will traditionally be colored red. It can be used both as a predictor on its own and comprising the Tensor Cloud. This can also be viewed as sort of a short signal when crossing down through Future Span A. This line can also be used to help identify levels of support and resistance.
Safe (White)
The Safe is a moving average taken of Future Span A and Future Span B. It is highly predictive. From here on out it will traditionally be colored white.
Tip (Fuchsia)
This is yet another form of regression and is highly predictive. The Tip can also be used to help judge trend strength and probability of reversal. More study is of course needed. More on that later in this description. From here on out it will traditionally be colored fuchsia. This line can also be used to help identify levels of support and resistance.
The Tensor Cloud
The space between Future Span A and Future Span B is shaded in green or red, depending on which Future Span is on top. If Future Span A is on top, the Tensor Cloud will be green. This is considered a long signal. If Future Span B is on top, the Tensor Cloud will be colored red. This is a short signal. Attention should also be given to other factors such as:
The position of price in relation to the Tensor Cloud (Under, inside or above).
The position of Tip in relation to the Tensor Cloud.
Crosses of Future Span A and Future Span B.
Tensor Twist
Whenever Future Span A and Future Span B cross (In either direction), this is called a Tensor Twist. If Future Span A is crossing up, this is a long Tensor Twist. If Future Span B is crossing up, this is a short Tensor Twist.
Closing Summary
Much study needs to be done. This is a brand new technique. It's up to all of you to help figure out the best ways to use it. I may still add other components to this indicator but it's pretty solid as is. You will notice that the two integer inputs are set to 27. Twenty-seven is a very important number in mathematics. The details of that are beyond the scope of this description but from here on out, the traditional setting for those will be 27. You will notice that I am not yet releasing the source code to this indicator. For now, it will remain protected. Once I have enough feedback and we're all happy with the final result, I will release the code for the world to have. I have no wish of keeping this closed-source (As profitable as that might be). I just want it to help as many people as possible.
Please share this on social media so we can attract as many testers to give feedback as possible. For publishing this for free, that's all I ask in return. That way it will be as solid as possible when I release the source code.
Enjoy!
Quadratic Regression Slope [DW]This is a study geared toward identifying price trends using Quadratic regression.
Quadratic regression is the process of finding the equation of a parabola that best fits the set of data being analyzed.
In this study, first a quadratic regression curve is calculated, then the slope of the curve is calculated and plotted.
Custom bar colors are included. The color scheme is based on whether the slope is positive or negative, and whether it is increasing or decreasing.

