Volume-Supported Linear Regression Trend TableThe "Volume-Supported Linear Regression Trend Table" (VSLRT Table) script helps traders identify buy and sell opportunities by analyzing price trends and volume dynamics across multiple timeframes. It uses linear regression to calculate the trend direction and volume strength, visually representing this data with color-coded signals on the chart and in a table. Green signals indicate buying opportunities, while red signals suggest selling, with volume acting as confirmation of trend strength. Traders can use these signals for both short and long positions, with additional risk management and multi-timeframe validation to enhance the strategy.
------------------------------------------------------------------------------
To use the "Volume-Supported Linear Regression Trend Table" (VSLRT Table) script in a trading strategy, you would incorporate it into your decision-making process to identify potential buy and sell opportunities based on the trend and volume dynamics. Here’s how you could apply it for trading:
1. Understanding the Key Elements:
Trend Direction (Slope of Price): The script uses linear regression to assess the trend direction of the price. If the price slope is positive, the asset is likely in an uptrend; if it's negative, the asset is in a downtrend.
Volume-Backed Signals: The buy or sell signal is not only based on the price trend but also on volume. Volume is crucial in validating the strength of a trend; large volume often indicates strong interest in a direction.
2. Interpreting the Table and Signals:
The table displayed at the bottom-right of your TradingView chart gives you a clear overview of the trends across different timeframes:
Trend Colors:
Green hues (e.g., ccol11, ccol12, etc.): Indicate a buying trend supported by volume.
Red hues (e.g., ccol21, ccol22, etc.): Indicate a selling trend supported by volume.
Gray: Indicates weak or unclear trends where no decisive direction is present.
Buy/Sell Signals:
The script plots triangles on the chart:
Upward triangle below the bar signals a potential buy.
Downward triangle above the bar signals a potential sell.
3. Building a Trading Strategy:
Here’s how you can incorporate the script’s information into a trading strategy:
Buy Signal (Long Entry):
Look for green triangles (indicating a buy signal) below a bar.
Confirm that the trend color in the table for the relevant timeframe is green, which shows that the buy signal is supported by strong volume.
Ensure that the price is in an uptrend (positive slope) and that volume is increasing on upward moves, as this indicates buying interest.
Execute a long position when these conditions align.
Sell Signal (Short Entry):
Look for red triangles (indicating a sell signal) above a bar.
Confirm that the trend color in the table for the relevant timeframe is red, which shows that the sell signal is supported by strong volume.
Ensure that the price is in a downtrend (negative slope) and that volume is increasing on downward moves, indicating selling pressure.
Execute a short position when these conditions align.
Exiting the Trade:
Exit a long position when a sell signal (red triangle) appears, or when the trend color in the table shifts to red.
Exit a short position when a buy signal (green triangle) appears, or when the trend color in the table shifts to green.
4. Multi-Timeframe Confirmation:
The script provides trends across multiple timeframes (tf1, tf2, tf3), which can help in validating your trade:
Short-Term Trading: Use shorter timeframes (e.g., 3, 5 minutes) for intraday trades. If both short and medium timeframes align in trend direction (e.g., both showing green), it strengthens the signal.
Longer-Term Trading: If you are trading on a higher timeframe (e.g., daily or weekly), confirm that the lower timeframes align with your intended trade direction.
5. Adding Risk Management:
Stop-Loss: Place stop-losses below recent lows (for long trades) or above recent highs (for short trades) to minimize risk.
Take Profit: Consider taking profit at key support/resistance levels or based on a fixed risk-to-reward ratio (e.g., 2:1).
Example Strategy Flow:
For Long (Buy) Trade:
Signal: A green triangle appears below a candle (Buy signal).
Trend Confirmation: Check that the color in the table for your selected timeframe is green, confirming the trend is supported by volume.
Execute Long: Enter a long trade if the price is trending upward (positive price slope).
Exit Long: Exit when a red triangle appears above a candle (Sell signal) or if the trend color shifts to red in the table.
For Short (Sell) Trade:
Signal: A red triangle appears above a candle (Sell signal).
Trend Confirmation: Check that the color in the table for your selected timeframe is red, confirming the trend is supported by volume.
Execute Short: Enter a short trade if the price is trending downward (negative price slope).
Exit Short: Exit when a green triangle appears below a candle (Buy signal) or if the trend color shifts to green in the table.
6. Fine-Tuning:
Backtesting: Before trading live, use TradingView’s backtesting features to test the strategy on historical data and optimize the settings (e.g., length of linear regression, timeframe).
Combine with Other Indicators: Use this strategy alongside other technical indicators (e.g., RSI, MACD) for better confirmation.
In summary, the script helps identify trends with volume support, giving more confidence in buy/sell decisions. Combining these signals with risk management and multi-timeframe analysis can create a solid trading strategy.
Regression

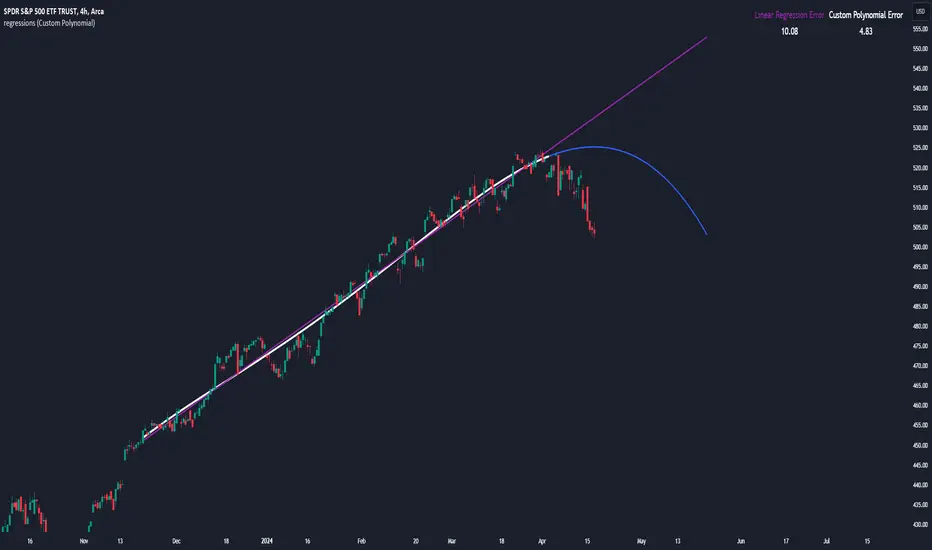
Periodic Linear Regressions [LuxAlgo]The Periodic Linear Regressions (PLR) indicator calculates linear regressions periodically (similar to the VWAP indicator) based on a user-set period (anchor).
This allows for estimating underlying trends in the price, as well as providing potential supports/resistances.
🔶 USAGE
The Periodic Linear Regressions indicator calculates a linear regression over a user-selected interval determined from the selected "Anchor Period".
The PLR can be visualized as a regular linear regression (Static), with a fit readjusting for new data points until the end of the selected period, or as a moving average (Rolling), with new values obtained from the last point of a linear regression fitted over the calculation interval. While the static method line is prone to repainting, it has value since it can further emphasize the linearity of an underlying trend, as well as suggest future trend directions by extrapolating the fit.
Extremities are included in the indicator, these are obtained from the root mean squared error (RMSE) between the price and calculated linear regression. The Multiple setting allows the users to control how far each extremity is from the other.
Periodic Linear Regressions can be helpful in finding support/resistance areas or even opportunities when ranging in a channel.
The anchor - where a new period starts - can be shown (in this case in the top right corner).
The shown bands can be visualized by enabling Show Extremities in settings ( Rolling or Static method).
The script includes a background gradient color option for the bands, which only applies when using the Rolling method.
The indicator colors can be suggestive of the detected trend and are determined as follows:
Method Rolling: a gradient color between red and green indicates the trend; more green if the output is rising, suggesting an uptrend, and more red if it is decreasing, suggesting a downtrend.
Method Static: green if the slope of the line is positive, suggesting an uptrend, red if negative, suggesting a downtrend.
🔶 DETAILS
🔹 Anchor Type
When the Anchor Type is set to Periodic , the indicator will be reset when the "Anchor Period" changes, after which calculations will start again.
An anchored rolling line set at First Bar won't reset at a new session; it will continue calculating the linear regression from the first bar to the last; in other words, every bar is included in the calculation. This can be useful to detect potential long-term tops/bottoms.
Note that a linear regression needs at least two values for its calculation, which explains why you won't see a static line at the first bar of the session. The rolling linear regression will only show from the 3rd bar of the session since it also needs a previous value.
🔹 Rolling/Static
When Anchor Type is set at Periodic , a linear regression is calculated between the first bar of the chosen session and the current bar, aiming to find the line that best fits the dataset.
The example above shows the lines drawn during the session. The offered script, though, shows the last calculated point connected to the previous point when the Rolling method is chosen, while the Static method shows the latest line.
Note that linear regression needs at least two values, which explains why you won't see a static line at the first bar of the session. The rolling line will only show from the 3rd bar of the session since it also needs a previous value.
🔶 SETTINGS
Method: Indicator method used, with options: "Static" (straight line) / "Rolling" (rolling linear regression).
Anchor Type: "Periodic / First Bar" (the latter works only when "Method" is set to "Rolling").
Anchor Period: Only applicable when "Anchor Type" is set at "Periodic".
Source: open, high, low, close, ...
Multiple: Alters the width of the bands when "Show Extremities" is enabled.
Show Extremities: Display one upper and one lower extremity.
🔹 Color Settings
Mono Color: color when "Bicolor" is disabled
Bicolor: Toggle on/off + Colors
Gradient: Background color when "Show extremities" is enabled + level of gradient
🔹 Dashboard
Show Dashboard
Location of dashboard
Text size

Support Resistance DynamicsThe Support Resistance Dynamics indicator is an advanced technical analysis tool designed to identify and visualize key support and resistance levels in real-time. This innovative indicator stands out from traditional support and resistance tools by employing a dynamic approach that adapts to market conditions.
Key Features:
Dynamic Level Calculation: Unlike static support and resistance indicators, this tool continuously updates levels based on recent price action, providing traders with the most relevant and up-to-date information.
Logarithmic Scale Option: The indicator offers a unique logarithmic scale feature, essential for analyzing long-term trends or assets with significant price changes. This allows for more accurate level plotting across various timeframes and price ranges.
Customizable Display: Users can adjust the number of support and resistance lines displayed, allowing for a clean and uncluttered chart view while focusing on the most significant levels.
Adaptive Slope Calculation: The indicator uses an innovative approach to calculate the slope of support and resistance lines, offering options from dynamic adaptation to fixed long-term periods. This ensures the lines remain relevant in both trending and ranging markets.
Enhanced Visualization: With customizable line colors, styles, and transparency, traders can easily distinguish between support and resistance levels, improving chart readability and analysis.
Flexible Period Settings: From dynamic calculations based on recent pivots to fixed long-term periods, the indicator adapts to various trading styles and timeframes.
The Support Resistance Dynamics indicator is particularly useful for:
Identifying potential reversal points in trends
Setting more accurate entry and exit points for trades
Placing stop-loss orders with greater precision
Recognizing breakout levels for potential new trends
By combining dynamic calculation methods with customizable visual elements, this indicator provides traders with a powerful tool for market analysis. Whether you're a day trader looking for short-term opportunities or a long-term investor analyzing macro trends, the Support Resistance Dynamics indicator offers valuable insights to enhance your trading strategy.
This indicator is provided for informational and educational purposes only. It should not be considered as financial advice or a recommendation to buy or sell any financial instrument. Past performance is not indicative of future results. Trading involves significant risk of loss. Users should conduct their own research and due diligence before making any investment decisions. The creator of this indicator is not responsible for any losses incurred from its use. Always test thoroughly on demo accounts before applying to live trading.

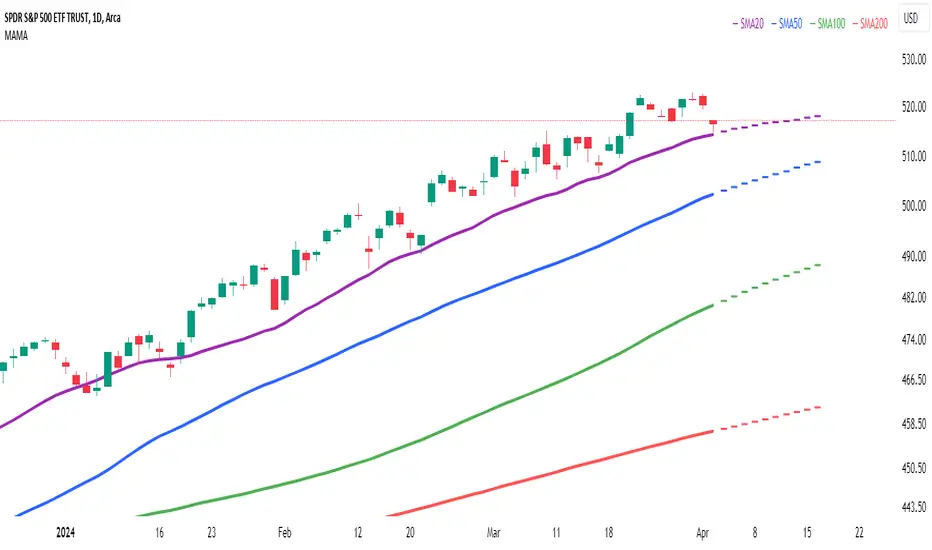
Multi Adaptive Moving Average (MAMA)The Multi Adaptive Moving Average (MAMA) indicator is an advanced tool for technical analysis, designed to provide traders with a detailed understanding of market trends and potential future price movements. This indicator utilizes multiple Simple Moving Averages (SMAs) and forecasting techniques to enhance decision-making processes.
Simple Moving Averages (SMAs):
Short MA (20-period): This moving average is highly responsive to price changes, making it ideal for capturing short-term trends. It helps traders identify quick market shifts and potential entry or exit points.
Mid MA (50-period): This average strikes a balance between short- and long-term trends, offering insights into the market's intermediate direction. It aids in confirming the sustainability of short-term trends.
Long MA (100-period): By smoothing out price data over a longer period, this moving average is useful for identifying long-term trends and filtering out short-term volatility.
Very Long MA (200-period): Often considered a critical indicator for determining the overall market trend, this average helps confirm the direction and strength of long-term movements.
Forecasting:
Flat Forecast: This approach assumes that prices will remain constant in the near future, which is particularly useful in markets trading sideways without a clear trend direction.
Linear Regression Forecast: This method uses historical data to project future price movements, offering a dynamic forecast based on existing trends. It helps traders anticipate potential price changes and plan their strategies accordingly.
Advantages:
Comprehensive Trend Analysis: By incorporating four different SMAs, the indicator provides a layered view of market trends across various timeframes. This enables traders to identify potential trend reversals and continuations with greater accuracy.
Predictive Insights: The forecasting feature offers traders a forward-looking perspective, enabling them to anticipate market movements and adjust their trading strategies proactively. This can be especially advantageous in volatile markets.
Customization: The MAMA indicator is highly customizable, allowing traders to adjust parameters such as the source of price data and the inclusion of the current unclosed candle. This flexibility ensures that the indicator can be tailored to fit different trading styles and market conditions.
Visual Clarity: The use of distinct colors for each SMA and their forecasts enhances visual interpretation, making it easier for traders to quickly assess market conditions and make informed decisions. The inclusion of a legend further aids in distinguishing between the different moving averages and their respective forecasts.
How to Use:
Trend Confirmation: Use the alignment of the SMAs to confirm market trends. For example, when the Short MA crosses above the Mid and Long MAs, it may indicate a bullish trend, while the opposite could suggest a bearish trend.
Entry and Exit Points: Look for crossovers between the SMAs as potential signals for entering or exiting trades. The forecasts can help in timing these decisions by providing an expectation of future price movements.
Risk Management: Utilize the Very Long MA to set stop-loss and take-profit levels, as it reflects the long-term trend and can help in avoiding trades against the prevailing market direction.
The MAMA indicator is intended to support technical analysis and should not be used as the sole basis for making trading decisions. Financial markets are inherently uncertain, and past performance does not guarantee future results. Traders should use this tool in conjunction with other analytical methods and consider their risk tolerance and investment objectives. It is advisable to conduct thorough research and consult with a financial advisor before making significant trading decisions. Always be aware of the risks involved in trading and invest only what you can afford to lose.
Viking Fun PredictОсобая благодарность за оригинальную идею Александру Горчакову
Индикатор предсказывает вырастет или упадет цена на следующей свече
Индикатор отображает красные или зеленые кружки над каждой из свечей
Зеленый кружок прогноз роста
Красный кружок прогноз падения
Индикатор выдает прогноз для шестой свечи на основе пяти свечей
Индикатор берет цены максимумов и минимумов пяти свечей и усредняет их, получая 5 значений. На основе полученных 5 значений строится линейная регрессия
Если линия линейной регрессии возрастает, то индикатор прогнозирует рост (зеленый кружок)
Если линия линейной регрессии возрастает, то индикатор прогнозирует падение (красный кружок)
Компания Викинг предоставляет профессиональный сервис, позволяющий реализовать арбитражные стратегии и маркет-мейкинг, осуществляет обучение трейдеров-арбитражеров.
---------------------------
Special thanks for the original idea to Alexander Gorchakov
The indicator predicts whether the price will rise or fall on the next candle
The indicator displays red or green circles above each of the candles
Green circle growth forecast
Red circle forecast of the fall
The indicator gives a forecast for the sixth candle based on five candles
The indicator takes the prices of the highs and lows of five candles and averages them, getting 5 values. Based on the obtained 5 values, a linear regression is constructed
If the linear regression line increases, the indicator predicts growth (green circle)
If the linear regression line increases, the indicator predicts a fall (red circle)
Viking provides a professional service that allows you to implement arbitrage strategies and market making, and provides training for arbitrage traders.

Machine Learning Signal FilterIntroducing the "Machine Learning Signal Filter," an innovative trading indicator designed to leverage the power of machine learning to enhance trading strategies. This tool combines advanced data processing capabilities with user-friendly customization options, offering traders a sophisticated yet accessible means to optimize their market analysis and decision-making processes. Importantly, this indicator does not repaint, ensuring that signals remain consistent and reliable after they are generated.
Machine Learning Integration
The "Machine Learning Signal Filter" employs machine learning algorithms to analyze historical price data and identify patterns that may not be immediately apparent through traditional technical analysis. By utilizing techniques such as regression analysis and neural networks, the indicator continuously learns from new data, refining its predictive capabilities over time. This dynamic adaptability allows the indicator to adjust to changing market conditions, potentially improving the accuracy of trading signals.
Key Features and Benefits
Dynamic Signal Generation: The indicator uses machine learning to generate buy and sell signals based on complex data patterns. This approach enables it to adapt to evolving market trends, offering traders timely and relevant insights. Crucially, the indicator does not repaint, providing reliable signals that traders can trust.
Customizable Parameters: Users can fine-tune the indicator to suit their specific trading styles by adjusting settings such as the temporal synchronization and neural pulse rate. This flexibility ensures that the indicator can be tailored to different market environments.
Visual Clarity and Usability: The indicator provides clear visual cues on the chart, including color-coded signals and optional display of signal curves. Users can also customize the table's position and text size, enhancing readability and ease of use.
Comprehensive Performance Metrics: The indicator includes a detailed metrics table that displays key performance indicators such as return rates, trade counts, and win/loss ratios. This feature helps traders assess the effectiveness of their strategies and make data-driven decisions.
How It Works
The core of the "Machine Learning Signal Filter" is its ability to process and learn from large datasets. By applying machine learning models, the indicator identifies potential trading opportunities based on historical data patterns. It uses regression techniques to predict future price movements and neural networks to enhance pattern recognition. As new data is introduced, the indicator refines its algorithms, improving its accuracy and reliability over time.
Use Cases
Trend Following: Ideal for traders seeking to capitalize on market trends, the indicator helps identify the direction and strength of price movements.
Scalping: With its ability to provide quick signals, the indicator is suitable for scalpers aiming for rapid profits in volatile markets.
Risk Management: By offering insights into trade performance, the indicator aids in managing risk and optimizing trade setups.
In summary, the "Machine Learning Signal Filter" is a powerful tool that combines the analytical strength of machine learning with the practical needs of traders. Its ability to adapt and provide actionable insights makes it an invaluable asset for navigating the complexities of financial markets.
The "Machine Learning Signal Filter" is a tool designed to assist traders by providing insights based on historical data and machine learning techniques. It does not guarantee profitable trades and should be used as part of a comprehensive trading strategy. Users are encouraged to conduct their own research and consider their financial situation before making trading decisions. Trading involves significant risk, and it is possible to lose more than the initial investment. Always trade responsibly and be aware of the risks involved.

FVG Price & Volume Graph [LuxAlgo]The FVG Price & Volume Graph tool plot recently detected fair value gaps relative to the volume traded within their area during their formation. This allows us to effectively visualize significant fair value gaps caused by high liquidity.
The indicator also returns levels from the fair value gaps areas average with the highest associated volume.
Do note that the indicator can consider the chart's visible range when being computed, which will recalculate the indicator when the chart's visible range changes.
🔶 USAGE
Fair Value Gaps (FVG) are core price action concepts occurring when the disparity between supply and demand is significant. Price has a tendency to come back to those areas and mitigating them, that is filling them.
The provided tools allow for effective visualization of both FVG's area's height as well as the volume originating from their creation, which is defined by the total traded volume located within the FVG during its creation. FVG's with more associated volume are displayed to the rightmost of the chart.
Users can determine the amount of most recent FVG's to display from the "Display Amount" setting. Disabling the "Consider Mitigation" setting will return mitigated FVGs in the plot, which can be useful to know where most FVGs were located.
We can use the area average of the FVGs with the most associated volume as potential support/resistance levels. Users can extend more FVG's averages by increasing the "Highest Volume Averages" setting.
🔹 Visualizing Volume/Price Relationships of FVG's
A linear regression is fit between FVG's areas average and their associated volume, with this linear regression helping us see where FVG's with specific volume might be located in the future based on existing FVG's.
Note that FVG's do not tend to exhibit linear relationships with their associated volume, the provided linear regression can give a general sense of tendency, but nothing necessarily accurate.
🔶 DETAILS
🔹 Intrabar Data TF
Given a formation of three candles causing an FVG, the volume traded within that FVG area is obtained by looking at the lower timeframe intrabar candles located within the intermediary candle of the formation. The volume of the intrabar candles located within the FVG areas is added up to obtain the associated volume of the FVG.
Using a lower "Intrabar Data TF" allows obtaining more precise volume results, at the cost of computation time and data availability (if there is a high difference between the "Intrabar Data TF" and the chart TF then less FVG can have their associated volume calculated due to Tradingview limitations).
🔹 Display
Users have access to multiple graphical settings affecting how the indicator is displayed.
The "Graph Resolution" setting determines the length of the X axis, with higher values returning more precise results on the location of FVGs over the X axis. Users can also control the number of labels displayed on the X-axis using the numerical input to the right of "Show X-Axis Labels".
Additionally, users can color FVG areas using a gradient relative to the size of the area, or the volume associated with the FVG.
🔶 SETTINGS
Display Amount: Amount of most recent FVGs to display.
Highest Volume Averages: Amount of FVG averages levels with the highest volume to display and extend.
Consider Mitigation: Only display unmitigated FVGs.
Filter FVGs Outside Visible Range: Only display FVGs areas that are located within the user chart visible range.
Intrabar Data TF: Timeframe used to obtain intrabar data. Should be lower than the user chart timeframe.

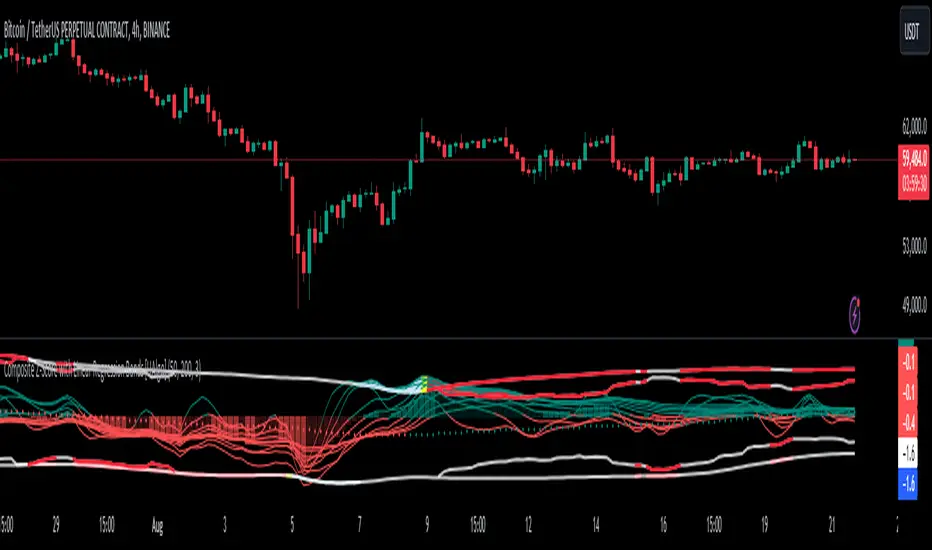
Composite Z-Score with Linear Regression Bands [UAlgo]The Composite Z-Score with Linear Regression Bands is a technical indicator designed to provide traders with a comprehensive analysis of price momentum, volatility, and volume. By combining multiple moving averages with slope analysis, volume/volatility compression-expansion metrics, and Z-Score calculations, this indicator aims to highlight potential breakout and breakdown points with high accuracy. The inclusion of linear regression bands further enhances the analysis by providing dynamic support and resistance levels, which adapt to market conditions. This makes the indicator particularly useful in identifying overbought/oversold conditions, volume squeezes, and the overall direction of the trend.
🔶 Key Features
Multi-Length Slope Calculation: The indicator uses multiple Hull Moving Averages (HMA) across various lengths to calculate slope angles, which are then converted into Z-Scores. This helps in capturing both short-term and long-term price momentum.
Volume/Volatility Composite Analysis: By calculating a composite value derived from both volume and volatility, the indicator identifies periods of compression (squeezes) and expansion, which are crucial for detecting potential breakout opportunities.
Linear Regression Bands: The inclusion of dynamic linear regression bands provides traders with adaptive support and resistance levels. These bands are enhanced by the composite value, which adjusts the band width based on market conditions, offering a clearer view of possible price reversals.
Overbought/Oversold Detection: The indicator highlights overbought and oversold conditions by comparing Z-Scores against the upper and lower bounds of the regression bands, which can signal potential reversal points.
Customizable Inputs: Users can customize key parameters such as the lengths of the moving averages, the regression band period, and the number of deviations used for the bands, allowing for flexibility in adapting the indicator to different market environments.
🔶 Interpreting the Indicator
Z-Score Plots: The individual Z-Score plots represent the normalized slope of the Hull Moving Averages over different periods. Positive values indicate upward momentum, while negative values suggest downward momentum. The combined Z-Sum provides a broader view of the overall market momentum.
Composite Value: The composite value is a ratio of volume to volatility, which highlights periods of market compression and expansion. When the composite value rises, it suggests increasing market activity, often preceding a breakout.
Why are we calculating values for multiple lengths?
The Composite Z-Score with Linear Regression Bands indicator employs a multi-timeframe analysis by calculating Z-scores for various moving average lengths. This approach provides a more comprehensive view of market dynamics and helps to identify trends and potential reversals across different timeframes. By considering multiple lengths, we can:
Capture a broader range of market behaviors: Different moving average lengths capture different aspects of price movement. Shorter lengths are more sensitive to recent price changes, while longer lengths provide a smoother representation of the underlying trend.
Reduce the impact of noise: By combining Z-scores from multiple lengths, we can help to filter out some of the noise that can be present in shorter-term data and obtain a more robust signal.
Enhance the reliability of signals: When Z-scores from multiple lengths align, it can increase the confidence in the identified trend or potential reversal. This can help to reduce the likelihood of false signals.
In essence, calculating values for multiple lengths allows the indicator to provide a more nuanced and reliable assessment of market conditions, making it a valuable tool for traders and analysts.
Linear Regression Bands: The central line represents the linear regression of the Z-Sum, while the upper and lower bands represent the dynamic resistance and support levels, respectively. The deviation from the regression line indicates the strength of the current trend. When price moves beyond these bands, it may signal an overbought (above upper band) or oversold (below lower band) condition.
Volume/Volatility Squeeze: When the price moves between the regression bands and the volume/volatility-adjusted bands, the market is in a squeeze. Breakouts from this squeeze can lead to significant price moves, which are indicated by the filling of areas between the Z-Score plots and the bands.
Color Interpretation: The indicator uses color changes to make it easier to interpret the data. Teal colors generally indicate upward momentum or strong conditions, while red suggests downward momentum or weakening conditions. The intensity of the color reflects the strength of the signal.
Overbought/Oversold Signals: The indicator marks potential overbought and oversold conditions when Z-Scores cross above or below the upper and lower regression bands, respectively. These signals are crucial for identifying potential reversal points in the market.
🔶 Disclaimer
Use with Caution: This indicator is provided for educational and informational purposes only and should not be considered as financial advice. Users should exercise caution and perform their own analysis before making trading decisions based on the indicator's signals.
Not Financial Advice: The information provided by this indicator does not constitute financial advice, and the creator (UAlgo) shall not be held responsible for any trading losses incurred as a result of using this indicator.
Backtesting Recommended: Traders are encouraged to backtest the indicator thoroughly on historical data before using it in live trading to assess its performance and suitability for their trading strategies.
Risk Management: Trading involves inherent risks, and users should implement proper risk management strategies, including but not limited to stop-loss orders and position sizing, to mitigate potential losses.
No Guarantees: The accuracy and reliability of the indicator's signals cannot be guaranteed, as they are based on historical price data and past performance may not be indicative of future results.
Regression Indicator [BigBeluga]Regression Indicator
Indicator Overview:
The Regression Indicator is designed to help traders identify trends and potential reversals in price movements. By calculating a regression line and a normalized regression indicator, it provides clear visual signals for market direction, aiding in making informed trading decisions. The indicator dynamically updates with the latest market data, ensuring timely and relevant signals.
Key Features:
⦾ Calculations
Regression Indicator: Calculates the linear regression coefficients (slope and intercept) and derives the normalized distance close from the regression line.
// @function regression_indicator is a Normalized Ratio of Regression Lines with close
regression_indicator(src, length) =>
sum_x = 0.0
sum_y = 0.0
sum_xy = 0.0
sum_x_sq = 0.0
distance = 0.0
// Calculate Sum
for i = 0 to length - 1 by 1
sum_x += i + 1
sum_y += src
sum_xy += (i + 1) * src
sum_x_sq += math.pow(i + 1, 2)
// Calculate linear regression coefficients
slope = (length * sum_xy - sum_x * sum_y)
/ (length * sum_x_sq - math.pow(sum_x, 2))
intercept = (sum_y - slope * sum_x) / length
// Calculate Regression Indicator
y1 = intercept + slope
distance := (close - y1)
distance_n = ta.sma((distance - ta.sma(distance, length1))
/ ta.stdev(distance, length1), 10)
⦿ Reversion Signals:
Marks potential trend reversal points.
⦿ Trend Identification:
Highlights when the regression indicator crosses above or below the zero line, signaling potential trend changes.
⦿ Color-Coded Candles:
Changes candle colors based on the regression indicator's value.
⦿ Arrow Markers:
Indicate trend directions on the chart.
⦿ User Inputs
Regression Length: Defines the period for calculating the regression line.
Normalization Length: Period used to normalize the regression indicator.
Signal Line: Length for averaging the regression indicator to generate signals.
Main Color: Color used for plotting the regression line and signals.
The Regression Indicator is a powerful tool for analyzing market trends and identifying potential reversal points. With customizable inputs and clear visual aids, it enhances the trader's ability to make data-driven decisions. The dynamic nature of the indicator ensures it remains relevant with up-to-date market information, making it a valuable addition to any trading strategy."

Multi-Regression StrategyIntroducing the "Multi-Regression Strategy" (MRS) , an advanced technical analysis tool designed to provide flexible and robust market analysis across various financial instruments.
This strategy offers users the ability to select from multiple regression techniques and risk management measures, allowing for customized analysis tailored to specific market conditions and trading styles.
Core Components:
Regression Techniques:
Users can choose one of three regression methods:
1 - Linear Regression: Provides a straightforward trend line, suitable for steady markets.
2 - Ridge Regression: Offers a more stable trend estimation in volatile markets by introducing a regularization parameter (lambda).
3 - LOESS (Locally Estimated Scatterplot Smoothing): Adapts to non-linear trends, useful for complex market behaviors.
Each regression method calculates a trend line that serves as the basis for trading decisions.
Risk Management Measures:
The strategy includes nine different volatility and trend strength measures. Users select one to define the trading bands:
1 - ATR (Average True Range)
2 - Standard Deviation
3 - Bollinger Bands Width
4 - Keltner Channel Width
5 - Chaikin Volatility
6 - Historical Volatility
7 - Ulcer Index
8 - ATRP (ATR Percentage)
9 - KAMA Efficiency Ratio
The chosen measure determines the width of the bands around the regression line, adapting to market volatility.
How It Works:
Regression Calculation:
The selected regression method (Linear, Ridge, or LOESS) calculates the main trend line.
For Ridge Regression, users can adjust the lambda parameter for regularization.
LOESS allows customization of the point span, adaptiveness, and exponent for local weighting.
Risk Band Calculation:
The chosen risk measure is calculated and normalized.
A user-defined risk multiplier is applied to adjust the sensitivity.
Upper and lower bounds are created around the regression line based on this risk measure.
Trading Signals:
Long entries are triggered when the price crosses above the regression line.
Short entries occur when the price crosses below the regression line.
Optional stop-loss and take-profit mechanisms use the calculated risk bands.
Customization and Flexibility:
Users can switch between regression methods to adapt to different market trends (linear, regularized, or non-linear).
The choice of risk measure allows adaptation to various market volatility conditions.
Adjustable parameters (e.g., regression length, risk multiplier) enable fine-tuning of the strategy.
Unique Aspects:
Comprehensive Regression Options:
Unlike many indicators that rely on a single regression method, MRS offers three distinct techniques, each suitable for different market conditions.
Diverse Risk Measures: The strategy incorporates a wide range of volatility and trend strength measures, going beyond traditional indicators to provide a more nuanced view of market dynamics.
Unified Framework:
By combining advanced regression techniques with various risk measures, MRS offers a cohesive approach to trend identification and risk management.
Adaptability:
The strategy can be easily adjusted to suit different trading styles, timeframes, and market conditions through its various input options.
How to Use:
Select a regression method based on your analysis of the current market trend (linear, need for regularization, or non-linear).
Choose a risk measure that aligns with your trading style and the market's current volatility characteristics.
Adjust the length parameter to match your preferred timeframe for analysis.
Fine-tune the risk multiplier to set the desired sensitivity of the trading bands.
Optionally enable stop-loss and take-profit mechanisms using the calculated risk bands.
Monitor the regression line for potential trend changes and the risk bands for entry/exit signals.
By offering this level of customization within a unified framework, the Multi-Regression Strategy provides traders with a powerful tool for market analysis and trading decision support. It combines the robustness of regression analysis with the adaptability of various risk measures, allowing for a more comprehensive and flexible approach to technical trading.

TrendMaster ProTrendMaster Pro: A Comprehensive Trend Analysis Tool for Long-Term Investors
TrendMaster Pro is an advanced technical indicator designed to provide long-term investors with a robust and comprehensive analysis of market trends. This sophisticated tool operates exclusively on daily timeframes, making it ideal for those focused on long-term investment strategies. By combining multiple analytical approaches, TrendMaster Pro offers investors a powerful means to assess trend quality and make informed decisions.
Automatic Trend Detection
At the heart of TrendMaster Pro lies its ability to automatically identify the most statistically significant trend. The indicator analyzes various timeframes ranging from 1000 to 5000 days, selecting the one that exhibits the highest correlation. This feature ensures that investors are always working with the most relevant trend data, eliminating the subjectivity often associated with manual trend identification.
The trend detection algorithm employs a regression analysis approach, evaluating approximately 80,000 different trend alternatives each day. Each potential trend is assigned a score based on criteria such as trend density, deviation from regression, and the number of price points near the trend's floor and ceiling. The trend with the highest score is then selected and displayed on the chart.
Comprehensive Scoring System
TrendMaster Pro employs a multi-faceted scoring system that evaluates four key aspects of a trend, providing a holistic view of its quality and potential. Each aspect is scored on a scale of 0 to 10, with the overall trend quality score being a weighted average of these individual scores.
1. Length Score
The Length Score measures the duration of the detected trend. Longer trends receive higher scores, reflecting increased reliability and significance. This score is calculated by normalizing the auto-selected period (which ranges from 1000 to 5000 days) to a scale of 5 to 10.
For example, if the auto-selected period is 3000 days, it would receive a score of around 7.5. This emphasizes the importance of long-term trends in investment decision-making, as they tend to be more stable and indicative of underlying market forces.
2. Strength Score
The Strength Score utilizes Pearson's Correlation Coefficient to assess trend strength. This statistical measure gauges the linear relationship between price and trend projection. A value closer to 1 indicates a strong positive correlation, reinforcing confidence in the trend direction based on historical price movements.
The indicator translates the Pearson's Correlation Coefficient into a score from 0 to 10. For instance, a correlation coefficient of 0.95 might translate to a Strength Score of 8, indicating a strong and reliable trend.
3. Performance Score
The Performance Score compares the asset's Compound Annual Growth Rate (CAGR) to a chosen benchmark, typically a major index like the S&P 500. This score provides insight into how well the asset is performing relative to the broader market.
The CAGR is calculated using the formula: CAGR = (Ending Value / Beginning Value)^(1/n) - 1, where n is the number of years. The Performance Score is then determined by comparing this CAGR to the benchmark's CAGR over the same period. A higher score indicates outperformance relative to the benchmark.
4. Level Score
The Level Score evaluates the current price position within the trend channel. Lower prices within the channel receive higher scores, suggesting potential value or buying opportunities. This score helps identify possible entry points based on historical trend behavior.
For example, if the current price is near the lower boundary of the trend channel, it might receive a Level Score of 9, indicating a potentially attractive entry point.
Visual Representation
TrendMaster Pro provides a clear visual representation of the detected trend by displaying a regression channel on the chart. This channel consists of three lines: a middle line representing the main trend, and upper and lower lines representing standard deviations from the main trend.
The channel offers a quick visual reference for support and resistance levels, helping investors identify potential entry and exit points. The color and style of these lines can be customized to suit individual preferences.
Detailed Information Table
A comprehensive table presents all scores and relevant data, allowing for quick and easy interpretation of the trend analysis. This table includes:
The auto-selected trend length
The Pearson's Correlation Coefficient
The asset's CAGR and the benchmark's CAGR
Individual scores for Length, Strength, Performance, and Level
The overall Trend Quality Score
This table provides investors with a clear, at-a-glance summary of the trend's key characteristics and quality.
Practical Application
To use TrendMaster Pro effectively, investors should consider the following:
Focus on the overall Trend Quality Score as a primary indicator of trend strength and reliability.
Use the Length Score to gauge the trend's longevity and potential stability.
Pay attention to the Strength Score to assess how well the price action aligns with the identified trend.
Utilize the Performance Score to compare the asset's performance against the broader market.
Consider the Level Score when timing entries, looking for opportunities when prices are relatively low within the trend channel.
Use the visual trend channel as a guide for potential support and resistance levels.
Limitations and Considerations
While TrendMaster Pro offers powerful insights, it's important to remember that no indicator can predict future market movements with certainty. The tool should be used in conjunction with fundamental analysis and other market information.
Additionally, as the indicator is designed for daily charts and long-term analysis, it may not be suitable for short-term trading strategies. Users should also be aware that past performance does not guarantee future results, even with strong trend indications.
Conclusion
TrendMaster Pro represents a significant advancement in trend analysis for long-term investors. By combining automatic trend detection, comprehensive scoring, and benchmark comparison, it offers a powerful tool for those seeking to make informed, data-driven investment decisions. Its ability to objectively assess trend quality across multiple dimensions provides investors with a valuable edge in navigating complex market conditions.
For investors looking to deepen their understanding of market trends and enhance their long-term investment strategies, TrendMaster Pro offers a sophisticated yet accessible solution. As with any investment tool, users are encouraged to thoroughly familiarize themselves with its features and interpret its outputs in the context of their overall investment approach.

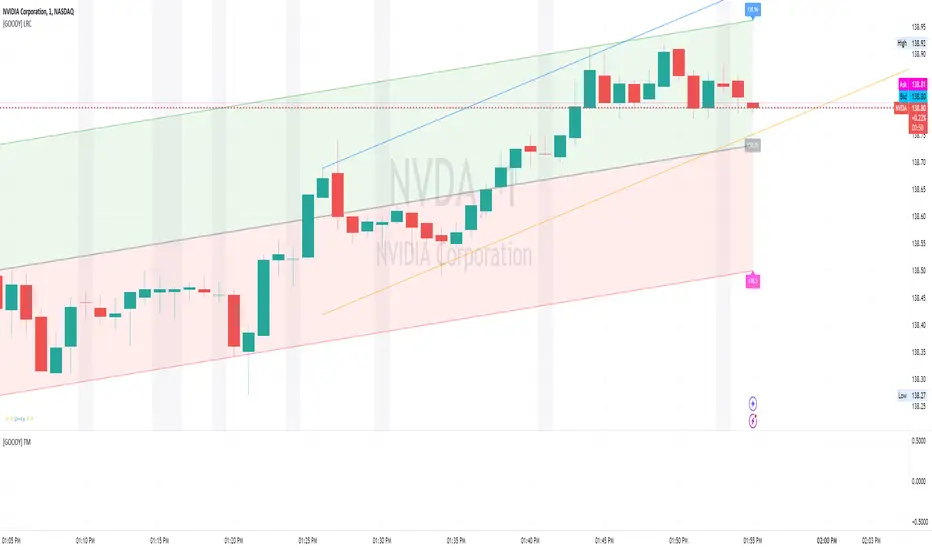
Linear Regression Channel [GOODY]Linear Regression Channel
The Linear Regression Channel indicator is a versatile tool for traders, providing valuable insights into price trends and potential reversal points. It plots two linear regression channels on the chart, helping you visualize price dynamics and make informed trading decisions.
Indicator Features and Settings
General Settings:
• Source: The price source used for channel calculations. Typically, the close price is used.
1st Channel Settings:
• Length: The number of bars used to calculate the linear regression channel. Increasing this value widens the channel and makes it less responsive to recent price changes.
• Upper Deviation Multiplier: Multiplier for the upper deviation from the regression line. Higher values widen the upper boundary.
• Lower Deviation Multiplier: Multiplier for the lower deviation from the regression line. Higher values widen the lower boundary.
• Show Channel Lines: Toggle to show or hide the channel lines, useful for visualizing channel boundaries.
• Show Channel Background: Toggle to show or hide the background color between the channel lines, highlighting the area covered by the channel.
• Show Labels: Toggle to show or hide price level labels for the channel lines, helping to identify exact price levels at the boundaries.
• Upper Label Color: Color for the upper price level label.
• Lower Label Color: Color for the lower price level label.
• Label Offset: Offset for the price level labels, adjusting them horizontally.
1st Channel Display Settings:
• Extend Lines Left: Extend the regression channel lines to the left of the chart, visualizing historical performance.
• Extend Lines Right: Extend the regression channel lines to the right of the chart, anticipating future price movements.
1st Channel Style Settings:
• Upper 1st Channel Line Color: Color for the upper line of the first channel.
• Lower 1st Channel Line Color: Color for the lower line of the first channel.
• Upper Channel Color: Color for the upper channel area, filling the area between the upper channel line and the midline.
• Lower Channel Color: Color for the lower channel area, filling the area between the lower channel line and the midline.
• Baseline Color (DownTrend): Color of the baseline during a downtrend.
• Baseline Color (Up Trend): Color of the baseline during an uptrend.
2nd Channel Settings:
• Length for 2nd Channel: The number of bars used to calculate the second linear regression channel.
• Upper Deviation Multiplier for 2nd Channel: Multiplier for the upper deviation from the regression line in the second channel.
• Lower Deviation Multiplier for 2nd Channel: Multiplier for the lower deviation from the regression line in the second channel.
2nd Channel Display Settings:
• Show 2nd Channel Lines: Toggle to show or hide the second channel lines, useful for visualizing channel boundaries.
• Show 2nd Channel Background: Toggle to show or hide the background color between the second channel lines, highlighting the area covered by the second channel.
2nd Channel Style Settings:
• Upper 2nd Channel Color: Color for the upper line of the second channel.
• Lower 2nd Channel Color: Color for the lower line of the second channel.
• Baseline Color for 2nd Channel (Up Trend): Color of the baseline during an uptrend in the second channel.
• Baseline Color for 2nd Channel (Down Trend): Color of the baseline during a downtrend in the second channel.
• Upper 2nd Channel Background Color: Background color for the upper part of the second channel, filling the area between the upper channel line and the midline.
• Lower 2nd Channel Background Color: Background color for the lower part of the second channel, filling the area between the lower channel line and the midline.
• Line Style for 2nd Channel: Choose the style of the second channel lines (Solid, Dotted, Dashed, Arrow, Round).
2nd Channel Line Settings:
• Extend 2nd Channel Lines Left: Extend the second channel lines to the left of the chart, visualizing historical performance.
• Extend 2nd Channel Lines Right: Extend the second channel lines to the right of the chart, anticipating future price movements.
Other Settings:
• Show VWAP Detection: Toggle to enable or disable VWAP detection. VWAP (Volume Weighted Average Price) indicates the average price of the asset, weighted by volume.
• Show Doji Detection: Toggle to enable or disable Doji candle detection. Doji candles have small bodies, indicating market indecision.
• Doji Size Threshold: Threshold to determine a Doji candle. A smaller value indicates a stricter Doji definition.
How to Read the Indicator for Trading
Channel Lines and Colors:
• The upper line of the 1st channel (green) and the 2nd channel (blue) represents the upper boundary based on linear regression and deviation multipliers.
• The lower line of the 1st channel (red) and the 2nd channel (orange) represents the lower boundary.
• The midline changes color dynamically based on the trend direction:
• Pink during a downtrend for the 1st channel.
• Blue during an uptrend for the 1st channel.
• Gray during a consolidation for both channels.
• The 2nd channel uses similar color logic.
Channel Background:
• The background color between the channel lines highlights the area covered by the channel:
• Green for the upper area and red for the lower area in the 1st channel.
• Blue and orange for the upper and lower areas in the 2nd channel, respectively.
Labels:
• Price level labels at the channel boundaries provide exact price levels, displayed at the upper and lower lines if enabled.
VWAP and Doji Detection:
• VWAP is plotted as circles on the chart, showing the volume-weighted average price.
• Doji candles are highlighted with a background color if detected, indicating potential market indecision.
Alerts:
• Alerts are triggered when the trend direction of the channels changes. For example:
• An alert notifies you if the 1st channel is in an uptrend while the 2nd channel is in a downtrend.
• An alert notifies you if the 1st channel is in a downtrend while the 2nd channel is in an uptrend.
Trading with the Indicator
• Trend Identification: Use the color and direction of the midline and baseline to identify the current trend. An uptrend is indicated by a blue midline, while a downtrend is indicated by a pink midline.
• Reversal Points: Monitor when the price approaches the upper or lower boundaries of the channels, as these can act as support or resistance levels.
• Volume Insights: Use the VWAP and liquidity levels to understand the true average price based on volume and identify significant areas of trading activity.
• Market Indecision: Watch for Doji candles, which can signal potential reversals or periods of consolidation.
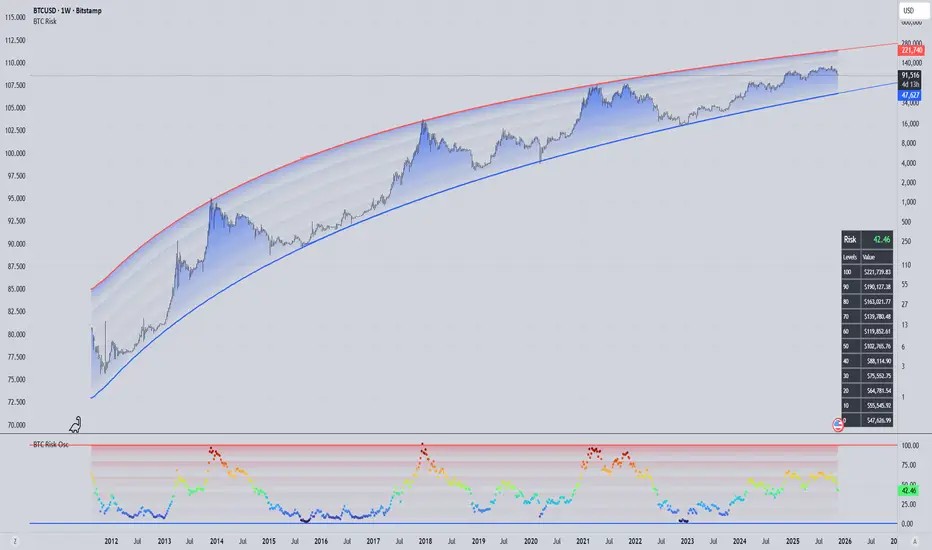
panpanXBT BTC Risk Metric OscillatorThis is the Bitcoin Risk Metric. Inspired by many power law analysts, this script assigns a risk value to the price of Bitcoin. The model uses regression of 'fair value' data to assign risk values and residual analysis to account for diminishing returns as time goes on. This indicator is for long-term investors looking to maximise their returns by highlighting periods of under and overvaluation for Bitcoin.
This is a companion script for panpanXBT BTC Risk Metric . Use this indicator in tandem to achieve the view shown in the chart above.
Please note, this indicator will only work on BTCUSD charts but will work on any timeframe.
DISCLAIMER: The product on offer presents a novel way to view the price history of Bitcoin. It should not be relied upon solely to inform financial decisions. What you do with the information is entirely up to you. Please thoroughly consider your decisions and consult many different sources to make sure you're making the most well-informed decision.
### How to Interpret
The risk scale goes from 0 to 100,
Blue - 0 being low risk, and
Red - 100 being high risk.
Low risk values represent periods of historical undervaluation, while high values represent overvaluation. These periods are marked by a colourscale from blue to red.
### Use Cases and Best Practice
A dynamic DCA strategy would work best with this indicator, whereby an amount of capital is deployed/retired on a regular basis. This amount deployed grows or shrinks depending on the proximity of the risk level to the extremes (0 and 100).
Let's say you have a maximum of $500 to deploy per month.
When risk is between 0 and 10, you could deploy the full $500.
When risk is between 10 and 20, you could deploy $400.
When risk is between 20 and 30, you could deploy $300.
When risk is between 30 and 40, you could deploy $200.
When risk is between 40 and 50, you could deploy $100.
Conversely, when risk is above 50, you could:
Sell 1/15th of your BTC stack when risk is between 50 and 60.
Sell 2/15th of your BTC stack when risk is between 60 and 70.
Sell 3/15th of your BTC stack when risk is between 70 and 80.
Sell 4/15th of your BTC stack when risk is between 80 and 90.
Sell 5/15th of your BTC stack when risk is between 90 and 100.
This framework allows the user to accumulate during periods of undervaluation and derisk during periods of overvaluation, capturing returns in the process.
In contrast, simply setting limit orders at 0 and 100 would yield the absolute maximum returns, however there is no guarantee price will reach these levels (see 2018 where the bear market bottomed out at 20 risk, or 2021 where price topped out at 97 risk).
### Caveats
"All models are wrong, some are useful"
No model is perfect. No model can predict exactly what price will do as there are too many factors at play that determine the outcome. We use models as a guide to make better-informed decisions, as opposed to shooting in the dark. This model is not a get rich quick scheme, but rather a tool to help inform decisions should you consider investing. This model serves to highlight price extremities, which could present opportune times to invest.
### Conclusion
This indicator aims to highlight periods of extreme values for Bitcoin, which may provide an edge in the market for long-term investors.
Thank you for your interest in this indicator. If you have any questions, recommendations or feedback, please leave a comment or drop me a message on TV or twitter. I aim to be as transparent as possible with this project, so please seek clarification if you are unsure about anything.

panpanXBT BTC Risk MetricThis is the Bitcoin Risk Metric. Inspired by many power law analysts, this script assigns a risk value to the price of Bitcoin. The model uses regression of 'fair value' data to assign risk values and residual analysis to account for diminishing returns as time goes on. This indicator is for long-term investors looking to maximise their returns by highlighting periods of under and overvaluation for Bitcoin.
This is a companion script for panpanXBT BTC Risk Metric Oscillator . Use this indicator in tandem to achieve the view shown in the chart above.
Please note, this indicator will only work on BTCUSD charts but will work on any timeframe.
DISCLAIMER: The product on offer presents a novel way to view the price history of Bitcoin. It should not be relied upon solely to inform financial decisions. What you do with the information is entirely up to you. Please thoroughly consider your decisions and consult many different sources to make sure you're making the most well-informed decision.
### How to Interpret
The risk scale goes from 0 to 100,
Blue - 0 being low risk, and
Red - 100 being high risk.
Low risk values represent periods of historical undervaluation, while high values represent overvaluation. These periods are marked by a colourscale from blue to red.
### Use Cases and Best Practice
A dynamic DCA strategy would work best with this indicator, whereby an amount of capital is deployed/retired on a regular basis. This amount deployed grows or shrinks depending on the proximity of the risk level to the extremes (0 and 100).
Let's say you have a maximum of $500 to deploy per month.
When risk is between 0 and 10, you could deploy the full $500.
When risk is between 10 and 20, you could deploy $400.
When risk is between 20 and 30, you could deploy $300.
When risk is between 30 and 40, you could deploy $200.
When risk is between 40 and 50, you could deploy $100.
Conversely, when risk is above 50, you could:
Sell 1/15th of your BTC stack when risk is between 50 and 60.
Sell 2/15th of your BTC stack when risk is between 60 and 70.
Sell 3/15th of your BTC stack when risk is between 70 and 80.
Sell 4/15th of your BTC stack when risk is between 80 and 90.
Sell 5/15th of your BTC stack when risk is between 90 and 100.
This framework allows the user to accumulate during periods of undervaluation and derisk during periods of overvaluation, capturing returns in the process.
In contrast, simply setting limit orders at 0 and 100 would yield the absolute maximum returns, however there is no guarantee price will reach these levels (see 2018 where the bear market bottomed out at 20 risk, or 2021 where price topped out at 97 risk).
### Caveats
"All models are wrong, some are useful"
No model is perfect. No model can predict exactly what price will do as there are too many factors at play that determine the outcome. We use models as a guide to make better-informed decisions, as opposed to shooting in the dark. This model is not a get rich quick scheme, but rather a tool to help inform decisions should you consider investing. This model serves to highlight price extremities, which could present opportune times to invest.
### Conclusion
This indicator aims to highlight periods of extreme values for Bitcoin, which may provide an edge in the market for long-term investors.
Thank you for your interest in this indicator. If you have any questions, recommendations or feedback, please leave a comment or drop me a message on TV or twitter. I aim to be as transparent as possible with this project, so please seek clarification if you are unsure about anything.
Multiple Non-Linear Regression [ChartPrime]This Pine Script indicator is designed to perform multiple non-linear regression analysis using four independent variables: close, open, high, and low prices. Here's a breakdown of its components and functionalities:
Inputs:
Users can adjust several parameters:
Normalization Data Length: Length of data used for normalization.
Learning Rate: Rate at which the algorithm learns from errors.
Smooth?: Option to smooth the output.
Smooth Length: Length of smoothing if enabled.
Define start coefficients: Initial coefficients for the regression equation.
Data Normalization:
The script normalizes input data to a range between 0 and 1 using the highest and lowest values within a specified length.
Non-linear Regression:
It calculates the regression equation using the input coefficients and normalized data. The equation used is a weighted sum of the independent variables, with coefficients adjusted iteratively using gradient descent to minimize errors.
Error Calculation:
The script computes the error between the actual and predicted values.
Gradient Descent: The coefficients are updated iteratively using gradient descent to minimize the error.
// Compute the predicted values using the non-linear regression function
predictedValues = nonLinearRegression(x_1, x_2, x_3, x_4, b1, b2, b3, b4)
// Compute the error
error = errorModule(initial_val, predictedValues)
// Update the coefficients using gradient descent
b1 := b1 - (learningRate * (error * x_1))
b2 := b2 - (learningRate * (error * x_2))
b3 := b3 - (learningRate * (error * x_3))
b4 := b4 - (learningRate * (error * x_4))
Visualization:
Plotting of normalized input data (close, open, high, low).
The indicator provides visualization of normalized data values (close, open, high, low) in the form of circular markers on the chart, allowing users to easily observe the relative positions of these values in relation to each other and the regression line.
Plotting of the regression line.
Color gradient on the regression line based on its value and bar colors.
Display of normalized input data and predicted value in a table.
Signals for crossovers with a midline (0.5).
Interpretation:
Users can interpret the regression line and its crossovers with the midline (0.5) as signals for potential buy or sell opportunities.
This indicator helps users analyze the relationship between multiple variables and make trading decisions based on the regression analysis. Adjusting the coefficients and parameters can fine-tune the model's performance according to specific market conditions.

regressionsLibrary "regressions"
This library computes least square regression models for polynomials of any form for a given data set of x and y values.
fit(X, y, reg_type, degrees)
Takes a list of X and y values and the degrees of the polynomial and returns a least square regression for the given polynomial on the dataset.
Parameters:
X (array) : (float ) X inputs for regression fit.
y (array) : (float ) y outputs for regression fit.
reg_type (string) : (string) The type of regression. If passing value for degrees use reg.type_custom
degrees (array) : (int ) The degrees of the polynomial which will be fit to the data. ex: passing array.from(0, 3) would be a polynomial of form c1x^0 + c2x^3 where c2 and c1 will be coefficients of the best fitting polynomial.
Returns: (regression) returns a regression with the best fitting coefficients for the selecected polynomial
regress(reg, x)
Regress one x input.
Parameters:
reg (regression) : (regression) The fitted regression which the y_pred will be calulated with.
x (float) : (float) The input value cooresponding to the y_pred.
Returns: (float) The best fit y value for the given x input and regression.
predict(reg, X)
Predict a new set of X values with a fitted regression. -1 is one bar ahead of the realtime
Parameters:
reg (regression) : (regression) The fitted regression which the y_pred will be calulated with.
X (array)
Returns: (float ) The best fit y values for the given x input and regression.
generate_points(reg, x, y, left_index, right_index)
Takes a regression object and creates chart points which can be used for plotting visuals like lines and labels.
Parameters:
reg (regression) : (regression) Regression which has been fitted to a data set.
x (array) : (float ) x values which coorispond to passed y values
y (array) : (float ) y values which coorispond to passed x values
left_index (int) : (int) The offset of the bar farthest to the realtime bar should be larger than left_index value.
right_index (int) : (int) The offset of the bar closest to the realtime bar should be less than right_index value.
Returns: (chart.point ) Returns an array of chart points
plot_reg(reg, x, y, left_index, right_index, curved, close, line_color, line_width)
Simple plotting function for regression for more custom plotting use generate_points() to create points then create your own plotting function.
Parameters:
reg (regression) : (regression) Regression which has been fitted to a data set.
x (array)
y (array)
left_index (int) : (int) The offset of the bar farthest to the realtime bar should be larger than left_index value.
right_index (int) : (int) The offset of the bar closest to the realtime bar should be less than right_index value.
curved (bool) : (bool) If the polyline is curved or not.
close (bool) : (bool) If true the polyline will be closed.
line_color (color) : (color) The color of the line.
line_width (int) : (int) The width of the line.
Returns: (polyline) The polyline for the regression.
series_to_list(src, left_index, right_index)
Convert a series to a list. Creates a list of all the cooresponding source values
from left_index to right_index. This should be called at the highest scope for consistency.
Parameters:
src (float) : (float ) The source the list will be comprised of.
left_index (int) : (float ) The left most bar (farthest back historical bar) which the cooresponding source value will be taken for.
right_index (int) : (float ) The right most bar closest to the realtime bar which the cooresponding source value will be taken for.
Returns: (float ) An array of size left_index-right_index
range_list(start, stop, step)
Creates an from the start value to the stop value.
Parameters:
start (int) : (float ) The true y values.
stop (int) : (float ) The predicted y values.
step (int) : (int) Positive integer. The spacing between the values. ex: start=1, stop=6, step=2:
Returns: (float ) An array of size stop-start
regression
Fields:
coeffs (array__float)
degrees (array__float)
type_linear (series__string)
type_quadratic (series__string)
type_cubic (series__string)
type_custom (series__string)
_squared_error (series__float)
X (array__float)
Heat Map SeasonsHeat Map Seasons indicator
Indicator offers traders a unique perspective on market dynamics by visualizing seasonal trends and deviations from typical price behavior. By blending regression analysis with a color-coded heat map, this indicator highlights periods of heightened volatility and helps identify potential shifts in market sentiment.
Summer:
In the context of the indicator, "summer" represents a period of heightened volatility and upward price momentum in the market. This is analogous to the warmer months of the year when activities are typically more vibrant and energetic. During the "summer" phase indicated by the indicator, traders may observe strong bullish trends, increased trading volumes, and larger price movements. It suggests a favorable environment for bullish strategies, such as trend following or momentum trading. However, traders should exercise caution as heightened volatility can also lead to increased risk and potential drawdowns.
Winter:
Conversely, "winter" signifies a period of decreased volatility and potentially sideways or bearish price action in the market. Similar to the colder months of the year when activities tend to slow down, the "winter" phase in the indicator suggests a quieter market environment with subdued price movements and lower trading volumes. During this phase, traders may encounter choppy price action, consolidation patterns, or even downtrends. It indicates a challenging environment for trend-following strategies and may require a more cautious approach, such as range-bound or mean-reversion trading strategies.
In summary, the "summer" and "winter" phases in the "Heat Map Seasons" indicator provide traders with valuable insights into the prevailing market sentiment and can help inform their trading decisions based on the observed levels of volatility and price momentum.
How to Use:
Watch for price bars that deviate significantly from the regression line , as these may signal potential trading opportunities.
Use the seasonal gauge to gauge the current market sentiment and adjust trading strategies accordingly.
Experiment with different settings for Length and Heat Sensitivity to customize the indicator to your trading style and preferences.
The "Heat Map Seasons" indicator can potentially identify overheated market tops and bottoms on a weekly timeframe by detecting significant deviations from the regression line and observing extreme color gradients in the heat map. Here's how it can be used for this purpose:
Observing Extreme Color Gradients:
When the market is overheated and reaches a potential top, you may observe extremely warm colors (e.g., deep red) in the heat map section of the indicator.
Traders can interpret this as a warning sign of a potential market top, indicating that bullish momentum may be reaching unsustainable levels.
Conversely, when prices deviate too far below the regression line, it may indicate oversold conditions and a potential bottom.
Potential Tops and Bottoms:
User Inputs:
Length: Determines the length of the regression analysis period.
Heat Sensitivity: Controls the sensitivity of the heat map to deviations from the regression line.
Show Regression Line: Option to display or hide the regression line on the chart
Note: This indicator is best used in conjunction with other technical analysis tools and should not be relied upon as the sole basis for trading decisions.

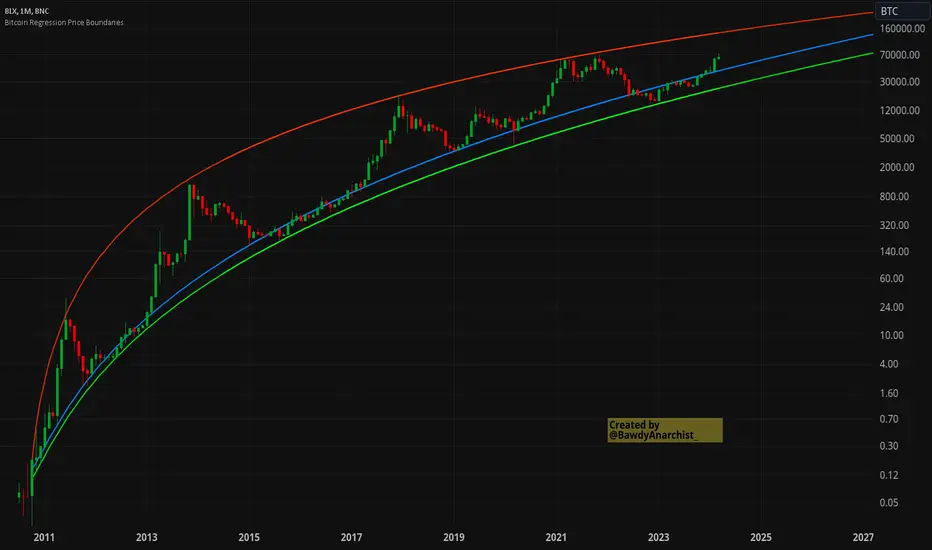
Bitcoin Regression Price BoundariesTLDR
DCA into BTC at or below the blue line. DCA out of BTC when price approaches the red line. There's a setting to toggle the future extrapolation off/on.
INTRODUCTION
Regression analysis is a fundamental and powerful data science tool, when applied CORRECTLY . All Bitcoin regressions I've seen (Rainbow Log, Stock-to-flow, and non-linear models), have glaring flaws ... Namely, that they have huge drift from one cycle to the next.
Presented here, is a canonical application of this statistical tool. "Canonical" meaning that any trained analyst applying the established methodology, would arrive at the same result. We model 3 lines:
Upper price boundary (red) - Predicted the April 2021 top to within 1%
Lower price boundary (green)- Predicted the Dec 2022 bottom within 10%
Non-bubble best fit line (blue) - Last update was performed on Feb 28 2024.
NOTE: The red/green lines were calculated using solely data from BEFORE 2021.
"I'M INTRUIGED, BUT WHAT EXACTLY IS REGRESSION ANALYSIS?"
Quite simply, it attempts to draw a best-fit line over some set of data. As you can imagine, there are endless forms of equations that we might try. So we need objective means of determining which equations are better than others. This is where statistical rigor is crucial.
We check p-values to ensure that a proposed model is better than chance. When comparing two different equations, we check R-squared and Residual Standard Error, to determine which equation is modeling the data better. We check residuals to ensure the equation is sufficiently complex to model all the available signal. We check adjusted R-squared to ensure the equation is not *overly* complex and merely modeling random noise.
While most people probably won't entirely understand the above paragraph, there's enough key terminology in for the intellectually curious to research.
DIVING DEEPER INTO THE 3 REGRESSION LINES ABOVE
WARNING! THIS IS TECHNICAL, AND VERY ABBREVIATED
We prefer a linear regression, as the statistical checks it allows are convenient and powerful. However, the BTCUSD dataset is decidedly non-linear. Thus, we must log transform both the x-axis and y-axis. At the end of this process, we'll use e^ to transform back to natural scale.
Plotting the log transformed data reveals a crucial visual insight. The best fit line for the blowoff tops is different than for the lower price boundary. This is why other models have failed. They attempt to model ALL the data with just one equation. This causes drift in both the upper and lower boundaries. Here we calculate these boundaries as separate equations.
Upper Boundary (in red) = e^(3.24*ln(x)-15.8)
Lower Boundary (green) = e^(0.602*ln^2(x) - 4.78*ln(x) + 7.17)
Non-Bubble best fit (blue) = e^(0.633*ln^2(x) - 5.09*ln(x) +8.12)
* (x) = The number of days since July 18 2010
Anyone familiar with Bitcoin, knows it goes in cycles where price goes stratospheric, typically measured in months; and then a lengthy cool-off period measured in years. The non-bubble best fit line methodically removes the extreme upward deviations until the residuals have the closest statistical semblance to normal data (bell curve shaped data).
Whereas the upper/lower boundary only gets re-calculated in hindsight (well after a blowoff or capitulation occur), the Non-Bubble line changes ever so slightly with each new datapoint. The last update to this line was made on Feb 28, 2024.
ENOUGH NERD TALK! HOW CAN I APPLY THIS?
In the simplest terms, anything below the blue line is a statistical buying opportunity. The closer you approach the green line (the lower boundary) the more statistically strong that opportunity is. As price approaches the red line, is a growing statistical likelyhood/danger of an imminent blowoff top.
So a wise trader would DCA (dollar cost average) into Bitcoin below the blue line; and would DCA out of Bitcoin as it approaches the red line. Historically, you may or may not have a large time-window during points of maximum opportunity. So be vigilant! Anything within 10-20% of the boundary should be regarded as extreme opportunity.
Note: You can toggle the future extrapolation of these lines in the settings (default on).
CLOSING REMARKS
Keep in mind this is a pure statistical analysis. It's likely that this model is probing a complex, real economic process underlying the Bitcoin price. Statistical models like this are most accurate during steady state conditions, where the prevailing fundamentals are stable. (The astute observer will note, that the regression boundaries held despite the economic disruption of 2020).
Thus, it cannot be understated: Should some drastic fundamental change occur in the underlying economic landscape of cryptocurrency, Bitcoin itself, or the broader economy, this model could drastically deviate, and become significantly less accurate.
Furthermore, the upper/lower boundaries cross in the year 2037. THIS MODEL WILL EVENTUALLY BREAK DOWN. But for now, given that Bitcoin price moves on the order of 2000% from bottom to top, it's truly remarkable that, using SOLELY pre-2021 data, this model was able to nail the top/bottom within 10%.
Trend AngleThe "Trend Angle" indicator serves as a tool for traders to decipher market trends through a methodical lens. It quantifies the inclination of price movements within a specified timeframe, making it easy to understand current trend dynamics.
Conceptual Foundation:
Angle Measurement: The essence of the "Trend Angle" indicator is its ability to compute the angle between the price trajectory over a defined period and the horizontal axis. This is achieved through the calculation of the arctangent of the percentage price change, offering a straightforward measure of market directionality.
Smoothing Mechanisms: The indicator incorporates options for "Moving Average" and "Linear Regression" as smoothing mechanisms. This adaptability allows for refined trend analysis, catering to diverse market conditions and individual preferences.
Functional Versatility:
Source Adaptability: The indicator affords the flexibility to select the desired price source, enabling users to tailor the angle calculation to their analytical framework and other indicators.
Detrending Capability: With the detrending feature, the indicator allows for the subtraction of the smoothing line from the calculated angle, highlighting deviations from the main trend. This is particularly useful for identifying potential trend reversals or significant market shifts.
Customizable Period: The 'Length' parameter empowers traders to define the observation window for both the trend angle calculation and its smoothing, accommodating various trading horizons.
Visual Intuition: The optional colorization enhances interpretability, with the indicator's color shifting based on its relation to the smoothing line, thereby providing an immediate visual cue regarding the trend's direction.
Interpretative Results:
Market Flatness: An angle proximate to 0 suggests a flat market condition, indicating a lack of significant directional movement. This insight can be pivotal for traders in assessing market stagnation.
Trending Market: Conversely, a relatively high angle denotes a trending market, signifying strong directional momentum. This distinction is crucial for traders aiming to capitalize on trend-driven opportunities.
Analytical Nuance vs. Simplicity:
While the "Trend Angle" indicator is underpinned by mathematical principles, its utility lies in its simplicity and interpretative clarity. However, it is imperative to acknowledge that this tool should be employed as part of a comprehensive trading strategy , complemented by other analytical instruments for a holistic market analysis.
In essence, the "Trend Angle" indicator exemplifies the harmonization of simplicity and analytical rigor. Its design respects the complexity of market behaviors while offering straightforward, actionable insights, making it a valuable component in the arsenal of both seasoned and novice traders alike.
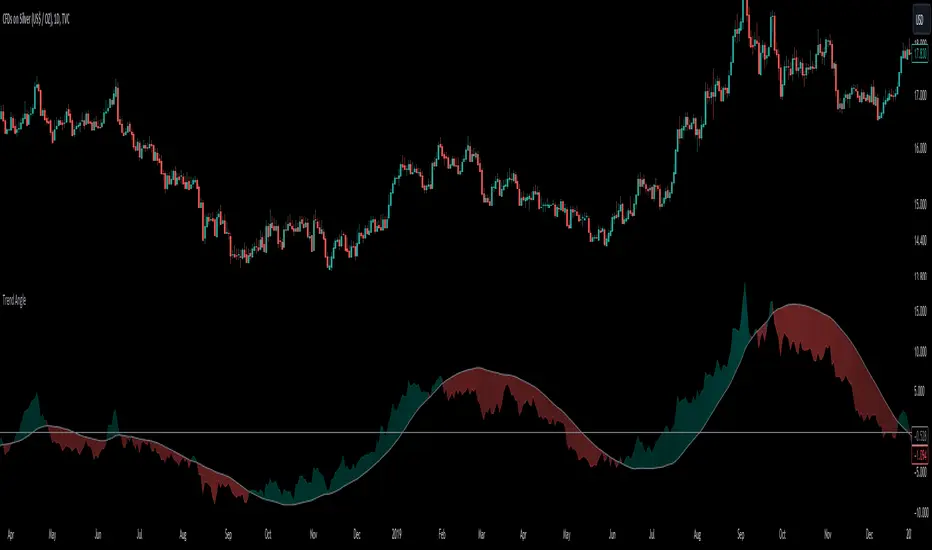
Machine Learning: Multiple Logistic Regression
Multiple Logistic Regression Indicator
The Logistic Regression Indicator for TradingView is a versatile tool that employs multiple logistic regression based on various technical indicators to generate potential buy and sell signals. By utilizing key indicators such as RSI, CCI, DMI, Aroon, EMA, and SuperTrend, the indicator aims to provide a systematic approach to decision-making in financial markets.
How It Works:
Technical Indicators:
The script uses multiple technical indicators such as RSI, CCI, DMI, Aroon, EMA, and SuperTrend as input variables for the logistic regression model.
These indicators are normalized to create categorical variables, providing a consistent scale for the model.
Logistic Regression:
The logistic regression function is applied to the normalized input variables (x1 to x6) with user-defined coefficients (b0 to b6).
The logistic regression model predicts the probability of a binary outcome, with values closer to 1 indicating a bullish signal and values closer to 0 indicating a bearish signal.
Loss Function (Cross-Entropy Loss):
The cross-entropy loss function is calculated to quantify the difference between the predicted probability and the actual outcome.
The goal is to minimize this loss, which essentially measures the model's accuracy.
// Error Function (cross-entropy loss)
loss(y, p) =>
-y * math.log(p) - (1 - y) * math.log(1 - p)
// y - depended variable
// p - multiple logistic regression
Gradient Descent:
Gradient descent is an optimization algorithm used to minimize the loss function by adjusting the weights of the logistic regression model.
The script iteratively updates the weights (b1 to b6) based on the negative gradient of the loss function with respect to each weight.
// Adjusting model weights using gradient descent
b1 -= lr * (p + loss) * x1
b2 -= lr * (p + loss) * x2
b3 -= lr * (p + loss) * x3
b4 -= lr * (p + loss) * x4
b5 -= lr * (p + loss) * x5
b6 -= lr * (p + loss) * x6
// lr - learning rate or step of learning
// p - multiple logistic regression
// x_n - variables
Learning Rate:
The learning rate (lr) determines the step size in the weight adjustment process. It prevents the algorithm from overshooting the minimum of the loss function.
Users can set the learning rate to control the speed and stability of the optimization process.
Visualization:
The script visualizes the output of the logistic regression model by coloring the SMA.
Arrows are plotted at crossover and crossunder points, indicating potential buy and sell signals.
Lables are showing logistic regression values from 1 to 0 above and below bars
Table Display:
A table is displayed on the chart, providing real-time information about the input variables, their values, and the learned coefficients.
This allows traders to monitor the model's interpretation of the technical indicators and observe how the coefficients change over time.
How to Use:
Parameter Adjustment:
Users can adjust the length of technical indicators (rsi_length, cci_length, etc.) and the Z score length based on their preference and market characteristics.
Set the initial values for the regression coefficients (b0 to b6) and the learning rate (lr) according to your trading strategy.
Signal Interpretation:
Buy signals are indicated by an upward arrow (▲), and sell signals are indicated by a downward arrow (▼).
The color-coded SMA provides a visual representation of the logistic regression output by color.
Table Information:
Monitor the table for real-time information on the input variables, their values, and the learned coefficients.
Keep an eye on the learning rate to ensure a balance between model adjustment speed and stability.
Backtesting and Validation:
Before using the script in live trading, conduct thorough backtesting to evaluate its performance under different market conditions.
Validate the model against historical data to ensure its reliability.

Scalper's Volatility Filter [QuantraSystems]Scalpers Volatility Filter
Introduction
The 𝒮𝒸𝒶𝓁𝓅𝑒𝓇'𝓈 𝒱𝑜𝓁𝒶𝓉𝒾𝓁𝒾𝓉𝓎 𝐹𝒾𝓁𝓉𝑒𝓇 (𝒮𝒱𝐹) is a sophisticated technical indicator, designed to increase the profitability of lower timeframe trading.
Due to the inherent decrease in the signal-to-noise ratio when trading on lower timeframes, it is critical to develop analysis methods to inform traders of the optimal market periods to trade - and more importantly, when you shouldn’t trade.
The 𝒮𝒱𝐹 uses a blend of volatility and momentum measurements, to signal the dominant market condition - trending or ranging.
Legend
The 𝒮𝒱𝐹 consists of a signal line that moves above and below a central zero line, serving as the indication of market regime.
When the signal line is positioned above zero, it indicates a period of elevated volatility. These periods are more profitable for trading, as an asset will experience larger price swings, and by design, trend-following indicators will give less false signals.
Conversely, when the signal line moves below zero, a low volatility or mean-reverting market regime dominates.
This distinction is critical for traders in order to align strategies with the prevailing market behaviors - leveraging trends in volatile markets and exercising caution or implementing mean-reversion systems in periods of lower volatility.
Case Study
Here we can see the indicator's unique edge in action.
Out of the four potential long entries seen on the chart - displayed via bar coloring, two would result in losses.
However, with the power of the 𝒮𝒱𝐹 a trader can effectively filter false signals by only entering momentum-trades when the signal line is above zero.
In this small sample of four trades, the 𝒮𝒱𝐹 increased the win rate from 50% to 100%
Methodology
The methodology behind the 𝒮𝒱𝐹 is based upon three components:
By calculating and contrasting two ATR’s, the immediate market momentum relative to the broader, established trend is calculated. The original method for this can be credited to the user @xinolia
A modified and smoothed ADX indicator is calculated to further assess the strength and sustainability of trends.
The ‘Linear Regression Dispersion’ measures price deviations from a fitted regression line, adding further confluence to the signals representation of market conditions.
Together, these components synthesize a robust, balanced view of market conditions, enabling traders to help align strategies with the prevailing market environment, in order to potentially increase expected value and win rates.

ATR TrendTL;DR - An average true range (ATR) based trend
ATR trend uses a (customizable) ATR calculation and highest high & lowest low prices to calculate the actual trend. Basically it determines the trend direction by using highest high & lowest low and calculates (depending on the determined direction) the ATR trend by using a ATR based calculation and comparison method.
The indicator will draw one trendline by default. It is also possible to draw a second trendline which shows a 'negative trend'. This trendline is calculated the same way the primary trendline is calculated but uses a negative (-1 by default) value for the ATR calculation. This trendline can be used to detect early trend changes and/or micro trends.
How to use:
Due to its ATR nature the ATR trend will show trend changes by changing the trendline direction. This means that when the price crosses the trendline it does not automatically mean a trend change. However using the 'negative trend' option ATR trend can show early trend changes and therefore good entry points.
Some notes:
- A (confirmed) trend change is shown by a changing color and/or moving trendline (up/down)
- Unlike other indicators the 'time period' value is not the primary adjustment setting. This value is only used to calculate highest high & lowest low values and has medium impact on trend calculation. The primary adjustment setting is 'ATR weight'
- Every settings has a tooltip with further explanation
- I added additional color coding which uses a different color when the trend attempts to change but the trend change isn't confirmed (yet)
- Default values work fine (at least in my back testing) but the recommendation is to adjust the settings (especially ATR weight) to your trading style
- You can further finetune this indicator by using custom moving average types for the ATR calculation (like linear regression or Hull moving average)
- Both trendlines can be used to determine future support and resistance zones
- ATR trend can be used as a stop loss finder
- Alerts are using buy/sell signals
- You can use fancy color filling ;)
Happy trading!
Daniel

Machine Learning: Radius Neighbors Regressor[Pofatoezil] My native language is Chinese. The following introduction is translated using ChatGPT, and I hope the translation is fluent.
Introduction
This indicator is based on the machine learning model, Radius Neighbors Regressor, which predicts the target based on the similarity of past 500 input data. The provided indicator itself is merely a tool, requiring users to input features for comparison based on their preferences. In this indicator, you can utilize up to seven types of data for regression analysis and predict target values for up to three different time periods. It is essential for users to identify features suitable for their specific commodity on their own.
What is Radius Neighbor
The Radius Neighbors Regressor is a machine learning model used for regression tasks, specifically within the realm of supervised learning. It operates based on the principle of radius-based neighbor searches, where the algorithm predicts a target variable by considering the similarity of data points within a specified radius.
Unlike KNN, which considers a fixed number of nearest neighbors, Radius Neighbors Regressor allows for a flexible definition of neighborhoods by specifying a radius. This can be advantageous when dealing with varying densities in the dataset.
The radius-based approach may offer improved robustness in situations where the distribution of neighbors is not uniform or when dealing with outliers, as it considers all data points within the specified radius.
Parameter Settings and Output
Users need to import data(such as KD,RSI,ATR,CCI,MA,Volume....) from the TradingViewChart into the indicator first, and they can choose up to seven types. Then, they select the forecasting period and the regression target (such as Close, MA....). Afterward, set the maximum search radius, where the maximum value of the radius is the square root of N, where N is the number of features used. I recommend using 10% to 15% of the square root of N as the initial parameters.
Left Table
Neighbors: Indicates how many data points among the past 500 records are sufficiently close to the current data.
Ev: The target value predicted by the model.
WR: The probability of predicting a value greater than 0, noting that this is only meaningful for data values related to prices (Close, MA...).
Right Table
Distribution of predicted values for different periods. For example, 90% represents the predicted values at the 90th percentile among the past 500 data points. RK represents the real-time data ranking among past data, ranging from 0 to 100, where a higher number is more suitable for a long position, and vice versa for a short position.
example
I believe that this indicator has many suitable applications, but relying solely on it as a basis for trading decisions may pose risks. I'll leave it to you to explore.
DayChart
H1Chart
After Open Position
First, I observed on the DayChart that the indicator showed a neutral stance in the short, medium, and long term. Additionally, on the H1Chart, I noticed stronger bullish signals in the short, medium, and long-term data. Consequently, I decided to go long for an intraday position.
