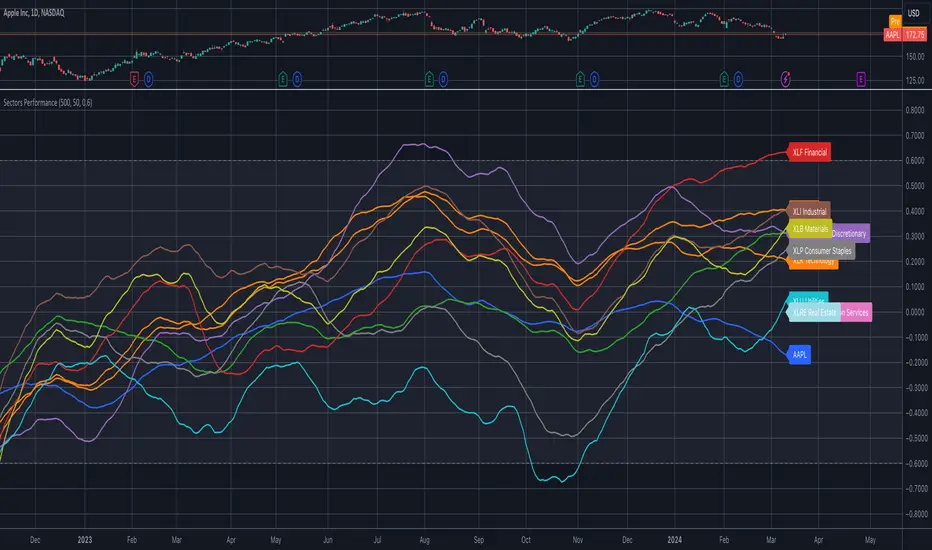
Sector ETFs performance overviewThe indicator provides a nuanced view of sector performance through ETF analysis, focusing on long-term price trends and deviations from these trends to gauge relative strength or weakness. It utilizes a methodical approach to smooth out ETF price data and then applies a regression analysis to pinpoint the primary trend direction. By examining how far the current price deviates from this regression line, the indicator identifies potential overbought or oversold conditions within various sectors.
Core Analysis Techniques:
Logarithmic Transformation and Regression: This process transforms ETF closing prices on a logarithmic scale to better understand sector growth patterns and dynamics. A linear regression of these prices helps define the overarching trend, crucial for understanding market movements.
Volatility Bands for Market State Assessment: The indicator calculates standard deviation based on logarithmic prices to establish dynamic bands around the regression line. These bands are instrumental in identifying market states, highlighting when sectors may be overextended from their central trend.
Sector-Specific Analysis: By focusing on distinct sector ETFs, the tool enables targeted analysis across various market segments. This specificity allows for a granular look at sectors like technology, healthcare, and financials, providing insights tailored to each area.
Adaptability and Insight:
Customizable Parameters: The indicator offers users the ability to adjust key parameters such as regression length and smoothing factors. This customization ensures that the analysis can be tailored to individual preferences and market outlooks.
Trend Direction and Momentum: It assesses the ETF's price movement relative to historical data and the established volatility bands, helping to clarify the sector's trend strength and potential directional shifts.
Strategic Application:
Focusing on trend and volatility analysis rather than direct trading signals, the indicator aids in forming a strategic view of sector investments. It's particularly useful for:
Spotting macroeconomic trends through the lens of sector ETF performance.
Informing portfolio decisions with nuanced insights into sector momentum and market conditions.
Anticipating potential market shifts by evaluating how current prices align with historical volatility and trend patterns.
This tool stands out as a vital resource for analyzing sector-level market trends, offering detailed insights into the dynamics of economic sectors for comprehensive market analysis.
Regressions
Sector ETF macro trendThe Sector ETF Macro Trend indicator is designed for technical analysis of broad economic trends through sector-specific exchange-traded funds (ETFs). It uses logarithmic price transformation, linear regression, and volatility analysis to examine sector trends and stability, providing a technical basis for analytical assessment.
Core Analysis Techniques
Logarithmic Transformation and Regression: Converts ETF closing prices logarithmically to reveal sector growth patterns and dynamics. Linear regression on these prices defines the main trend direction, essential for trend analysis.
Volatility Bands for Market State Assessment: Applies standard deviation on logarithmic prices to create dynamic bands around the trendline, identifying overbought or oversold sector conditions by marking deviations from the central trend.
Sector-Specific Analysis: Selection among different sector ETFs allows for precise examination of sectors like technology, healthcare, and financials, enabling focused insights into specific market segments.
Adaptability and Insight
Customizable Parameters: Offers flexibility in modifying regression length and smoothing factors to accommodate various analysis strategies and risk preferences.
Trend Direction and Momentum: Evaluates the ETF's trajectory against historical data and volatility bands to determine sector trend strength and direction, aiding in the prediction of market shifts.
Strategic Application
Without providing explicit trading signals, the indicator focuses on trend and volatility analysis for a strategic view on sector investments. It supports:
Identifying macroeconomic trends through ETF performance analysis.
Informing portfolio decisions with insights into sector momentum and stability.
Forecasting market movements by analyzing overbought or oversold conditions against the ETF price movement and volatility bands.
The Sector ETF Macro Trend indicator serves as a technical tool for analyzing sector-level market trends, offering detailed insights into the dynamics of economic sectors for thorough market analysis.

SheTrade [Filiwoman]The SheTrade indicator calculates pivot points based on the highest and lowest prices for a certain number of bars. These pivot points are then used to calculate support and resistance levels, which are displayed on the chart as horizontal lines. The indicator also includes an additional function to indicate reference points and support/resistance levels, which makes it easier to identify key levels in the market.
🔶 SETTINGS
To configure the SheTrade indicator in the user menu, I would recommend the following input parameters:
🔹Source: Set the closing price of the asset you want to analyze. This is the default value
🔹ML/TF 10 ST/TF 21: Set the value to 21. This means that the indicator will use the 21 most recent bars to calculate the support and resistance lines.
🔹Max points (3): Set the value to 3. This means that the indicator will consider the support or resistance line to be critical if it has been tested at least 3 times. You can adjust this value depending on your trade.
🔹Min points (1): Set the value to 1. This means that the indicator will consider the support or resistance line as the minimum critical level.
🔹Number of lines: set the value to 2. This means that the indicator will display a maximum of 2 lines on the chart. You can adjust this value depending on your trading strategy.
🔹Line direction: Set the value to "right". This means that the indicator will draw lines to the right of the current one
🔹Line thickness: set the value to 1. This is the default value for line thickness.
🔹Multiplier: Set the value to 2.7. This is the default value for the multiplier used to calculate the upper and lower limits.
🔹ATR: Set the value to 32. This is the default value for the average value.
These settings will provide a clear and concise view of the support and resistance levels of the asset you are analyzing, with highlighted critical levels and regression lines that will help identify trends and potential breakthroughs. You can adjust the parameters as needed according to your trading strategy and timeframe.
One of the unique features of the SheTrade indicator is the use of a core regression algorithm to calculate support and resistance levels. This algorithm takes into account the relative weight of each pivot point, with later pivot points being given more weight. This allows the indicator to adapt to changing market conditions and provide more accurate support and resistance levels.
In addition to the support and resistance levels, the SheTrade indicator also includes a Bollinger band-style envelope that can be used to determine overbought and oversold conditions in the market. This envelope is based on the specified multiplier of the Average True Range indicator (ATR) and can be configured according to user preferences.
In general, the SheTrade indicator is a powerful and flexible tool that can help traders identify key support and resistance levels in the market and make more informed trading decisions. The use of the core regression algorithm and configurable input parameters makes it a versatile and adaptable indicator that can be adapted to the needs of any trader.

Custom Swing Index [AstroHub]Custom Swing Index - Unleashing Precision in Trend Analysis
🌟 Overview:
The Custom Swing Index is a meticulously crafted tool that empowers traders with advanced insights into market dynamics, specifically focusing on identifying potential trend reversals. Developed by AstroHub, this indicator stands out for its unique combination of price-related calculations, ratios, and averages, providing a comprehensive and nuanced view of market sentiment.
📈 Key Components:
Price Calculation:
- Price Change: Captures the difference between the current and previous closing prices.
- High and Low Points: Analyzes the high and low points of each bar for crucial price movement data.
Ratios and Averages:
- Upper-Lower Shadow Ratio: Measures the relationship between the upper and lower shadows.
- Open-Close Ratio: Evaluates the ratio of opening to closing prices.
- Sum Price Changes: Sums up price changes over a specified period.
Differences and Shadows:
- Open-Close Difference: Considers the difference between opening and closing prices.
- Upper and Lower Shadow Ratios: Examines the proportions of upper and lower shadows.
Bar Size Metrics:
- Average Bar Size: Determines the average size of each bar.
- High-Low Difference: Measures the difference between the high and low points.
Swing Indicator Calculation:
- The Custom Swing Index is the result of combining these components, creating a dynamic metric that reflects potential trend reversals.
🚥 How to Use:
Understanding the Indicator:
- Bullish signals may be indicated when the swing index surpasses a defined threshold.
- Bearish signals may be indicated when the swing index falls below the negative threshold.
Visual Interpretation:
- Color-coded bars enhance visual interpretation, turning green for bullish conditions and red for bearish conditions.
Entry Points:
- Look for entry points where circle markings are present, indicating potential opportunities.
Alerts:
- Integrated alerts keep traders informed of significant swings, ensuring timely decision-making.

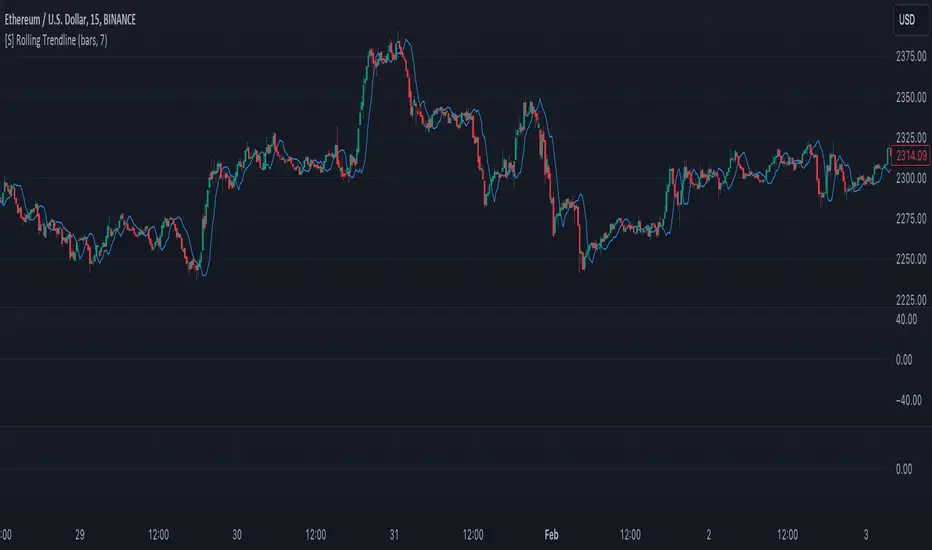
[S] Rolling TrendlineThe Rolling Linear Regression Trendline is a sophisticated technical analysis tool designed to offer traders a dynamic view of market trends over a selectable period. This indicator employs linear regression to calculate and plot a trendline that best fits the closing prices within a specified window, either defined by a number of bars or a set period in days, independent of the chart's timeframe.
Key Features:
Dynamic Window Selection: Users can choose the calculation window based on a fixed number of bars or days, providing flexibility to adapt to different trading strategies and timeframes. For the 'days' option, the indicator calculates the equivalent number of bars based on the chart's timeframe, ensuring relevance across various market conditions and trading sessions.
Linear Regression Analysis: At its core, the indicator uses linear regression to identify the trend direction by calculating the slope and intercept of the trendline. This method offers a statistical approach to trend analysis, highlighting potential uptrends or downtrends based on the positioning and direction of the trendline.
Customizable Period: Traders can input their desired period (N), allowing for tailored analysis. Whether it's short-term movements or longer-term trends, the indicator can adjust to focus on specific time horizons, enhancing its utility across different trading styles and objectives.
Applications:
Trend Identification: By plotting a trendline that mathematically fits the closing prices over the chosen period, traders can quickly identify the prevailing market trend, aiding in bullish or bearish decision-making.
Support and Resistance: The trendline can also serve as a dynamic level of support or resistance, offering potential entry or exit points based on the price's interaction with the trendline.
Strategic Planning: With the ability to adjust the calculation window, traders can align the indicator with their trading strategy, whether focusing on intraday movements or broader swings.
Using this indicator with other parameters can widen you view of the market and help identifying trends
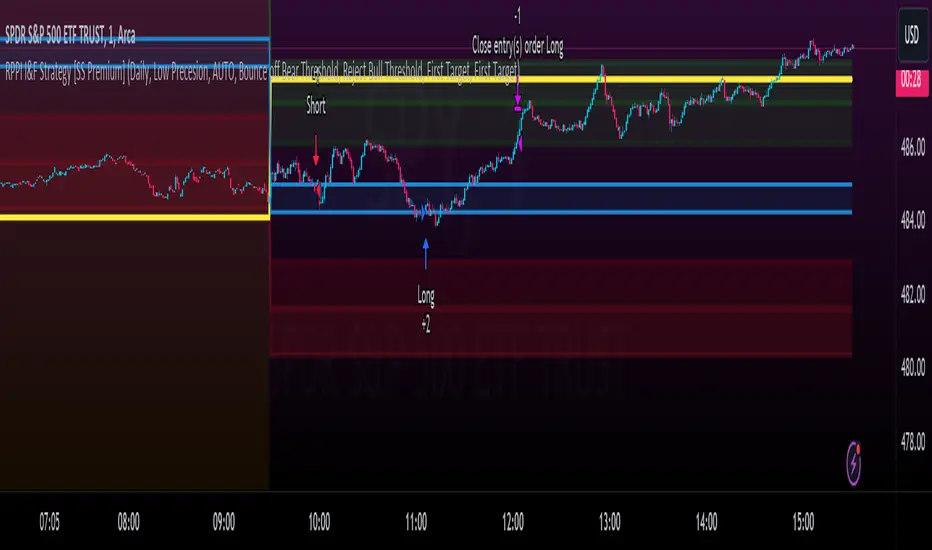
RPPI Futures & Indices Strategy Tester [SS Premium]Hello everyone,
As promised, here is the strategy companion to the RPPI Futures & Indicies Indicator.
It contains all of the models of the RPPI but the functionality is all about back-testing the strategy. As such, you cannot use this to run probabilities, run autoregression assessments, or do any of the advanced RPPI features, this is solely to allow you to develop and implement a sustainable strategy in your trading using the RPI.
When you launch the indicator, in the settings menu, you will see toggles to customize the strategy you would like to apply:
You can customize your short and long entries and your short and long exits and then review the backtest results of these various combinations.
From there, you can open up tradingview's strategy tester to see the immediate success of the strategy. If you want to test how effective your strategy is further back, you can make use of Tradingview's "Deep Backtesting" option. This allows you to select a start date way in the past, and back-test over numerous months / years, to see if the strategy has been sustainable in the long term.
To read more about the RPPI, you can check out its own page which lists the details of the indicator, how it works and how to use it. As a synopsis, the RPPI is a compendium indicator that contains various models of multiple futures and stocks. This is to attempt to accurately forecast daily, weekly, monthly, 3 month and annual moves on various futures and indices.
This strategy companion will help you hone in on ideal entries and exits and allow you to tailor them to each ticker that you are interested in trading, on whichever timeframe you are interested in trading.
Some important notes when applying the back-testing results:
1. If you are back-testing daily levels, it is recommended to use the 1 to 5-minute chart max.
2. iF you are back-testing weekly levels, it is recommended to use at least 15 to 30 minutes, up to 60 minute candles.
3. Monthly levels, its best to use 1 hour and up.
4. Greater than monthly, its best to use 3 to 4 hours, to daily candles and up.
As always, feel free to leave your questions or suggestions below.
Thank you for reading and, as always, safe trades!
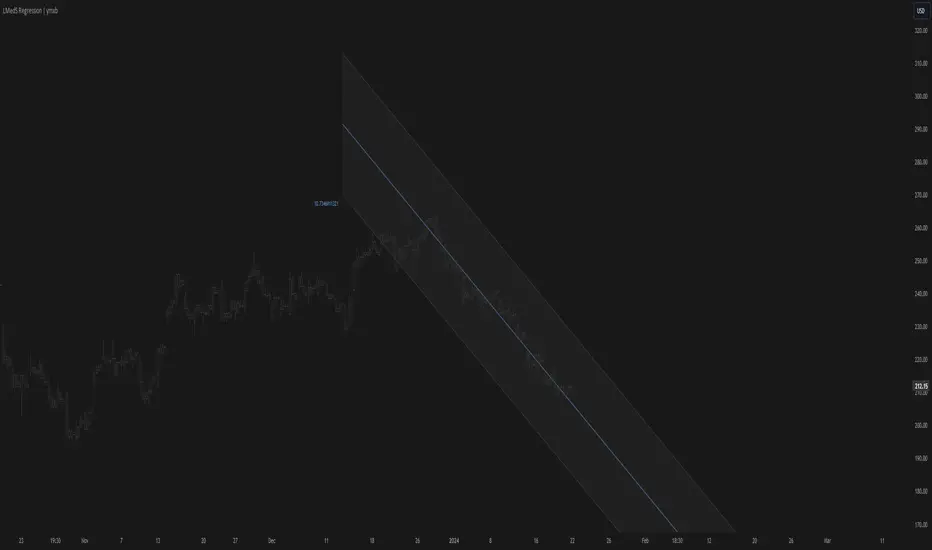
Least Median of Squares Regression | ymxbThe Least Median of Squares (LMedS) is a robust statistical method predominantly used in the context of regression analysis. This technique is designed to fit a model to a dataset in a way that is resistant to outliers. Developed as an alternative to more traditional methods like Ordinary Least Squares (OLS) regression, LMedS is distinguished by its focus on minimizing the median of the squares of the residuals rather than their mean. Residuals are the differences between observed and predicted values.
The key advantage of LMedS is its robustness against outliers. In contrast to methods that minimize the mean squared residuals, the median is less influenced by extreme values, making LMedS more reliable in datasets where outliers are present. This is particularly useful in linear regression, where it identifies the line that minimizes the median of the squared residuals, ensuring that the line is not overly influenced by anomalies.
STATISTICAL PROPERTIES
A critical feature of the LMedS method is its robustness, particularly its resilience to outliers. The method boasts a high breakdown point, which is a measure of an estimator's capacity to handle outliers. In the context of LMedS, this breakdown point is approximately 50%, indicating that it can tolerate corruption of up to half of the input data points without a significant degradation in accuracy. This robustness makes LMedS particularly valuable in real-world data analysis scenarios, where outliers are common and can severely skew the results of less robust methods.
Rousseeuw, Peter J.. “Least Median of Squares Regression.” Journal of the American Statistical Association 79 (1984): 871-880.
The LMedS estimator is also characterized by its equivariance under linear transformations of the response variable. This means that whether you transform the data first and then apply LMedS, or apply LMedS first and then transform the data, the end result remains consistent. However, it's important to note that LMedS is not equivariant under affine transformations of both the predictor and response variables.
ALGORITHM
The algorithm randomly selects pairs of points, calculates the slope (m) and intercept (b) of the line, and then evaluates the median squared deviation (mr2) from this line. The line minimizing this median squared deviation is considered the best fit.
DISCLAIMER
In the LMedS approach, a subset of the data is randomly selected to compute potential models (e.g., lines in linear regression). The method then evaluates these models based on the median of the squared residuals. Since the selection of data points is random, different runs may select different subsets, leading to variability in the computed models.
Universal Forecaster [SS Premium]This is the Universal Forecaster as part of the Elite level.
About:
The universal forecast creates autofitted models for most financial instruments using an ATR approach. It will provide a Bullish and Bearish threshold condition, prospective low targets and prospective high targets. It will autofit and no user inputs are required to manually adjust the parameters.
In addition to this, the indicator also has some build in functions to augment its functionality, including:
a) Built in Autoregression Forecaster;
b) Built in ARIMA plotter;
c) Built in Probability Assessor;
d) Ability to plot next day targets and thresholds;
e) Ability to expand targets up to 3 standard deviations from its projected levels;
d) Has the ability to generate models for most to all timeframes (from as low at 5 minutes to as high as yearly)
Functionality:
Off the bat, the indicator will provide you with the conditional levels and immediate target ranges. A break above a conditional level generally means a move to the high range and a break below, a move to the low range.
If a ticker extends beyond the immediate forecasted range, the indicator has the ability to expand the ranges (see example below):
It will do this automatically in response to a range exceedance.
The indicator anchors from the previous day close, which gives it the ability to show you the next day targets and thresholds:
In addition to being able to plot the next day targets, it is also capable of auto generating a probability assessment based on the model it creates:
The indicator provides 2 probability types, momentum probability which uses technicals and z-score probability which uses standard deviation:
It will display the backtest results as well as a break down of the similar cases identified (see image above).
If there are no cases, the indicator will alert you. You can then change the probability type to see if the other one can find cases:
Make sure when you are running the probability assessment, your chart matches the timeframe you are running the assessment for!
The indicator also provides a trade planner to help you ascertain high probability trades based on each unique ticker's behaviour. When toggled on, it will display the various condition possibilities, and the common resulting behaviour:
You can also get shorter timeframe levels, here is an example of hourly levels:
The indicator also works really well with most Crypto.
Here is BTC using weekly levels:
And ADAUSD using monthly levels:
In addition to running an autoregression forecast, you can also run an ARIMA plot directly from the indicator itself and have it plot the bullish or bearish case:
Bullish case:
Bearish case:
The indicator is intended as a stand-alone indicator and can be used as its own strategy. The strategy is fairly straight forward, a break and hold of the bullish conditional, long to the high targets, inverse for a break of the bearish.
Key take-aways and tips:
Can be used on all timeframes;
When running probabilities, please ensure that you are on the chart you are running the probabilities for. So if you are running for the next day, please make sure you are on the daily timeframe.
The ARIMA and Autoregression will default to whichever timeframe you are on.
And that is the indicator!
Let me know your questions below and enjoy!

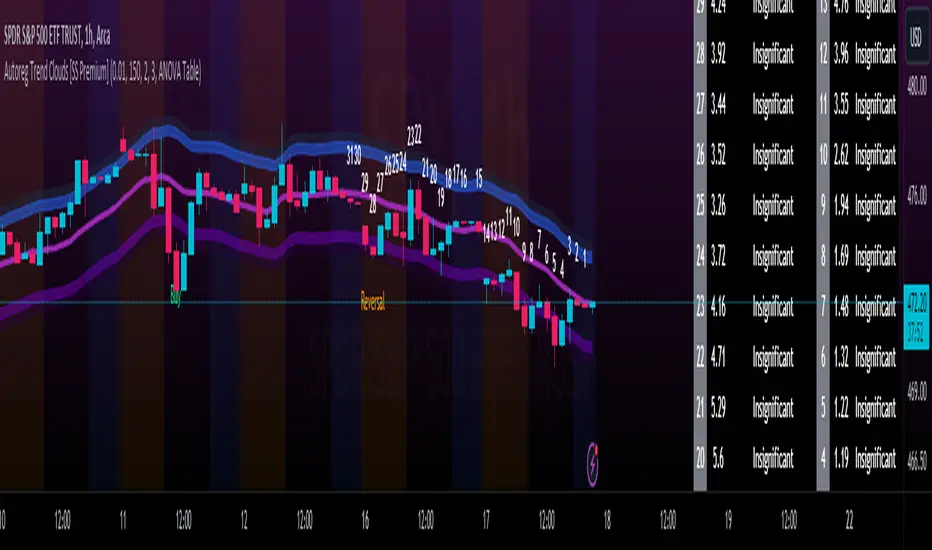
Autoreg Trend Clouds [SS Premium]This is the autoregressive (or Autoreg) trend cloud indicator included in the Pro and Elite trading level.
About:
The autoregressive trend clouds operate on 2 major statistical concepts, as the name implies, the use of autoregression being the primary facet, as well as the use of an ANOVA statistical analysis of mean variance. I will elaborate on each of these below, but first will discuss the gist of what the indicator does.
The indicator plots the expected range based on an autogenerated autoregressed model of the stock. The indicator will train itself for lookback time and for modelling and will fit a model to whichever ticker, index, FOREX or crypto, etc. you are on.
These clouds represent the anticipated range for an instrument to fall in based on its current trend and its autoregressed relationship.
Below is an example with BTC on the 1 hour:
And QQQ on the 1 hour:
Autoregression:
The autoregression model uses an automatic trend identifier to identified the appropriate lookback length. It then generates two types of models, a lag 1 model (1 lag autoregression back) and a 3 lag model (using the last 3 lags, or candles, to create a model). It then compares which model is stronger and selects the best fit. It identifies this by looking at the R (correlation) of the models performance.
ANOVA:
ANOVA stands for Analysis of Variance. It is a statistical test commonly used in comparative analyses based research. What it does is it compares the statistical significance of the variance between a group of means. In this indicator, the ANOVA is uses 3 variables, the lagged high, lagged low and lagged close value over a 14 candle lookback period. In my observations, these settings have been very useful in identifying pivots and breakouts when a significant ANOVA is triggered.
There are two ways to visualize this with this indicator. The first is by just looking at the chart. When a significant ANOVA results, the chart will display "Reversal" (see below):
Reversal is a bit of a misnomer, because it doesn't always mean that a "reversal" will happen, but that a big move is coming. In this case, the stock broke out to the upside.
How do you know which direction it will go? You can get an idea based on the position within the cloud, for example, when it is at the bottom of the range, reversal signals tend to mean it will go up:
But what it does more importantly is puts you on alert that something is about to happen, whether it is a pivot or a breakout/down.
ANOVA has also been applied to buy and sell signals that the indicator produces:
The indicator will look at the SMA of the ANOVA, as well as the position of the stock in relation to the autoregerssion model, and decide when to signal a sell or buy signal. Generally, the parameters are a significant ANOVA that is above its SMA and a move outside of the expected range.
There is another way to visualize the ANOVA using this indicator, and that is with the candle counting chart:
This will show you areas of significance over the last 31 candles, so you can identify precise areas of reversals in the most recent trading history. The table and candle numbers can be toggled off as well.
Significance Value:
And important note needs to be made about the significance value. ANOVA requires a "critical value", a value that must be met in order for something to be deemed "statistically significant". There are different levels of critical values for ANOVA based on the desired confidence. All this means is, how strict to you want your signals to be. The general recommendation for this indicator is this:
On any timeframe 4 hours or below, leave the critical value at 0.01.
On any timeframe above 4 hours, including the daily timeframe, use 0.05 or 0.10.
You can toggle these settings in the menu:
It also works really well on the larger timeframes:
QQQ 1D:
Uses & Tips:
This can be used as a standalone indicator or in combination with other indicators/strategies. I personally use this indicator frequently on the 1 hour and 5 minute timeframes to see where we are in relation to the anticipated range, and whether there is any significance on the ANOVA analysis.
Some tips for use:
Works best on the 5 minute chart for intra-day trades.
Works best on a ranging market on the shorter timeframes.
Works great on the larger timeframes in all markets!
Can be used on any instrument, be it Crypto, commodities, futures, indices etc..
And that is the indicator!
As always leave your questions and comments below.
For access, please follow the instructions below.
Safe trades everyone!
F.B_Vortex Indicator ProThe "F.B_Vortex Indicator Pro" is a technical analysis tool designed to identify trends in financial markets. It calculates two Vortex Indicators (VI) based on price movements, considering positive and negative price changes.
The smoothed VI+ line represents the smoothed negative trend, while the smoothed VI+ line represents the smoothed positive trend.
The crossing of the smoothed VI+ line above the smoothed VI+ line could indicate a potential bullish trend.
Conversely, the crossing of the smoothed VI+ line above the smoothed VI+ line suggests a possible bearish trend.
The "Smoothed VI-" line is also displayed.
When the Smoothed VI- line is above both the smoothed VI+ line and the smoothed VI+ line, it may signal a transition to a bearish main trend or indicate an expected one.
When the Smoothed VI- line is below both the smoothed VI+ line and the smoothed VI+ line, it may indicate a transition to a bullish main trend or suggest an expected one.
Adjustments can be made using input parameters such as length and smoothing periods to tailor the indicator to specific market conditions.

Machine Learning: Radius Neighbors Regressor[Pofatoezil] My native language is Chinese. The following introduction is translated using ChatGPT, and I hope the translation is fluent.
Introduction
This indicator is based on the machine learning model, Radius Neighbors Regressor, which predicts the target based on the similarity of past 500 input data. The provided indicator itself is merely a tool, requiring users to input features for comparison based on their preferences. In this indicator, you can utilize up to seven types of data for regression analysis and predict target values for up to three different time periods. It is essential for users to identify features suitable for their specific commodity on their own.
What is Radius Neighbor
The Radius Neighbors Regressor is a machine learning model used for regression tasks, specifically within the realm of supervised learning. It operates based on the principle of radius-based neighbor searches, where the algorithm predicts a target variable by considering the similarity of data points within a specified radius.
Unlike KNN, which considers a fixed number of nearest neighbors, Radius Neighbors Regressor allows for a flexible definition of neighborhoods by specifying a radius. This can be advantageous when dealing with varying densities in the dataset.
The radius-based approach may offer improved robustness in situations where the distribution of neighbors is not uniform or when dealing with outliers, as it considers all data points within the specified radius.
Parameter Settings and Output
Users need to import data(such as KD,RSI,ATR,CCI,MA,Volume....) from the TradingViewChart into the indicator first, and they can choose up to seven types. Then, they select the forecasting period and the regression target (such as Close, MA....). Afterward, set the maximum search radius, where the maximum value of the radius is the square root of N, where N is the number of features used. I recommend using 10% to 15% of the square root of N as the initial parameters.
Left Table
Neighbors: Indicates how many data points among the past 500 records are sufficiently close to the current data.
Ev: The target value predicted by the model.
WR: The probability of predicting a value greater than 0, noting that this is only meaningful for data values related to prices (Close, MA...).
Right Table
Distribution of predicted values for different periods. For example, 90% represents the predicted values at the 90th percentile among the past 500 data points. RK represents the real-time data ranking among past data, ranging from 0 to 100, where a higher number is more suitable for a long position, and vice versa for a short position.
example
I believe that this indicator has many suitable applications, but relying solely on it as a basis for trading decisions may pose risks. I'll leave it to you to explore.
DayChart
H1Chart
After Open Position
First, I observed on the DayChart that the indicator showed a neutral stance in the short, medium, and long term. Additionally, on the H1Chart, I noticed stronger bullish signals in the short, medium, and long-term data. Consequently, I decided to go long for an intraday position.

Divergence AnalyzerUnlock the potential of your trading strategy with the Divergence Analyzer, a sophisticated indicator designed to identify divergence patterns between two financial instruments. Whether you're a seasoned trader or just starting, this tool provides valuable insights into market trends and potential trading opportunities.
Key Features:
1. Versatility in Symbol Selection:
- Choose from a wide range of symbols for comparison, including popular indices like XAUUSD and SPX.
- Seamlessly toggle between symbols to analyze divergences and make informed trading decisions.
2. Flexible Calculation Options:
- Customizable options allow you to use a different symbol for calculation instead of the chart symbol.
- Fine-tune your analysis by selecting specific symbols for comparison based on your trading preferences.
3. Logarithmic Scale Analysis:
- Utilizes logarithmic scales for accurate representation of price movements.
- Linear regression coefficients are calculated on the logarithmic scale, providing a comprehensive view of trend strength.
4. Dynamic Length and Smoothing:
- Adjust the length parameter to adapt the indicator to different market conditions.
- Smoothed linear regression with exponential moving averages enhances clarity and reduces noise.
5. Standard Deviation Normalization:
- Normalizes standard deviations over 200 periods, offering a standardized view of price volatility.
- Easily compare volatility levels across different symbols for effective divergence analysis.
6. Color-Coded Divergence Visualization:
- Clearly distinguish positive and negative divergences with customizable color options.
- Visualize divergence deltas with an intuitive color scheme for quick and effective interpretation.
7. Symbol Information Table:
- An included table provides at-a-glance information about the selected symbols.
- Identify Symbol 1 and Symbol 2, along with their corresponding positive and negative divergence colors.
How to Use:
1. Select symbols for analysis using the user-friendly inputs.
2. Customize calculation options based on your preferences.
3. Analyze the divergence delta plot for clear visual indications.
4. Refer to the symbol information table for a quick overview of selected instruments.
Empower your trading strategy with the Divergence Analyzer and gain a competitive edge in the dynamic world of financial markets. Start making more informed decisions today!

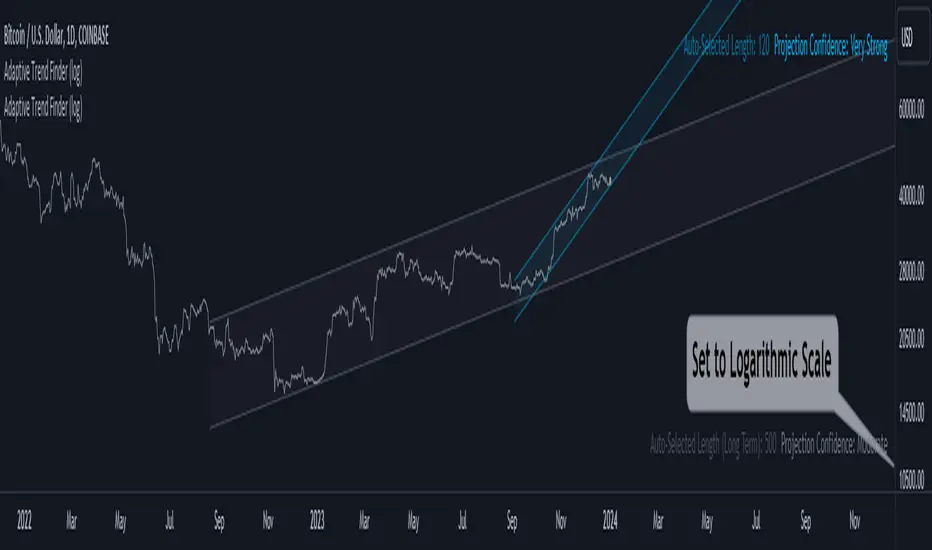
Adaptive Trend Finder (log)In the dynamic landscape of financial markets, the Adaptive Trend Finder (log) stands out as an example of precision and professionalism. This advanced tool, equipped with a unique feature, offers traders a sophisticated approach to market trend analysis: the choice between automatic detection of the long-term or short-term trend channel.
Key Features:
1. Choice Between Long-Term or Short-Term Trend Channel Detection: Positioned first, this distinctive feature of the Adaptive Trend Finder (log) allows traders to customize their analysis by choosing between the automatic detection of the long-term or short-term trend channel. This increased flexibility adapts to individual trading preferences and changing market conditions.
2. Autonomous Trend Channel Detection: Leveraging the robust statistical measure of the Pearson coefficient, the Adaptive Trend Finder (log) excels in autonomously locating the optimal trend channel. This data-driven approach ensures objective trend analysis, reducing subjective biases, and enhancing overall precision.
3. Precision of Logarithmic Scale: A distinctive characteristic of our indicator is its strategic use of the logarithmic scale for regression channels. This approach enables nuanced analysis of linear regression channels, capturing the subtleties of trends while accommodating variations in the amplitude of price movements.
4. Length and Strength Visualization: Traders gain a comprehensive view of the selected trend channel, with the revelation of its length and quantification of trend strength. These dual pieces of information empower traders to make informed decisions, providing insights into both the direction and intensity of the prevailing trend.
In the demanding universe of financial markets, the Adaptive Trend Finder (log) asserts itself as an essential tool for traders, offering an unparalleled combination of precision, professionalism, and customization. Highlighting the choice between automatic detection of the long-term or short-term trend channel in the first position, this indicator uniquely caters to the specific needs of each trader, ensuring informed decision-making in an ever-evolving financial environment.
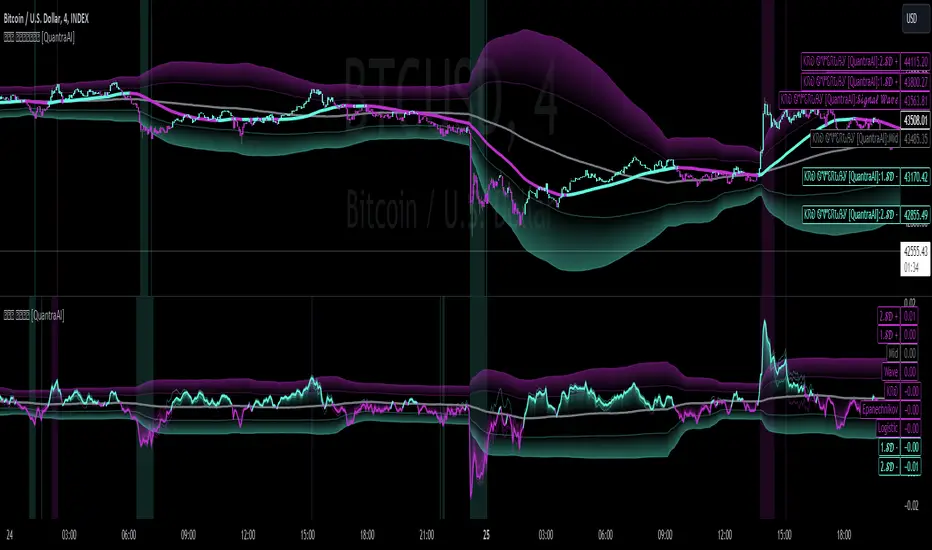
Triple Confirmation Kernel Regression Overlay [QuantraSystems]Kernel Regression Oscillator - Overlay
Introduction
The Kernel Regression Oscillator (ᏦᏒᎧ) represents an advanced tool for traders looking to capitalize on market trends.
This Indicator is valuable in identifying and confirming trend directions, as well as probabilistic and dynamic oversold and overbought zones.
It achieves this through a unique composite approach using three distinct Kernel Regressions combined in an Oscillator.
The additional Chart Overlay Indicator adds confidence to the signal.
Which is this Indicator.
This methodology helps the trader to significantly reduce false signals and offers a more reliable indication of market movements than more widely used indicators can.
Legend
The upper section is the Overlay. It features the Signal Wave to display the current trend.
Its Overbought and Oversold zones start at 50% and end at 100% of the selected Standard Deviation (default σ = 3), which can indicate extremely rare situations which can lead to either a softening momentum in the trend or even a mean reversion situation.
The lower one is the Base Chart.
The Indicator is linked here
It features the Kernel Regression Oscillator to display a composite of three distinct regressions, also displaying current trend.
Its Overbought and Oversold zones start at 50% and end at 100% of the selected Standard Deviation (default σ = 2), which can indicate extremely rare situations.
Case Study
To effectively utilize the ᏦᏒᎧ, traders should use both the additional Overlay and the Base
Chart at the same time. Then focus on capturing the confluence in signals, for example:
If the 𝓢𝓲𝓰𝓷𝓪𝓵 𝓦𝓪𝓿𝓮 on the Overlay and the ᏦᏒᎧ on the Base Chart both reside near the extreme of an Oversold zone the probability is higher than normal that momentum in trend may soften or the token may even experience a reversion soon.
If a bar is characterized by an Oversold Shading in both the Overlay and the Base Chart, then the probability is very high to experience a reversion soon.
In this case the trader may want to look for appropriate entries into a long position, as displayed here.
If a bar is characterized by an Overbought Shading in either Overlay or Base Chart, then the probability is high for momentum weakening or a mean reversion.
In this case the trade may have taken profit and closed his long position, as displayed here.
Please note that we always advise to find more confluence by additional indicators.
Recommended Settings
Swing Trading (1D chart)
Overlay
Bandwith: 45
Width: 2
SD Lookback: 150
SD Multiplier: 2
Base Chart
Bandwith: 45
SD Lookback: 150
SD Multiplier: 2
Fast-paced, Scalping (4min chart)
Overlay
Bandwith: 75
Width: 2
SD Lookback: 150
SD Multiplier: 3
Base Chart
Bandwith: 45
SD Lookback: 150
SD Multiplier: 2
Notes
The Kernel Regression Oscillator on the Base Chart is also sensitive to divergences if that is something you are keen on using.
For maximum confluence, it is recommended to use the indicator both as a chart overlay and in its Base Chart.
Please pay attention to shaded areas with Standard Deviation settings of 2 or 3 at their outer borders, and consider action only with high confidence when both parts of the indicator align on the same signal.
This tool shows its best performance on timeframes lower than 4 hours.
Traders are encouraged to test and determine the most suitable settings for their specific trading strategies and timeframes.
The trend following functionality is indicated through the "𝓢𝓲𝓰𝓷𝓪𝓵 𝓦𝓪𝓿𝓮" Line, with optional "Up" and "Down" arrows to denote trend directions only (toggle “Show Trend Signals”).
Methodology
The Kernel Regression Oscillator takes three distinct kernel regression functions,
used at similar weight, in order to calculate a balanced and smooth composite of the regressions. Part of it are:
The Epanechnikov Kernel Regression: Known for its efficiency in smoothing data by assigning less weight to data points further away from the target point than closer data points, effectively reducing variance.
The Wave Kernel Regression: Similarly assigning weight to the data points based on distance, it captures repetitive and thus wave-like patterns within the data to smoothen out and reduce the effect of underlying cyclical trends.
The Logistic Kernel Regression: This uses the logistic function in order to assign weights by probability distribution on the distance between data points and target points. It thus avoids both bias and variance to a certain level.
kernel(source, bandwidth, kernel_type) =>
switch kernel_type
"Epanechnikov" => math.abs(source) <= 1 ? 0.75 * (1 - math.pow(source, 2)) : 0.0
"Logistic" => 1/math.exp(source + 2 + math.exp(-source))
"Wave" => math.abs(source) <= 1 ? (1 - math.abs(source)) * math.cos(math.pi * source) : 0.
kernelRegression(src, bandwidth, kernel_type) =>
sumWeightedY = 0.
sumKernels = 0.
for i = 0 to bandwidth - 1
base = i*i/math.pow(bandwidth, 2)
kernel = kernel(base, 1, kernel_type)
sumWeightedY += kernel * src
sumKernels += kernel
(src - sumWeightedY/sumKernels)/src
// Triple Confirmations
Ep = kernelRegression(source, bandwidth, 'Epanechnikov' )
Lo = kernelRegression(source, bandwidth, 'Logistic' )
Wa = kernelRegression(source, bandwidth, 'Wave' )
By combining these regressions in an unbiased average, we follow our principle of achieving confluence for a signal or a decision, by stacking several edges to increase the probability that we are correct.
// Average
AV = math.avg(Ep, Lo, Wa)
The Standard Deviation bands take defined parameters from the user, in this case sigma of ideally between 2 to 3,
to help the indicator detect extremely improbable conditions and thus take an inversely probable signal from it to forward to the user.
The parameter settings and also the visualizations allow for ample customizations by the trader. The indicator comes with default and recommended settings.
For questions or recommendations, please feel free to seek contact in the comments.

Triple Confirmation Kernel Regression Base [QuantraSystems]Kernel Regression Oscillator - BASE
Introduction
The Kernel Regression Oscillator (ᏦᏒᎧ) represents an advanced tool for traders looking to capitalize on market trends.
This Indicator is valuable in identifying and confirming trend directions, as well as probabilistic and dynamic oversold and overbought zones.
It achieves this through a unique composite approach using three distinct Kernel Regressions combined in an Oscillator. The additional Chart Overlay Indicator adds confidence to the signal.
This methodology helps the trader to significantly reduce false signals and offers a more reliable indication of market movements than more widely used indicators can.
Legend
The upper section is the Overlay. It features the Signal Wave to display the current trend.
Its Overbought and Oversold zones start at 50% and end at 100% of the selected Standard Deviation (default σ = 3), which can indicate extremely rare situations which can lead to either a softening momentum in the trend or even a mean reversion situation.
The lower one is the Base Chart - This Indicator.
It features the Kernel Regression Oscillator to display a composite of three distinct regressions, also displaying current trend.
Its Overbought and Oversold zones start at 50% and end at 100% of the selected Standard Deviation (default σ = 2), which can indicate extremely rare situations.
Case Study
To effectively utilize the ᏦᏒᎧ, traders should use both the additional Overlay and the Base
Chart at the same time. Then focus on capturing the confluence in signals, for example:
If the 𝓢𝓲𝓰𝓷𝓪𝓵 𝓦𝓪𝓿𝓮 on the Overlay and the ᏦᏒᎧ on the Base Chart both reside near the extreme of an Oversold zone the probability is higher than normal that momentum in trend may soften or the token may even experience a reversion soon.
If a bar is characterized by an Oversold Shading in both the Overlay and the Base Chart, then the probability is very high to experience a reversion soon.
In this case the trader may want to look for appropriate entries into a long position, as displayed here.
If a bar is characterized by an Overbought Shading in either Overlay or Base Chart, then the probability is high for momentum weakening or a mean reversion.
In this case the trade may have taken profit and closed his long position, as displayed here.
Please note that we always advise to find more confluence by additional indicators.
Recommended Settings
Swing Trading (1D chart)
Overlay
Bandwith: 45
Width: 2
SD Lookback: 150
SD Multiplier: 2
Base Chart
Bandwith: 45
SD Lookback: 150
SD Multiplier: 2
Fast-paced, Scalping (4min chart)
Overlay
Bandwith: 75
Width: 2
SD Lookback: 150
SD Multiplier: 3
Base Chart
Bandwith: 45
SD Lookback: 150
SD Multiplier: 2
Notes
The Kernel Regression Oscillator on the Base Chart is also sensitive to divergences if that is something you are keen on using.
For maximum confluence, it is recommended to use the indicator both as a chart overlay and in its Base Chart.
Please pay attention to shaded areas with Standard Deviation settings of 2 or 3 at their outer borders, and consider action only with high confidence when both parts of the indicator align on the same signal.
This tool shows its best performance on timeframes lower than 4 hours.
Traders are encouraged to test and determine the most suitable settings for their specific trading strategies and timeframes.
The trend following functionality is indicated through the "𝓢𝓲𝓰𝓷𝓪𝓵 𝓦𝓪𝓿𝓮" Line, with optional "Up" and "Down" arrows to denote trend directions only (toggle “Show Trend Signals”).
Methodology
The Kernel Regression Oscillator takes three distinct kernel regression functions,
used at similar weight, in order to calculate a balanced and smooth composite of the regressions. Part of it are:
The Epanechnikov Kernel Regression: Known for its efficiency in smoothing data by assigning less weight to data points further away from the target point than closer data points, effectively reducing variance.
The Wave Kernel Regression: Similarly assigning weight to the data points based on distance, it captures repetitive and thus wave-like patterns within the data to smoothen out and reduce the effect of underlying cyclical trends.
The Logistic Kernel Regression: This uses the logistic function in order to assign weights by probability distribution on the distance between data points and target points. It thus avoids both bias and variance to a certain level.
kernel(source, bandwidth, kernel_type) =>
switch kernel_type
"Epanechnikov" => math.abs(source) <= 1 ? 0.75 * (1 - math.pow(source, 2)) : 0.0
"Logistic" => 1/math.exp(source + 2 + math.exp(-source))
"Wave" => math.abs(source) <= 1 ? (1 - math.abs(source)) * math.cos(math.pi * source) : 0.
kernelRegression(src, bandwidth, kernel_type) =>
sumWeightedY = 0.
sumKernels = 0.
for i = 0 to bandwidth - 1
base = i*i/math.pow(bandwidth, 2)
kernel = kernel(base, 1, kernel_type)
sumWeightedY += kernel * src
sumKernels += kernel
(src - sumWeightedY/sumKernels)/src
// Triple Confirmations
Ep = kernelRegression(source, bandwidth, 'Epanechnikov' )
Lo = kernelRegression(source, bandwidth, 'Logistic' )
Wa = kernelRegression(source, bandwidth, 'Wave' )
By combining these regressions in an unbiased average, we follow our principle of achieving confluence for a signal or a decision, by stacking several edges to increase the probability that we are correct.
// Average
AV = math.avg(Ep, Lo, Wa)
The Standard Deviation bands take defined parameters from the user, in this case sigma of ideally between 2 to 3,
to help the indicator detect extremely improbable conditions and thus take an inversely probable signal from it to forward to the user.
The parameter settings and also the visualizations allow for ample customizations by the trader. The indicator comes with default and recommended settings.
For questions or recommendations, please feel free to seek contact in the comments.
Polylog Regression - Bitcoin (BTC) [Logue]Polynomial Logarithmic Regression. The BTC cycle tops and bottoms were separately fit using a polynomial regression. The extensions are linear; meaning the extensions will overestimate the future top and bottom bands. The bottom band was fit on much more data than the top band, so is likely to be more reliable. The shape of the regression into the future was estimated, so may not be accurate into the future.
Use this indicator at your own risk. I make no claims as to its accuracy in forecasting future tops or bottoms of bitcoin.
This is used in the "BBI - Bitcoin Bottom Indicator," "BTI - Bitcoin Top Indicator", and the "BTB - Bitcoin Top and Bottom Indicator". Please see these indicators for more information as to how to support me developing more indicators in my spare time.

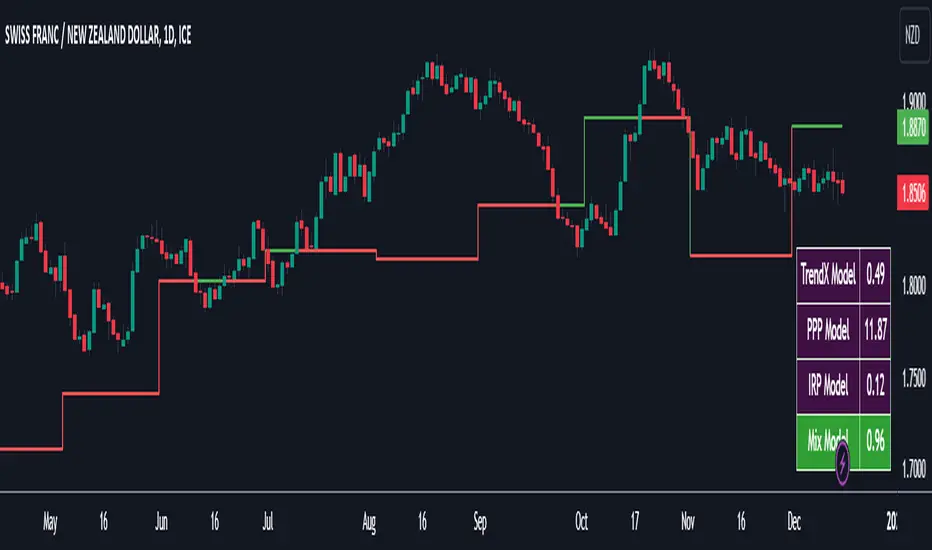
FX Forecasting Model [TrendX_]FX Forecasting Model indicator is a forecasting tool that takes advantages of macroeconomic analysis and market surveillance to predict Exchange rate movement.
*** Customize the macro data for home country (base currency) and foreign country
USAGE
This consists of 4 editable options align with 4 Forecasting Models
TrendX Model)
TrendX Model is a type of multiple linear regression, which is a statistical method that estimates the relationship between the currency exchange rate and various macroeconomic indicators.
*** Remember the 1st thing to do is to customize the macro data for home country (base currency) and foreign country, before take any further steps.
Purchasing Power Parity (PPP Model)
The PPP model is a conceptual model of currency exchange. The model illustrates how the exchange rate between two countries’ currencies is influenced by the variations in the prices of goods and services in those countries, which depend on the inflation rate. The activity of buying and selling goods and services internationally will shift the exchange rate to balance the prices in both countries.
Interest Rate Parity (IRP Model)
Interest Rate Parity (IRP) model is a theoretical model that relates the interest rates and the exchange rates of two countries. According to IRP, the difference between the forward and spot exchange rates of two currencies should be equal to the difference between their interest rates. IRP helps traders to determine the fair value of a currency pair and compare it with the market value. If the market value deviates from the fair value, then there is a potential for arbitrage or hedging.
Combined Forecast Model (Mixed Model)
Since each model has its own advantages, many people are interested in the concept of using a mix of forecasts to get better results than any single forecast. Mix Model is a method that uses different proportions of the forecasts from three models: TrendX, PPP and IRP models. The default proportion is 0.2 for TrendX, and 0.4 for both PPP and IRP. You can change these proportions according to your liking.
CONCLUSION
FX Forecasting Model Indicator is very practical for FOREX traders who wants to make informed and rational decisions based on Macroeconomic Analysis. It can help find arbitrage opportunity in currency exchange market. Accordingly, it can also be helpful for traders to use alongside other forms of Technical Analysis.
DISCLAIMER
The results achieved in the past are not all reliable sources of what will happen in the future. There are many factors and uncertainties that can affect the outcome of any endeavor, and no one can guarantee or predict with certainty what will occur.
Therefore, you should always exercise caution and judgment when making decisions based on past performance.
Chaos CypherOverview
Technically a smooth linear rate transformation, the "Chaos Cypher" drew some inspiration from the principles of Markov and chaos. Aside from price action, this combination provides a different lens through which to observe and interpret market movements. Markov models are based on the principle that future states depend only on the current state, not on the sequence of events that preceded it. Chaos theory deals with systems that are highly sensitive to initial conditions, a concept popularly referred to as the butterfly effect.
Efficient with Minimal Data: Designed to perform efficiently, the CC indicator is particularly useful in situations regardless of extensive historical data, except for obvious back testing, while still providing strength at identifying potential overbought/oversold zones and critical divergences.
Simplified Momentum Analysis: With further inspiration from the triple smoothed exponential rate, the CC actually uses linear regression for its calculations. This approach allows for a clear and more straightforward identification of deviations in momentum. The smoothing helps allow it to provide details while still operating at a fast pace due to the regression speed.
Adaptable to Various Timeframes: The transformation calculation then employed effectively narrows its scope in relation to the pace, enhancing its applicability across multiple timeframes and periods. This flexibility makes it a versatile tool suitable for various strategies and market conditions.
Fisher Transform Style Presentation: The indicator is presented in a style reminiscent of the Fisher Transform. However, this method of the script recalculates based on every individual dataset. To maintain efficiency, the adjustable length only applies to the regression rate.
The Chaos Cypher when compared to the Fisher Transform
Inversion Option for Leads: Lastly, an intriguing find when testing this script is the potential of the inversion option. This aspect proved particularly useful when searching for pullbacks on a trending market.
Conclusion
This indicator is designed to be forward-thinking and attempts to combine theoretical concepts with practicality. It has the ability to work with minimal data, adapt to various timeframes, and provide clear views of market movements. It back tested very well even when unrealistically used as a sole instrument.
"Two states differing by imperceptible amounts may eventually evolve into two considerably different states ... If, then, there is any error whatever in observing the present state—and in any real system such errors seem inevitable—an acceptable prediction of an instantaneous state in the distant future may well be impossible....In view of the inevitable inaccuracy and incompleteness of weather observations, precise very-long-range forecasting would seem to be nonexistent." -Edward Norton Lorenz

Kernel Regression RibbonKernel Regression Ribbon is a flexible, visually pleasing trend identification tool. Plotting 8 different kernel regressions of different types and parameters allows the user to see where levels of support and resistance are being tested, retested and broken.
What’s Kernel Regression?
A statistical method for estimating the best fitting curve for a dataset, in this case, a time/price chart.
How’s Kernel Regression different from a Moving Average?
A Moving Average is basically a simple form of Kernel Regression, in that it uses a fixed (Retangular) Kernel function. In an MA, all data points are weighted equally over its length. However, a Kernel function reacts more to data points that are closer to the current point. This means it will adapt more quickly to changes in data than an MA. Due to this adaptability, Kernel functions often form part of Machine Learning.
Using this indicator:
Explore the default Regular mode first to get a feel for the inputs, which are more numerous than for MAs. Try out different settings, filters and intervals to get the best out of each kernel. Not all parameters are available for each KR. There are info tips to explain this in the menu, but I’ve also included handy, optional labels on the chart for each KR as a more accessible guide.
Once you know your way round the Regular mode, check out the Presets and start changing the parameters of each kernel to your liking in the “User KR1, KR2, … “ mode. Each kernel type has its strong and weak points. Blending different kernels is where this indicator comes into its own. Give your charts a funky shine!
This indicator does NOT repaint.
This script acknowledges, and hopefully showcases, the great work of @veryfid Kernel Regression Toolkit.

COSTAR Strategy [SS]A little late posting this but here it is, as promised!
This is the companion to the COSTAR indicator.
What it does:
It creates a co-integration paired relationship with a separate, cointegrated ticker. It then plots out the expected range based on the value of the cointegrated pair. When the current ticker is below the value of its co-integrated partner, it becomes a "Buy" and should be longed. When it becomes overvalued in comparison, it becomes a "Sell" and should be shorted.
The example above is with BA and USO, which have a strong inverse relationship.
How it works:
I made the strategy version a bit more intuitive. Instead of you selecting the parameters for your model, it will autoselect the ideal parameters based on your desired co-integrated pair. You simply enter the ticker you want to compare against, and it will sort through the values at various lags to find significance and stationarity. It will then create a model and plot the model out for you on your chart, as you can see above.
The premise of the strategy:
The premise of the strategy is as stated before. You long when the ticker is undervalued in comparison to its co-integrated pair, and short when it is overvalued. The conditions for entry are simply a co-integrated pair being over the expected range (short) or below the expected range (long).
The condition to exit is a "re-integration", or a crossover of the expected value of the ticker (the centreline).
What if it can't find a relationship?
In some instances, the indicator will not be able to determine a co-integrated relationship, owning to a lack of stationarity between the data. When this happens, you will get the following error:
The indicator provides you with prompts, such as switching the timeframe or trying an alternative ticker. In the case displayed above, if we simply switch to the 1 hour timeframe, we have a viable model with great backtest results:
You can toggle in the settings menu the various parameters, such as timeframe, fills and displays.
And that is the strategy in a nutshell, be sure to check out its partner indicator, COSTAR, for more information on the premise of using co-integrated models for trading. And let me know your questions below!
Safe trades everyone!

Adaptiv Trend Projection with Dynamic Length RegressionThe Adaptive Trend Projection indicator is a robust tool designed to provide an optimal trend projection calculated in a highly sophisticated manner. By utilizing linear regression lengths ranging from 20 to 200, this indicator estimates the duration of the trend by dynamically adjusting the projection length based on the calculated trend's strength.
Key Features:
1. Dynamic Length Adjustment: The indicator intelligently adapts the projection length between 20 and 200 using linear regression, ensuring adaptability to market conditions.
2. Trend Strength Calculation: Through linear regression analysis, the indicator calculates the slope, average, and intercept for each selected length, providing insights into the strength and direction of the trend.
3. Deviation Analysis: Beyond traditional trend analysis, the indicator calculates standard deviation, Pearson's correlation coefficient, and deviation values, offering a comprehensive view of market dynamics.
4. Confidence Levels: A unique feature of the Adaptive Trend Projection is its ability to determine confidence levels based on the highest Pearson's R value. Reliability is categorized into levels such as Neutral, Moderate, High, Very High, and Ultra High, providing users with a quick assessment of the projection's robustness.
5. Dynamic Forecasting: The indicator not only analyzes historical data but extends its functionality by dynamically forecasting future trend points. The projection adjusts in length based on the strength of the trend, allowing for more accurate predictions.
6. Visual Clarity: Enhancing visual clarity, the Adaptive Trend Projection indicator uses different line styles, widths, and colors to highlight crucial points, making it easier for traders to interpret and act upon the information.
In conclusion, the Adaptive Trend Projection indicator offers a nuanced understanding of market trends by combining advanced linear regression techniques, deviation analysis, and confidence level assessments. This enables traders to make informed decisions.

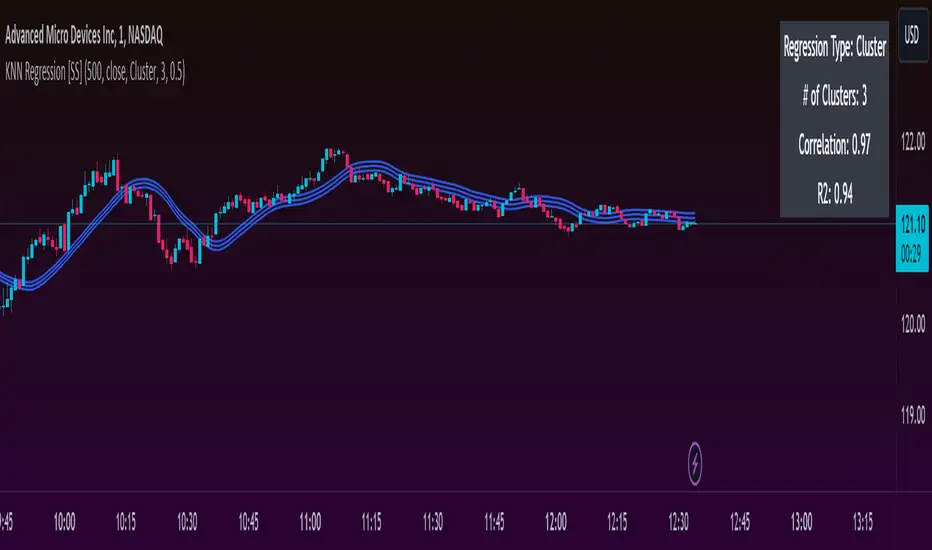
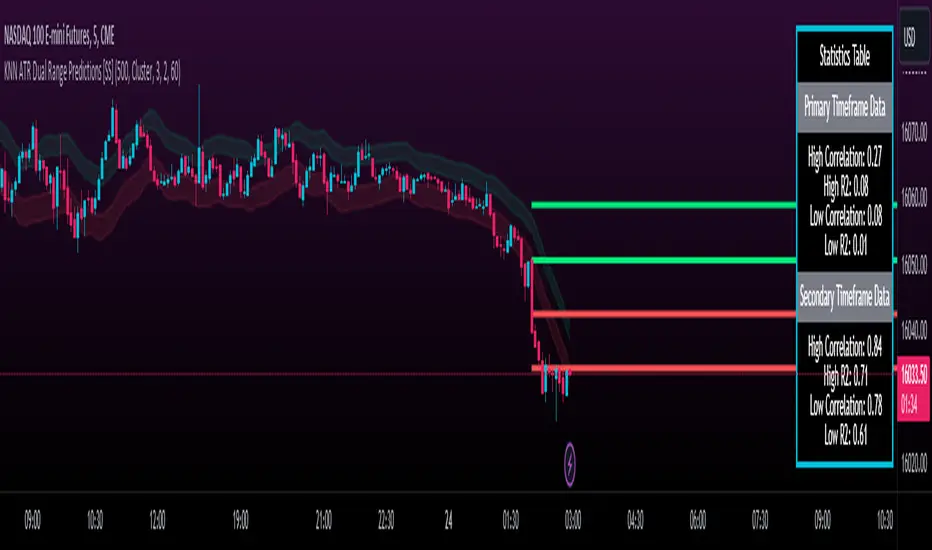
KNN ATR Dual Range Predictions [SS]Excited to release this indicator!
I wanted to do a machine learning, ATR based indicator for a while, but I first had to learn about machine learning algos haha.
Now that I have created a KNN based regression methodology (shared in a previous indicator), I can finally do it!
So this is a Nearest Known Neighbor or KNN regression based indicator that uses ATR (average ranges) to predict future ranges.
It operates by calculating the move from High to Open and Open to Low and performing KNN regression to look for other, similar instances of similar movements and what followed those movements.
It provides for 2 methods of KNN regression, the traditional Cluster method (where it identifies a number of clusters within a tolerance range and averages them out), or the method of last instance (where it finds the most recent identical instance and plots the result from that).
You can toggle the parameters as you wish, including the:
a) Type of Regression
b) Number of Clusters
c) Tolerance for Clusters
Others functions:
The indicator provides for the ability to view 2 different timeframe targets. The default calculation is the current timeframe you are on. So if you are on the 1 minute, 5 minute or 1 hour, it will automatically default the primary range to this timeframe. This cannot be changed.
But it permits for a second prediction to be calculated for a timeframe you can specify. The example in the chart above is the 1 hour overlaid on the 5 minute chart.
You can see how the model is performing in the statistics table. The statistics table can be removed as well if you don't want it overlaid on your chart.
You can also toggle off and on the various ranges. IF you only want to visualize 1 hour levels on a 5 minute chart, you can toggle off the bands and just view the higher tf data. Inversely, if you only want the current timeframe data and not the higher tf data, you can toggle the higher tf data off as well.
General Use Tips:
Some general use tips include:
🎯The default settings are appropriate for most common tickers. Because this is performing an autoregression on itself, the parameters tend to be more tight vs. performing dual correlation between two separate tickers which are sizably different in scale (which would require a higher tolerance).
Here is an example of YM1!, which is a sizably larger ticker, however it is performing well with the current settings.
🎯 If you get not great results from your ranges or an error in the correlation table, something like this:
It means the parameters are too tight for what you want to do and it is having trouble identifying other, similar cases (in this case, the lookback length was significantly shortened). The first step is to:
a) Expand your lookback range (up to 500 is usually sufficient). This should resolve most issues in most cases. If not:
b) If you are using the Cluster method, try broadening your cluster tolerance by 0.5 increments.
Between those two implementations, you should get a functional model. And it actually honestly hasn't happened to me in general use, I had to force that example by significantly shortening the lookback period.
Concluding Remarks
And that's pretty much the indicator.
I hope you enjoy it! I was really excited to be finally able to do it, like I said I attempted to do this for a while but needed to research the whole KNN process and how its performed.
Enjoy and leave your comments and questions below!
KNN Regression [SS]Another indicator release, I know.
But note, this isn't intended to be a stand-alone indicator, this is just a functional addition for those who program Machine Learning algorithms in Pinescript! There isn't enough content here to merit creating a library for (it's only 1 function), but it's a really useful function for those who like machine learning and Nearest Known Neighbour Algos (or KNN).
About the indicator:
This indicator creates a function to perform KNN-based regression.
In contrast to traditional linear regression, KNN-based regression has the following advantages over linear regression:
Advantages of KNN Regression vs. Linear Regression:
🎯 Non-linearity: KNN is a non-parametric method, meaning it makes no assumptions about the underlying data distribution. This allows it to capture non-linear relationships between features and the target variable.
🎯Simple Implementation: KNN is conceptually simple and easy to understand. It doesn't require the estimation of parameters, making it straightforward to implement.
🎯Robust to Outliers: KNN is less sensitive to outliers compared to linear regression. Outliers can have a significant impact on linear regression models, but KNN tends to be less affected.
Disadvantages of KNN Regression vs. Linear Regression:
🎯 Resource Intensive for Computation: Because KNN operates on identifying the nearest neighbors in a dataset, each new instance has to be searched for and identified within the dataset, vs. linear regression which can create a coefficient-based model and draw from the coefficient for each new data point.
🎯Curse of Dimensionality: KNN performance can degrade with an increasing number of features, leading to a "curse of dimensionality." This is because, in high-dimensional spaces, the concept of proximity becomes less meaningful.
🎯Sensitive to Noise: KNN can be sensitive to noisy data, as it relies on the local neighborhood for predictions. Noisy or irrelevant features may affect its performance.
Which is better?
I am very biased, coming from a statistics background. I will always love linear regression and will always prefer it over KNN. But depending on what you want to accomplish, KNN makes sense. If you are using highly skewed data or data that you cannot identify linearity in, KNN is probably preferable.
However, if you require precise estimations of ranges and outliers, such as creating co-integration models, I would advise sticking with linear regression. However, out of curiosity, I exported the function into a separate dummy indicator and pulled in data from QQQ to predict SPY close, and the results are actually very admirable:
And plotted with showing the standard error variance:
Pretty impressive, I must say I was a little shocked, it's really giving linear regression a run for its money. In school I was taught LinReg is the gold standard for modeling, nothing else compares. So as with most things in trading, this is challenging some biases of mine ;).
Functionality of the function
I have permitted 3 types of KNN regression. Traditional KNN regression, as I understand it, revolves around clustering. ( Clustering refers to identifying a cluster, normally 3, of identical cases and averaging out the Dependent variable in each of those cases) . Clustering is great, but when you are working with a finite dataset, identifying exact matches for 2 or 3 clusters can be challenging when you are only looking back at 500 candles or 1000 candles, etc.
So to accommodate this, I have added a functionality to clustering called "Tolerance". And it allows you to set a tolerance level for your Euclidean distance parameters. As a default, I have tested this with a default of 0.5 and it has worked great and no need to change even when working with large numbers such as NQ and ES1!.
However, I have added 2 additional regression types that can be done with KNN.
#1 One is a regression by the last IDENTICAL instance, which will find the most recent instance of a similar Independent variable and pull the Dependent variable from that instance. Or
#2 Average from all IDENTICAL instances.
Using the function
The code has the instructions for integrating the function into your own code, the parameters, and such, so I won't exhaust you with the boring details about that here.
But essentially, it exports 3, float variables, the Result, the Correlation, and the simplified R2.
As this is KNN regression, there are no coefficients, slopes, or intercepts and you do not need to test for linearity before applying it.
Also, the output can be a bit choppy, so I tend to like to throw in a bit of smoothing using the ta.sma function at a deault of 14.
For example, here is SPY from QQQ smoothed as a 14 SMA:
And it is unsmoothed:
It seems relatively similar but it does make a bit of an aesthetic difference. And if you are doing it over 14, there is no data loss and it is still quite reactive to changes in data.
And that's it! Hopefully you enjoy and find some interesting uses for this function in your own scripts :-).
Safe trades everyone!