Algorithmic Value Oscillator [CRYPTIK1]Algorithmic Value Oscillator
Introduction: What is the AVO? Welcome to the Algorithmic Value Oscillator (AVO), a powerful, modern momentum indicator that reframes the classic "overbought" and "oversold" concept. Instead of relying on a fixed lookback period like a standard RSI, the AVO measures the current price relative to a significant, higher-timeframe Value Zone .
This gives you a more contextual and structural understanding of price. The core question it answers is not just "Is the price moving up or down quickly?" but rather, " Where is the current price in relation to its recently established area of value? "
This allows traders to identify true "premium" (overbought) and "discount" (oversold) levels with greater accuracy, all presented with a clean, futuristic aesthetic designed for the modern trader.
The Core Concept: Price vs. Value The market is constantly trying to find equilibrium. The AVO is built on the principle that the high and low of a significant prior period (like the previous day or week) create a powerful area of perceived value.
The Value Zone: The range between the high and low of the selected higher timeframe.
Premium Territory (Distribution Zone): When the oscillator moves into the glowing pink/purple zone above +100, it is trading at a premium.
Discount Territory (Accumulation Zone): When the oscillator moves into the glowing teal/blue zone below -100, it is trading at a discount.
Key Features
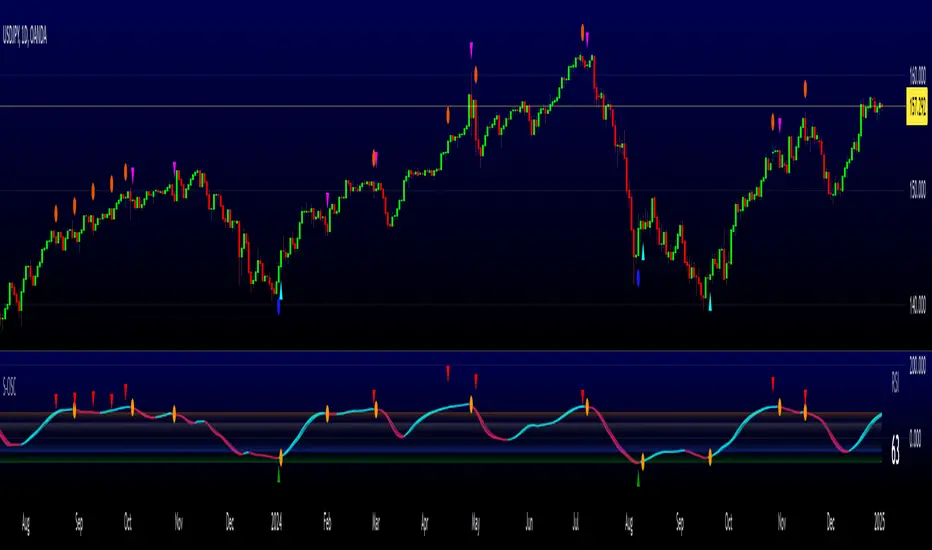
1. Glowing Gradient Oscillator: The main oscillator line is a dynamic visual guide to momentum.
The line changes color smoothly from light blue to neon teal as bullish momentum increases.
It shifts from hot pink to bright purple as bearish momentum increases.
Multiple transparent layers create a professional "glow" effect, making the trend easy to see at a glance.
2. Dynamic Volatility Histogram: This histogram at the bottom of the indicator is a custom volatility meter. It has been engineered to be adaptive, ensuring that the visual differences between high and low volatility are always clear and dramatic, no matter your zoom level. It uses a multi-color gradient to visualize the intensity of market volatility.
3. Volatility Regime Dashboard: This simple on-screen table analyzes the histogram and provides a clear, one-word summary of the current market state: Compressing, Stable, or Expanding.
How to Use the AVO: Trading Strategies
1. Reversion Trading This is the most direct way to use the indicator.
Look for Buys: When the AVO line drops into the teal "Accumulation Zone" (below -100), the price is trading at a discount. Watch for the oscillator to form a bottom and start turning up as a signal that buying pressure is returning.
Look for Sells: When the AVO line moves into the pink "Distribution Zone" (above +100), the price is trading at a premium. Watch for the oscillator to form a peak and start turning down as a signal that selling pressure is increasing.
2. Best Practices & Settings
Timeframe Synergy: The AVO is most effective when your chart timeframe is lower than your selected "Value Zone Source." For example, if you trade on the 1-hour chart, set your Value Zone to "Previous Day."
Confirmation is Key: This indicator provides powerful context, but it should not be used in isolation. Always combine its readings with your primary analysis, such as market structure and support/resistance levels.
Pine Script®指標