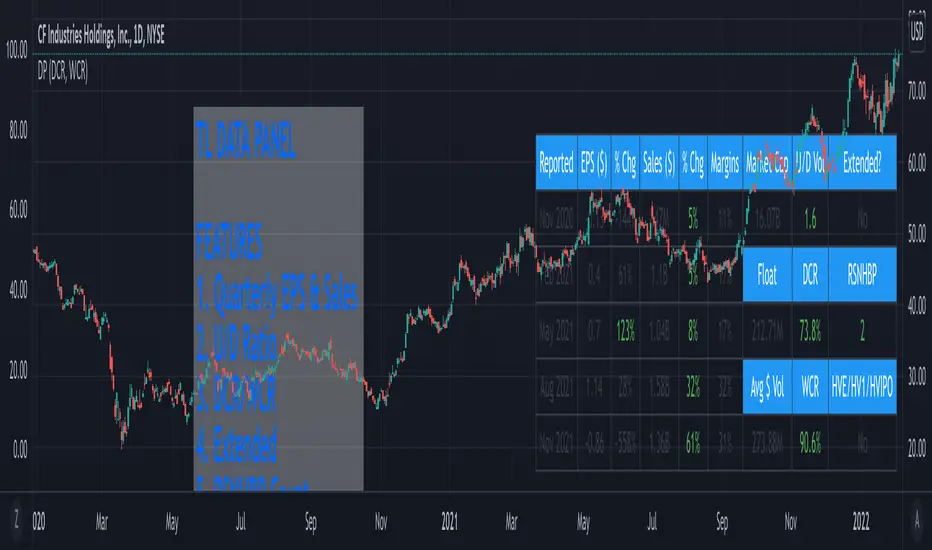
TL Data PanelIntroducing the TraderLion Data Panel
Features
1. Plot Quarterly EPS & Sales in a table. Disclaimer | TradingView data for EPS & Sales can be highly inaccurate in some cases.
2. U/D Ratio - Calculates the Up/Down Volume Ratio on a 50 Day Average or 20 Day Average. A number above 1.5 will show in green.
3. DCR - Calculates the Daily Closing Range for the stock. It's green when the DCR is greater than your benchmark (set in indicator settings) and greater than 50%.
4. WCR - Calculates the Weekly Closing Range for the stock. It's green when the DCR is greater than your benchmark (set in indicator settings) and greater than 50%.
5. Extended - Calculates if the stock is extended vs the 10DMA and 10WMA. The output will be Yes or No.
6. RSNHBP Count - Counts the number of RSNHBP in the past 30 sessions. Higher the count the better the odds of a stock performing well in the markets.
7. HV Stats - This shows if a stock meets the HVE/HV1/HVIPO criteria. HVE - Highest Volume Ever. HV1 - Highest Volume in One Year. HVIPO - Highest Volume Since IPO.
Customizations
Up Down Volume Length - Toggle between 50 Day or 20 Day.
Average $ Volume Length - Toggle between 50 Day or 20 Day.
Closing Range Benchmark - Set your benchmark vs any index.
RS Benchmark - Calculate RSNHBP benchmark vs any index.
Table Size - Tweak table size on personal preference.
Table Position - Tweak table position to top right, bottom left, bottom right, or top left.
Margins vs ROE - Toggle this setting to display Margins or ROE.
Color Theme - Toggle between Light or Dark Theme.
If you have any questions, please post them in the comments below!
Relative
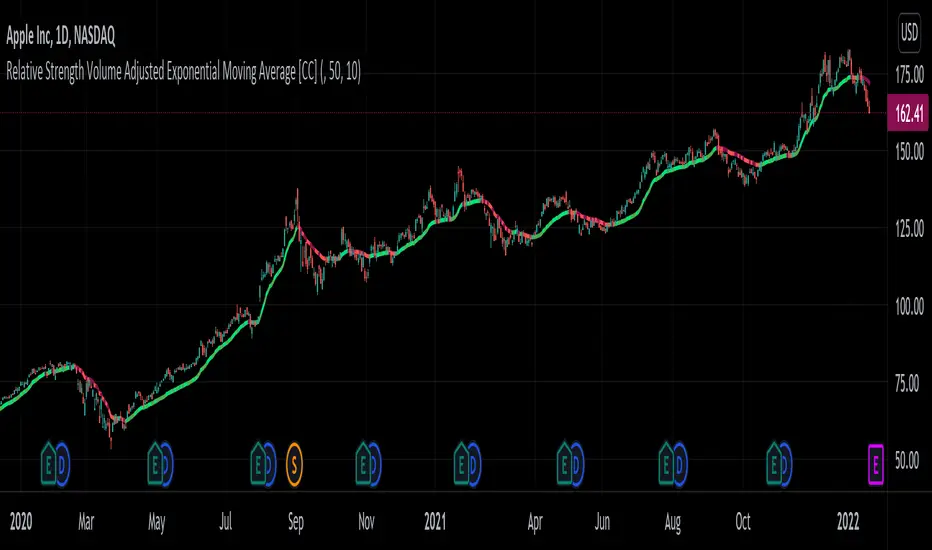
Relative Strength Volume Adjusted Exponential Moving Avg [CC]The Relative Strength Volume Adjusted Exponential Moving Average was created by Vitali Apirine (Stocks and Commodities Feb 2022 pgs 14-18) and this is very similar of course to the last Relative Strength Exponential Moving Average . It works under the same concept with using overbought and oversold methods to adjust the moving average and with this particular version you will notice that sudden drops or increases won't follow super closely so this can be useful along with the other as a good complementary indicator to use with each other to determine the short and medium term trend and to give good entry and exit points. I have strong buy and sell signals in addition to normal ones so darker colors are strong and lighter colors are normal. Buy when the indicator line turns green and sell when it turns red.
Let me know if there are any other indicators or scripts you would like to see me publish!
RSI Levels, Multi-TimeframeThe relative strength index (RSI) is a momentum indicator that measures the magnitude of recent price changes to evaluate overbought or oversold conditions. RSI is normally displayed as an oscillator separately from price and can have a reading from 0 to 100. This indicator takes the RSI and plots the 30 & 70 levels onto the price chart so you can see when price is going to meet the 30 or 70 levels. The reason the 30 & 70 levels are important is because many traders (and bots) use those as signals to buy (at 30 RSI) or sell (at 70 RSI). Additionally, this indicator allows you to display not just the RSI levels of your currently viewed timeframe on the chart, but also shows the RSI levels of up to 6 different timeframes on the same chart. This allows you to quickly see if multiple RSI levels are aligning across different timelines, which is an even stronger indication that price is going to change direction when it meets those levels on the chart. There are a lot of nice configuration options, like:
Style customization (color, thickness, size)
Labels on the chart so you can tell which plots are the RSI levels
Optionally display the plot as a horizontal line if all you care about is the RSI level right now
Toggle overbought (RSI 70) or oversold (RSI 30) on/off completely

Adaptive Relative Strength (ARS by Premal Parekh)Dear All,
This is my first public script modified to adapt the concept of Mr. Premal Parekh on Adaptive Relative Strength - ARS)
The original Script is developed by modhelius.
I have proved the version as per my requirement and included concept of ARS.
This script will remove the manual calculation task which is required on daily basis to calculate number of sessions from ARS Date.
Hope this script will be helpful.
If yes, do hit like button and share with your friends.
Ashish Kesarkar
India

Relative Strength Improved (Premal Parekh ASR Version)This script is improved over the existing script developed by Mr. modhelius
I have added ASR Concept of Mr. Premal Parekh.
This script will remove manual calculation of Trading Days from ASR Date.

Relative Strength ComparisonThis script plots the ratio between a ticker and the selected index. Currently, I have US equities indexes listed + BTC. It's a great way to check for relative strength, determine if absolute highs relative to the ratio are being made, etc.
Additionally, optional comparison of the RSI is included. I was just testing something out but figured I'd leave in here because why not. If you use this, enable the 1.0 line.
Script is a bit slow, will try to optimize eventually.

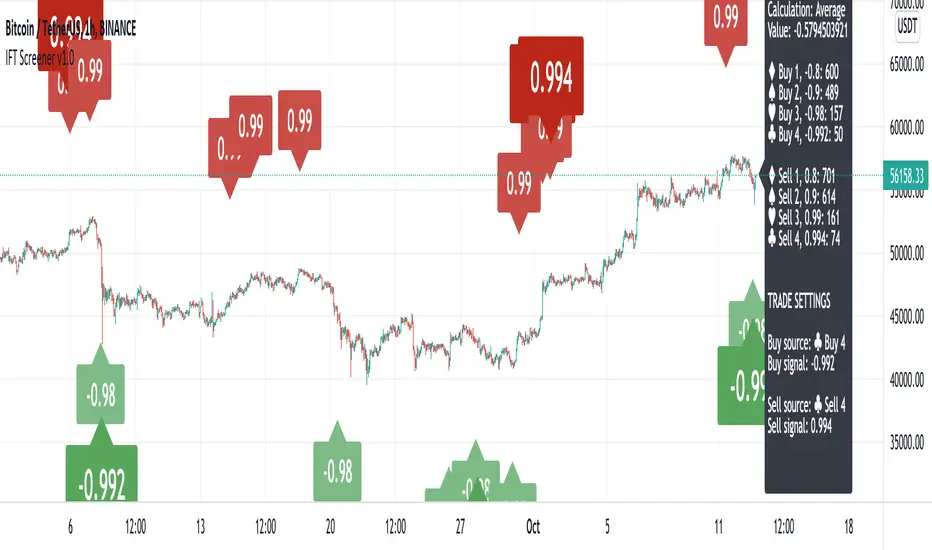
Inverse Fisher Transform ScreenerThis is a Screener for Inverse Fisher Transform on multiple oscillators
This tool is intended to aid you to visually analyse reasonable buy and sell IFT-signal thresholds across multiple tokens and different sources. It will help you speed up the tedious and manual work of trying out different IFT-settings when you're able to review the chart visually to find which values are present the most often and the location of that signal on the chart.
What does it bring to the table, why is it useful?
- Invese Fisher Transform on multiple oscillators such as RSI, MFI, CCI, Stochastic
- Combine multiple sources into one signal, select how it's calculated
- Visually review the chart for good IFT-settings
- 4 dynamic buy labels with different thresholds
- 4 dynamic sell labels with different thresholds
- Buy and sell on signal reversal
- Create your own trade alerts for automation
- Backtester compatible (plots 1 and 2 for buy and sell signals)
- A dynamic table counting amount of signals for each setting
- The labels are automatically updated when you change the values in the settings
How to use?
1. Change signal source and method
2. Change buy and sell thresholds
3. Show/hide additional labels
4. Review chart
5. Change trade settings
6. Backtest
7. Create alerts
Description
With this indicator you're able to visually review the signal strength of one or multiple oscillators processed with Inverse Fisher Transform ( IFT ), combine them and choose the method of calculation when they are combined. This produces a signal which strongly fluctuates between -1 and +1 instead of the more common 0-100 most oscillators uses. The intention is to make the decision making clearer and easier when you decide when to enter or exit a trade. This aims to help you remove the feelings from your trading.
Inverse Fisher Transform was first presented by John Ehlers in Stocks & Commodities V. 22:5 where he proposes to process RSI with the formula for hyperbolic tangent, tanh (x). This transforms the oscillator into a smoother and more compressed version with quicker oscillations.
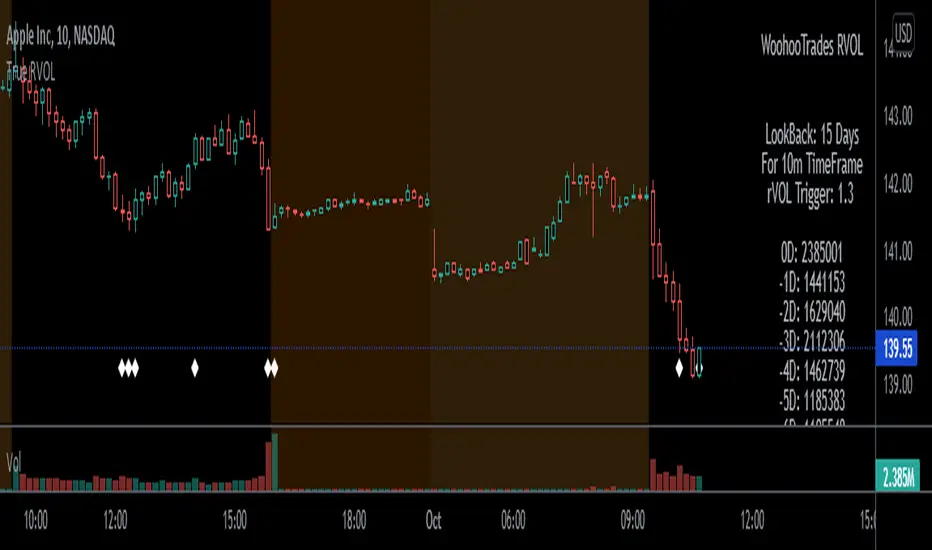
True Relative VolumeRelative Volume shows traders how "in-play" a current stonk is. Works great for day traders and scalpers!
Volume of Current TimeFrame's ratio to the average volume over X days back on the same time frame.
ie .
z = Volume at 0930-0940am over X days period divided by X
rVol = current volume divided by z
Dots at the bottom to indicate candles whose RVOL is morethan set minimum ratio.
Yes, its only 5 and 10 minutes. Might do calculations for other timeframes if this gets a good following.
Only works on US market session. 0930am to 0400pm EST.
Play Strategies :
- on break of support/resistance, if rvol supports action, ride direction of price action.
- look for in-play names, wait for price action to return to support/resistance area on low volume then
revisit if a bounce on the support/resistance line is supported by rVol again.
REMINDER!!!
This works only on 5 and 10 minutes TF. Dont forget to change your chart's timeframes.
This script will calculate erroneously if timeframe set on script and chart's current time frame are different.
Works even if extended market is enabled on your charts. It only looks at 0930 - 1600 EST bars.
Enjoy! Would love to hear your thoughts.
Relative Volume (rVol), Better Volume, Average Volume ComparisonThis is the best version of relative volume you can find a claim which is based on the logical soundness of its calculation.
I have amalgamated various volume analysis into one synergistic script. I wasn't going to opensource it. But, as one of the lucky few winners of TradingClue 2. I felt obligated to give something back to the community.
Relative volume traditionally compares current volume to prior bar volume or SMA of volume. This has drawbacks. The question of relative volume is "Volume relative to what?" In the traditional scripts you'll find it displays current volume relative to the last number of bars. But, is that the best way to compare volume. On a daily chart, possibly. On a daily chart this can work because your units of time are uniform. Each day represents a full cycle of volume. However, on an intraday chart? Not so much.
Example: If you have a lookback of 9 on an hourly chart in a 24 hour market, you are then comparing the average volume from Midnight - 9 AM to the 9 AM volume. What do you think you'll find? Well at 9:30 when NY exchanges open the volume should be consistently and predictably higher. But though rVol is high relative to the lookback period, its actually just average or maybe even below average compared to prior NY session opens. But prior NY session opens are not included in the lookback and thus ignored.
This problem is the most visibly noticed when looking at the volume on a CME futures chart or some equivalent. In a 24 hour market, such as crypto, there are website's like skew can show you the volume disparity from time of day. This led me to believe that the traditional rVol calculation was insufficient. A better way to calculate it would be to compare the 9:30 am 30m bar today to the last week's worth of 9:30 am 30m bars. Then I could know whether today's volume at 9:30 am today is high or low based on prior 9:30 am bars. This seems to be a superior method on an intraday basis and is clearly superior in markets with irregular volume
This led me to other problems, such as markets that are open for less than 24 hours and holiday hours on traditional market exchanges. How can I know that the script is accurately looking at the correct prior relevant bars. I've created and/or adapted solutions to all those problems and these calculations and code snippets thus have value that extend beyond this rVol script for other pinecoders.
The Script
This rVol script looks back at the bars of the same time period on the viewing timeframe. So, as we said, the last 9:30 bars. Averages those, then divides the: . The result is a percentage expressed as x.xxx. Thus 1.0 mean current volume is equal to average volume. Below 1.0 is below the average and above 1.0 is above the average.
This information can be viewed on its own. But there are more levels of analysis added to it.
Above the bars are signals that correlate to the "Better Volume Indicator" developed by, I believe, the folks at emini-watch and originally adapted to pinescript by LazyBear. The interpretation of these symbols are in a table on the right of the indicator.
The volume bars can also be colored. The color is defined by the relationship between the average of the rVol outputs and the current volume. The "Average rVol" so to speak. The color coding is also defined by a legend in the table on the right.
These can be researched by you to determine how to best interpret these signals. I originally got these ideas and solid details on how to use the analysis from a fellow out there, PlanTheTrade.
I hope you find some value in the code and in the information that the indicator presents. And I'd like to thank the TradingView team for producing the most innovative and user friendly charting package on the market.
(p.s. Better Volume is provides better information with a longer lookback value than the default imo)
Credit for certain code sections and ideas is due to:
LazyBear - Better Volume
Grimmolf (From GitHub) - Logic for Loop rVol
R4Rocket - The idea for my rVol 1 calculation
And I can't find the guy who had the idea for the multiples of volume to the average. Tag him if you know him
Final Note: I'd like to leave a couple of clues of my own for fellow seekers of trading infamy.
Indicators: indicators are like anemometers (The things that measure windspeed). People talk bad about them all the time because they're "lagging." Well, you can't tell what the windspeed is unless the wind is blowing. anemometers are lagging indicators of wind. But forecasters still rely on them. You would use an indicator, which I would define as a instrument of measure, to tell you the windspeed of the markets. Conversely, when people talk positively about indicators they say "This one is great and this one is terrible." This is like a farmer saying "Shovels are great, but rakes are horrible." There are certain tools that have certain functions and every good tool has a purpose for a specific job. So the next time someone shares their opinion with you about indicators. Just smile and nod, realizing one day they'll learn... hopefully before they go broke.
How to forecast: Prediction is accomplished by analyzing the behavior of instruments of measure to aggregate data (using your anemometer). The data is then assembled into a predictive model based on the measurements observed (a trading system). That predictive model is tested against reality for it's veracity (backtesting). If the model is predictive, you can optimize your decision making by creating parameter sets around the prediction that are synergistic with the implications of the prediction (risk, stop loss, target, scaling, pyramiding etc).
<3

GoldenCO Aie2 Use of GoldenCO Aie2
This market price movement trend analysis uses exponential moving average which is ema5/20/50. The purpose of using this EMA is to find out the effect of price changes that occur and the current trend of the market whether bullish or bearish.
It is suitable for short-term or long-term trading.
for short term trading, the trader uses ema5-ema20 and for long term trading the trader can use ema5-ema50 as analysis.
This indicator serves as a guide to traders in trading activities.
we hope that, by recognizing and knowing the trend of this price movement it can help traders in trading activities well and can reduce risk. May it benefit the trader.
DISCLAIMER : This is not Buy/Sell call, just sharing idea analysis for education. Trade at your own risk.
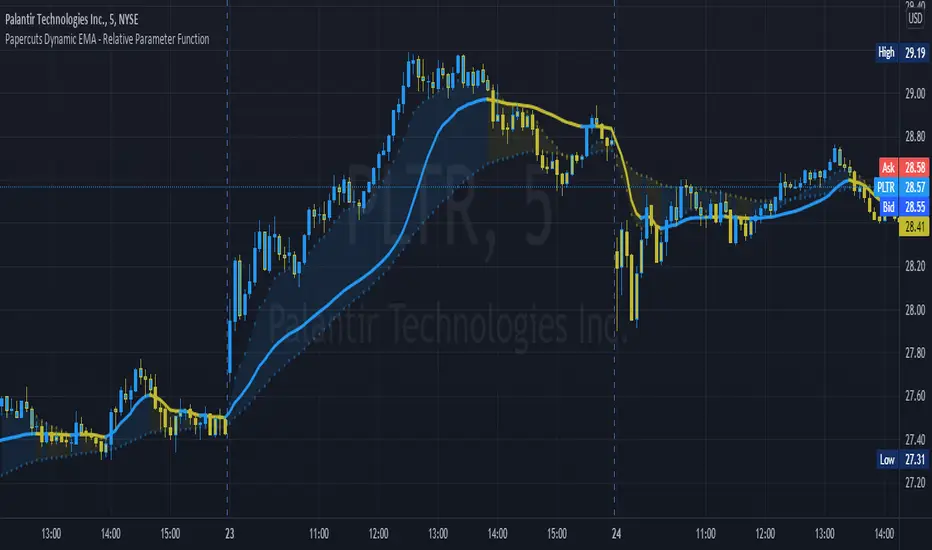
Papercuts Dynamic EMA - Relative Parameter FunctionThe goal of this is to link two parameters of different known low and high values so one affects the other.
In this case, I want to link Relative Volume to the length of an EMA, so it responds faster in times of high volume.
As an animator I am used to linking values in this way with Maya using a set driven key, took some work to figure it out in pine.
Looking up this concept, it has a few names, Relative values, linear interpolation, or rescale values.
Thanks to pinecoders for writing the EMA funciton that can accept length variables!
Here's a quick look at the root function to link the two values.
f_relativeVal(_source, in_bot, in_top, out_bot, out_top) =>
// float _source: input signal
// float in_bot : minimum range of input signal.
// float in_top : maximum range of input signal.
// float out_bot : minimum range of output signal.
// float out_top : maximum range of output signal.
clampSrc = _source > in_top ? in_top : _source < in_bot ? in_bot : _source //claps source to create a controlled range
//relInput = (clampSrc - in_bot) / (in_top - in_bot) * 100
inDiffIncrement = (in_top - in_bot)
outDiffIncrement = (out_top - out_bot)
out_bot + (clampSrc - in_bot) * outDiffIncrement / inDiffIncrement // rescale input range to output range
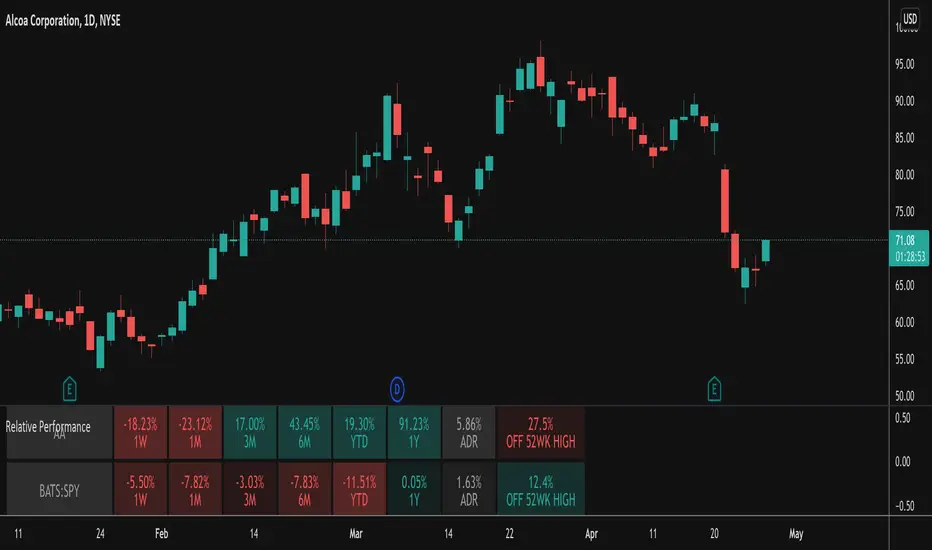
Relative PerformanceThis indicator takes the Performance Table from @BeeHolder and converts it to a Relative Performance table so you can compare the current chart vs. an Index (or whatever other ticker you want) to see the relative performance of one vs. the other. I also added a cell for ADR, which is also the same value as "Monthly Volatility" in the stock screener. This can be useful when screening stocks based on performance and volatility.
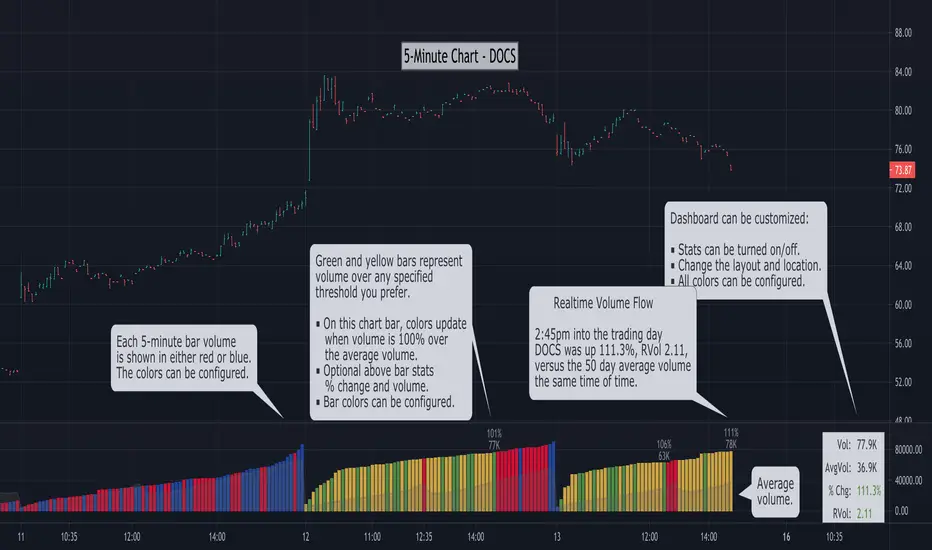
Relative Volume - Real-Time Volume [LevelUp]Relative volume compares the volume at a specific time in the trading day versus the prior volume at the same time of day over a specified range. This is an ideal way to gauge if there is significant volume driving a price move, either up or down.
What's Unique About this Relative Volume Indicator?
Many relative volume indicators simply divide the current volume by the average volume. Unfortunately, this calculation is not an accurate gauge of volume at a specific point in time and it will not account for typical spikes in volume that occur early and late in the day.
This indicator calculates relative volume on an intraday chart, looking at the volume for each bar in the current timeframe, over a range of days that is configured in Settings. For example, if the preferred lookback is set to 50 and you are on a 5-minute chart at 1:00pm, the indicator will determine the average of cumulative volume traded up to 1:00pm on each 5-minute bar, over the past 50 days. The result is an accurate representation of the "true" volume for a specific time in the day.
Relative Volume as Percentage or Ratio
Relative volume can be shown as a percentage change, a ratio or both. The calculations are the same, it's more about your preference.
For example, if a stock has traded 1M shares at 10:00am, yet the average over the past 50 days at 10:00am is 500k shares, the percentage increase is 100% and the ratio would be 2.0.
Intraday Charts
To accurately determine volume at a specific point during the trading day, as compared to the average at that same time of day, calculations need to be done on an intraday chart. This is your go-to chart to gauge realtime volume flow.
Daily, Weekly and Monthly Charts
Relative volume data is also shown on daily, weekly and monthly charts, however, it's important to note these values are based on the close of the respective timeframe.
Acknowledgement
Many thanks to @LucF and @e2e4mfck for their excellent open source indicator, Relative Volume at Time, for TradingView. If you are interested to learn more about the details of relative volume, this is the definitive resource.
Ehlers Relative Vigor Index [CC]The Relative Vigor Index was created by John Ehlers (Cybernetic Analysis For Stocks And Futures pg 58) and this is a momentum indicator that is similar to the Accumulation Distribution Oscillator created by Jim Waters and Larry Williams. He uses digital signal processing to smooth the indicator to provide clear buy and sell signals. The idea behind this indicator is that during uptrends, prices tend to close near the high and during downtrends, prices tend to close near the low. I have included strong buy and sell signals in addition to normal ones so strong signals are darker in color and normal ones are lighter in color. Buy when the line turns green and sell when it turns red. Usually the best signals I have found for this indicator is when the indicator is below the 0 line and turns green then it is usually a sign of a strong uptrend.
Let me know if there are any other scripts you would like to see me publish!

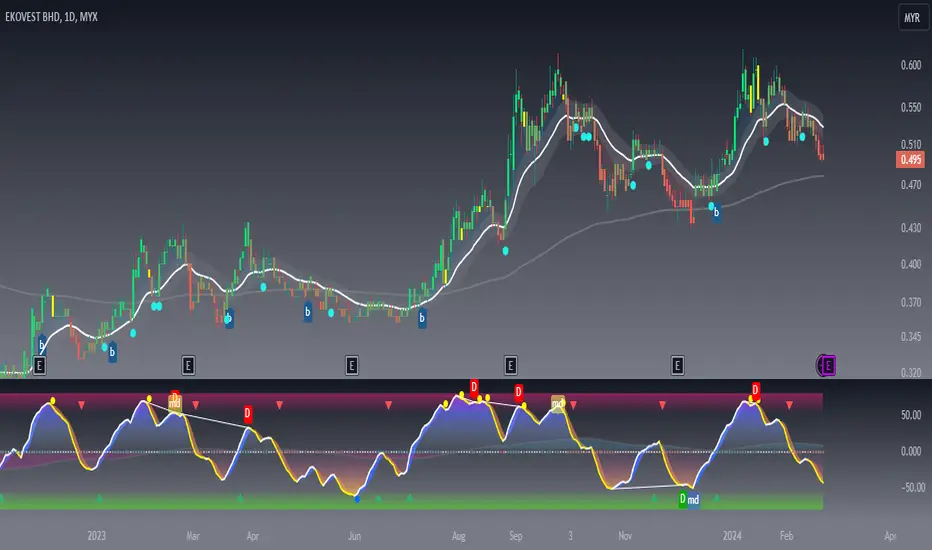
Volume Records + AlertContents
Overall Introduction
Settings menu parameters
Usage
How to use alerts
Limits
Overall Introduction
This indicator is a "volume analysis" tool for confirming the direction and strength of price trend and spotting trend reversals. This tool consists of two parts:
1- The colored graph is a custom volume oscillator which shows the relative changes in volume.
The darkening of the color of the bars is a sign of increasing volume.
2- Triangular labels that show trading volume records over different time periods based on the absolute values of the volume.
By creating an alert, you can be notified of new trading volume records. These records are:
Highest / lowest volume in one year,
Highest / lowest volume in six month
Highest / lowest volume in three month
Highest / lowest volume in one month
Highest / lowest volume in one week
Settings menu parameters
{Short Length} =>
The fast volume MA of the Volume Oscillator.
{Long Length} =>
The slow volume MA of the Volume Oscillator.
{Visual Parameters} =>
Parameters to personalize the appearance of the indicator.
{Alert Conditions Part 01: Highest Records ⏰ } =>
Parameters to customize the alert.
{Alert Conditions Part 02: Lowest Records ⏰ } =>
Parameters to customize the alert.
Usage
This indicator is a "volume analysis" tool for confirming the direction and strength of price trend and spotting trend reversals.
What Is Volume Analysis?
Volume analysis involves examining relative or absolute changes in an asset's trading volume in order to make inferences about future price movements.
A significant price increase along with a significant volume increase, for example, could be a credible sign of a continued bullish trend or a bullish reversal.
The gradual darkening of the bars is a sign of the strength of the trend.
Volume can be an indicator of market strength, as rising markets on increasing volume are typically viewed as strong and healthy.
How to use alerts
Note that by creating an alert, an instance of the indicator, with all your settings, will be activated on the site's server and alerts will be triggered by it.
After that, changing the indicator settings on the chart will no longer affect the alert.
Open the settings window and select the alert conditions as you wish
Click the Create Alert button (or press the A key while holding down the ALT key)
In the Condition section, select the name of the indicator.
Make the rest of the settings as you wish.
Finally, click on the Create button.
It's finished. After a few moments, your alert will be added to the Alerts menu.
Limits
The labels are displayed after the bars close.
Labels are displayed for the last 10,000 bars.

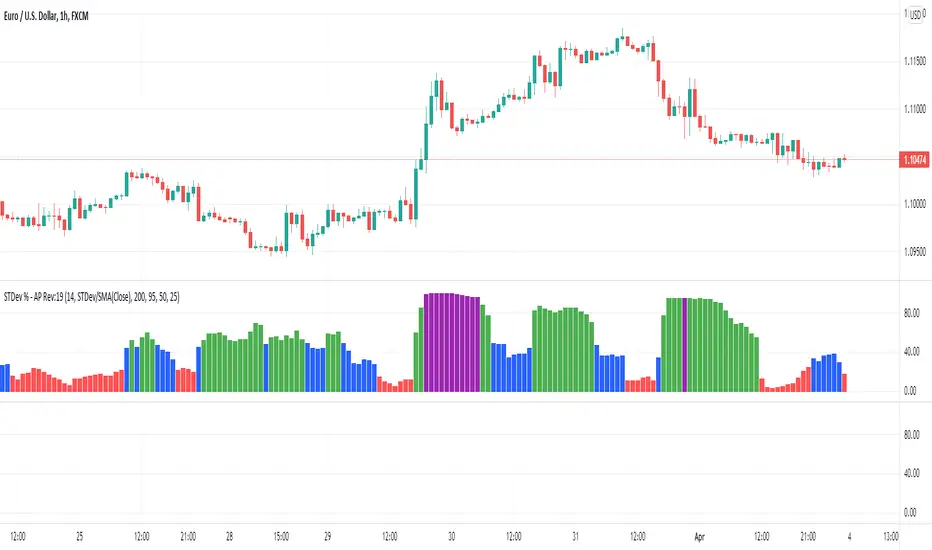
STDev % by Alejandro PThis is a simple indicator that expands the usability of Standard deviation into a universally usable indicator.
This indicator displays the volatility as standard deviation as a % of asset value, this allows using more standardized and comparable values across multiple instruments and asset classes.
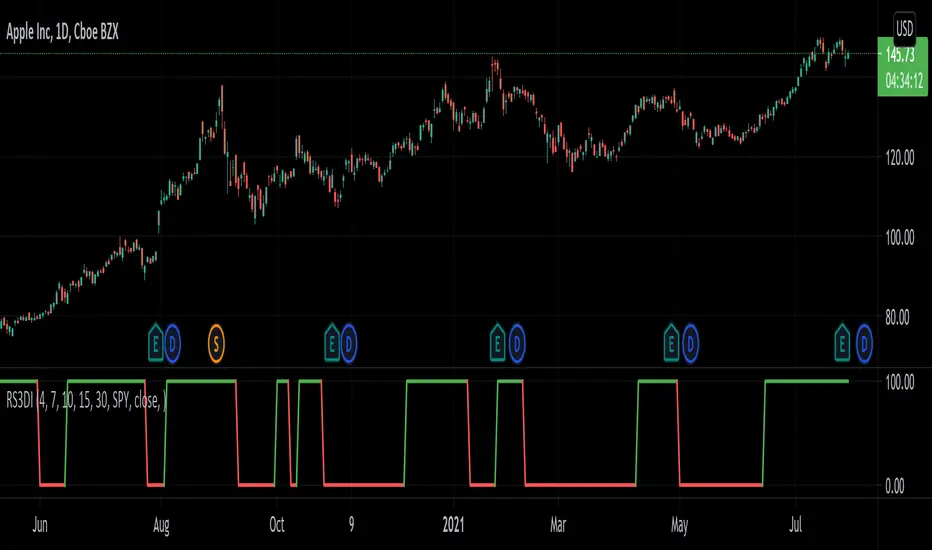
Relative Strength 3D Indicator [CC]This is a custom indicator of mine loosely based on the work by James Garofallou (Stocks and Commodities Sep 2020 pg 14) and this is meant for medium to long term trend confirmations. The idea behind this indicator is to capture 3 different dimensions of trend strength. The first dimension captures the overall strength of the underlying stock vs the market (in this case the S&P 500). The second dimension captures the overall trend strength by assigning a scoring system so when all faster moving averages are stronger than slower moving averages then it gets the max points. The final dimension is the strength of the overall strength of everything so far. Buy when the indicator line turns green and sell when it turns red.
Let me know if there are any other indicators or scripts you would like to see me publish!
Ultimate RSIsThis RSI script includes everything you could want on an RSI. There are multiple timeframes which will give context to market movement, as well as a highlight feature to make it easier to visualize overbought and oversold stocks.
Tip: Uncheck the 4 plots with no color in them to remove the extra headers on the indicator.

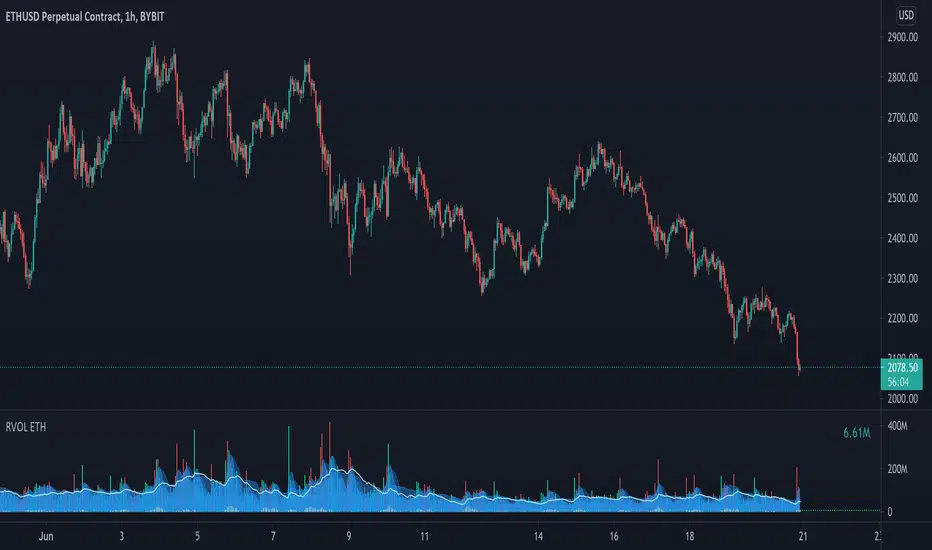
Relative Volume - ETHEREUMRelative Volume indicator that pulls data from 9 different Ethereum exchanges. Please note that this indicator only works with ETH and will not use data from your current chart.
Includes the following exchanges:
BYBIT:ETHUSD
BITFINEX:ETHUSD
BITSTAMP:ETHUSD
INDEX:ETHUSD
COINBASE:ETHUSD
FTX:ETHUSD
PHEMEX:ETHUSD
BITTREX:ETHUSD
POLONIEX:ETHUSDT
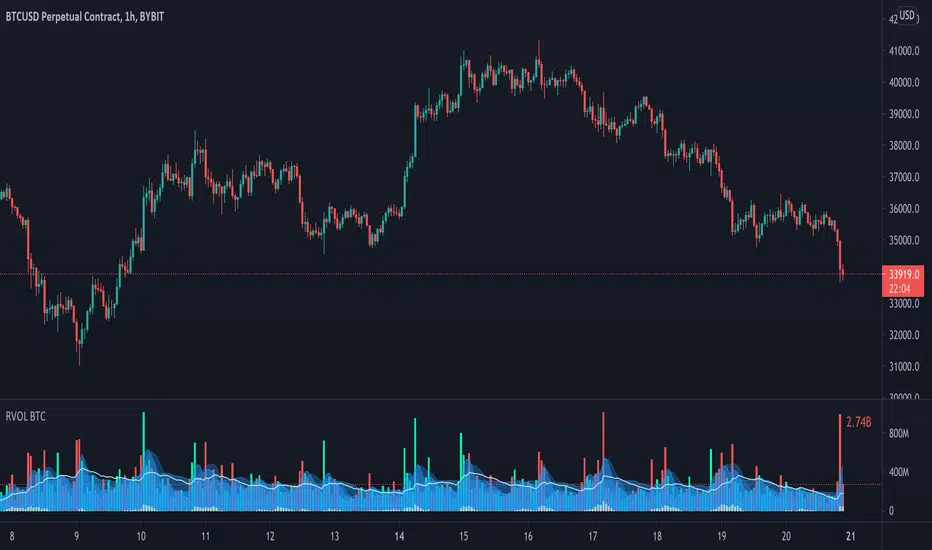
Relative Volume - BITCOINRelative Volume indicator that pulls data from 9 different Bitcoin exchanges. Please note that this indicator only works with BTC and will not use data from your current chart.
Includes the following exchanges:
BYBIT:BTCUSD
BITFINEX:BTCUSD
BITSTAMP:BTCUSD
INDEX:BTCUSD
COINBASE:BTCUSD
FTX:BTCUSD
PHEMEX:BTCUSD
BITTREX:BTCUSD
POLONIEX:BTCUSDT
Relative VolatilityRelative volatility highlights large changes in price. This was designed to be used with my relative volume indicator so that traders can see the effect of volume on price action. It is also a good tool to analyse breakout patterns to identify best entry points and waves.
Above shows relative volatility and relative volume working together.

Volatility OscillatorThis tool displays relative volatility and directional trend. Excellent way to pickup diversions and reversals. Length can be lowered to 11 or 13 in settings to show price range.
Can be used to identify patterns such as parallel channels and likely direction of price action as pictured below.

Relative VolumeVolume can be a very useful tool if used correctly. Relative volume is designed to filter out the noise and highlight anomalies assisting traders in tracking institutional movements. This tool can be used to identify stop loss hunters and organized dumps. It uses a variety of moving averages to hide usual activity and features an LSMA line to show trend. Trend columns are shown to highlight activity and can be seen at bottom of the volume columns, this is done using ZLSMA and LSMA.
The above chart shows an example of 2 indicators being used on the 15 min chart. The bottom indicator is set to the 1 min chart. Traders can see a large dump on the 1 min chart as institutions wipe out any tight stop losses. Next they buy back in scooping up all those long positions.
This is an example layout using a split screen setup and multiple timeframes ranging from 1 min to 30 mins. This gives a clear indication of trends and make it easy to pickup on institutional behaviour. Tip: Double clicking indicator background will maximize RVOL to the split screen window.
