Market First - Relative Strength/Weakness (the ZenBot strategy)This market-first trading strategy gives BUY, SHORT, and CLOSE signals based on volume, trend, and relative strength or weakness to the market (SPY by default, can be customized). This indicator is useful for signaling day-trade entries and exits for tickers that are strong (or weak) against the market.
Stocks that are showing relative strength (or weakness) to the market, are trending, and have decent movement generate a buy (or short) signal. When the trend runs out, a CLOSE signal is fired.
Potential profit (based on ATR) and actual profit is calculated, predicting the type of move expected
Unique 'stay in trade' logic helps prevent unnecessary CLOSE signals if a trend is likely to continue
A colored plot indicates the strength of the current trend and turns orange/red when the strength is weakened.
Crypto traders can uncheck 'Trade during market hours' for 24-hour trading, and should change the comparison ticker from SPY to BTCUSD or something similar for their market.
Enjoy!
KEY CONCEPTS
The three- and five-minute timeframes are used to establish and verify trend ( ADX /DI with custom logic)
Entries and exits are based on Parabolic SAR and confirmed on multiple timeframes, trend, and relative volume
Relative strength /weakness to the market compares ticker to SPY
Chop is avoided at all costs. I've experimented with choppiness indicator below 38, but found that the ADX DI+/- readings work even better.
Trend is established using ADX DI+/- readings over 20, confirmed by EMA 5/13 crossover and EMA5 slope
Signals will fire only if the average volume for the current 5-min bar is above normal
Only tickers with a five-bar / 13 period ATR of 1% the ticker's price generate signal.
Only longs above daily-anchored VWAP , shorts below daily-anchored VWAP
Signals fire on bar close to prevent repainting / look-ahead bias
Indicator labels and alerts generated
SIGNALS
BUY: up-trending tickers showing relative strength are bought on the three-minute PSAR
SELL: when the close price falls below the 1, 3, and 5-minute PSAR, or the ADX DI- falls below 20
SHORT: down-trending tickers with relative weakness are shorted on the three-minute PSAR
COVER: when the close price moves above the 1, 3, and 5-minute PSAR, or the ADX DI- falls below 20
ALERTS
Alerts are generated on BUY, SELL, SHORT, and COVER signals, as well as optional LOST RELATIVE STRENGTH and LOST RELATIVE WEAKNESS
INPUTS
Use relative strength /weakness comparison with the market : trigger trades based on the ticker's strength or weakness to the selected comparison ticker (usually SPY for equities or BTCUSD for crypto)
[* ]Comparison Ticker for relative strength /weakness : Ticker to compare against for relative strength /weakness
Trade during market hours only : Take buy/sells during specified hours. Disable this for crypto trading.
[* ]Market hours (market time) : Customize market hours - defaults to 9:30 to 16:00 EST
[* ]"Only trade very strong trends" : take trades only if an established trend is very strong ( ADX over 40 ) (DEFAULT = ON)
"Limit trade direction to VWAP" : Long trades only above VWAP , shorts below (DEFAULT = ON)
"Limit trade direction to Market direction" : Long trades only if SPY (or selected comparison ticker) is up, shorts if the market is down. (DEFAULT= ON)
"Limit trades based on a ticker's green/red status for the day" : Long trades if the ticker is green for the day, shorts if red. (DEFAULT = ON)
相對強弱比較(RSC)

Market First Signals - Relative Strength/WeaknessThis market-first trading strategy gives BUY, SHORT, and CLOSE signals based on volume, trend, and relative strength or weakness to the market (SPY by default, can be customized). This indicator is useful for signaling day-trade entries and exits for tickers that are strong (or weak) against the market.
Stocks that are showing relative strength (or weakness) to the market, are trending, and have decent movement generate a buy (or short) signal. When the trend runs out, a CLOSE signal is fired.
Potential profit (based on ATR) and actual profit is calculated, predicting the type of move expected
Unique 'stay in trade' logic helps prevent unnecessary CLOSE signals if a trend is likely to continue
A colored plot indicates the strength of the current trend and turns orange/red when the strength is weakened.
Crypto traders can uncheck 'Trade during market hours' for 24-hour trading, and should change the comparison ticker from SPY to BTCUSD or something similar for their market.
Enjoy!
KEY CONCEPTS
The three- and five-minute timeframes are used to establish and verify trend (ADX/DI with custom logic)
Entries and exits are based on Parabolic SAR and confirmed on multiple timeframes, trend, and relative volume
Relative strength /weakness to the market compares ticker to SPY
Chop is avoided at all costs. I've experimented with choppiness indicator below 38, but found that the ADX DI+/- readings work even better.
Trend is established using ADX DI+/- readings over 20, confirmed by EMA 5/13 crossover and EMA5 slope
Signals will fire only if the average volume for the current 5-min bar is above normal
Only tickers with a five-bar / 13 period ATR of 1% the ticker's price generate signal.
Only longs above daily-anchored VWAP, shorts below daily-anchored VWAP
Signals fire on bar close to prevent repainting / look-ahead bias
Indicator labels and alerts generated
SIGNALS
BUY: up-trending tickers showing relative strength are bought on the three-minute PSAR
SELL: when the close price falls below the 1, 3, and 5-minute PSAR, or the ADX DI- falls below 20
SHORT: down-trending tickers with relative weakness are shorted on the three-minute PSAR
COVER: when the close price moves above the 1, 3, and 5-minute PSAR, or the ADX DI- falls below 20
ALERTS
Alerts are generated on BUY, SELL, SHORT, and COVER signals, as well as optional LOST RELATIVE STRENGTH and LOST RELATIVE WEAKNESS
INPUTS
Use relative strength/weakness comparison with the market : trigger trades based on the ticker's strength or weakness to the selected comparison ticker (usually SPY for equities or BTCUSD for crypto)
Comparison Ticker for relative strength/weakness : Ticker to compare against for relative strength/weakness
Trade during market hours only : Take buy/sells during specified hours. Disable this for crypto trading.
Market hours (market time) : Customize market hours - defaults to 9:30 to 16:00 EST
"Only trade very strong trends" : take trades only if an established trend is very strong (ADX over 40) (DEFAULT = OFF)
"Limit trade direction to VWAP" : Long trades only above VWAP, shorts below (DEFAULT = ON)
"Limit trade direction to Market direction" : Long trades only if SPY (or selected comparison ticker) is up, shorts if the market is down. (DEFAULT= OFF)
"Limit trades based on a ticker's green/red status for the day" : Long trades if the ticker is green for the day, shorts if red. (DEFAULT = OFF)

SR Relative StrengthThis is a relative strength model for Indian Stock Markets where in the price of the stock in the current scenario is compared with the benchmark indices ( NIFTY / BANKNIFTY) over a period of 55 days ( by default).
This indicator also has RSI and Supertrend built-in by default. Hence this indicator can be used in place of 3 indicators.
How to use?
1. When the background is blue, it means that the stock is relatively strong as compared to the bench mark indices over a period of 55 days and the RSI is > 50
When both RS > 0 & RSI > 50 the background will be blue. If either or is true it won't turn blue.
2. Superternd by default setting is 10,3 which can be changed as per one's requirement.
Thanks!!

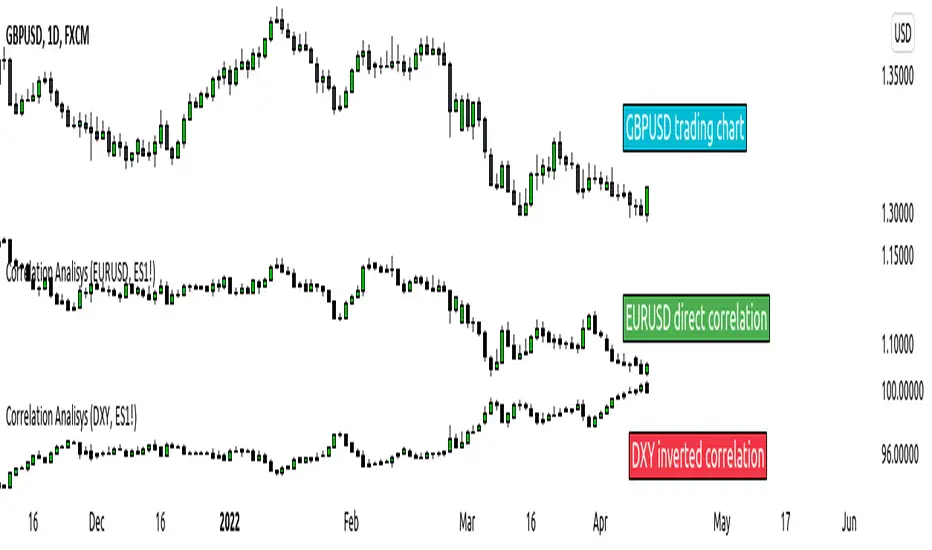
Greater Currency Correlation Matrix (Forex)Other available matrixes I found have a limited number of forex symbols. Consequentially, you need to keep switching them if you want to do a proper analysis. As a result of that, I produced my own currency matrix.
Correlation studies relationships between different price charts.
High correlation may be completely random in the short term, but it may signify a fundamental relationship between the two symbols if calculated over the long term.
For example, the currency of an oil-producing country may rally along with oil, whereas the importer's currency may drop. This means that watching the oil price chart may be worth it for such pairs.
The script includes all Major and Minor pairs with the addition of Gold (XAUEUR) and two optional symbols.
▬▬▬▬
To avoid too frequent use of security(), I decided to calculate all symbol values from EUR pairs. It should improve performance and keep room for some additional symbols in the future.
Please report any bugs.
Overlay Mini Plot(s) of Correlated Asset(s)Overlay a small plot of a correlated asset of your choosing. Shrink/expand, Set vertical and horizontal position, plot multiple mini-plots via duplicate indicators with varied settings.
Plots the last X bars of any asset; including the live candle currently painting
Useful for low time frame trading when you want to see correlated asset price movement right alongside the price movement you're watching.
Useful for quick and simple comparisons; when you don't want the clutter of split screen or multi-pane view.
Useful for backtesting.
Price scale agnostic; just plots the shape of the recent price action, with several optional labels: Asset+timeframe | Live Price | Highest price over X bars | Lowest price over X bars.
Works fine with all the assets i've tested it on.
~~User inputs~~
-number of bars to paint.
-horizontal offset: plot to right X bars or to left X bars
-vertical offset: shift up or down, shrink or expand; by using 2 'spacer' inputs
-color/transparancy of candles and price labels.
-width (pixels) of candle bodies.
-choose to display price labels or not
-choose to display asset label or not
~~Tips~~
--Add several of these indicators; changing the vertical 'Shift/Shrink' settings on each to visually separate them.
--In the above chart or EurUsd, there are three indicators =>> three mini-plots overlaid: DXY, EurGbp and GbpUsd. Using the following settings for Space Above:Space Below: DXY- 0.1:4.5 | EurGbp- 1.8:1.8 | GbpUsd- 4.5:0.1
--the more you add, the more you'll have to vertically shrink the plots
© twingall

SST Table NewData Table for Update GTT Orders in Stocks....
Updated GTT Order details for SST , also added Relative Strength of Stock compared with NIFTY Index for 55 Days (3 Months) period.
RS line plotted on chart… taken reference of close price of day candle… just a bigger picture of actual RS indicator plotted on chart itself... RS line in red color means below zero line (negative) and green color means above zero line (positive).
Added code for checking RS value on chart for any previous day.

FXminds currency strengthFXminds Currency strength indicator:
The goal of this indicator is to calculate all the currency overall value increases and decreases,
to exploit these by trading a currency that is gaining overall value against a currency that is losing overall value.
========================================================================================================================================================================================
* Fase 1: absolute currency value lines
This script makes theoretical currency absolute currency value line.
It does this by taking the average increase in value from each of the currency pairs the currency has a place in and averaging these increases.
After this, the script makes a factor of the average increase.
Then it multiplies a theoretical value line with this average increase factor, note that this theoretical line start at the value 100.
Example: EUR candle “1”
EUR/USD : +1%
EUR/GBP : +1%
EUR/CAD : +1%
EUR/NZD : +1%
EUR/JPY : +1%
EUR/AUD : +1%
average increase : 1%
average increase factor 1.01
EUR absolute currency value line cande “0” : 100
EUR absolute currency value line cande “1” : 101
Please note that all different exchange rates are weighted equally.
These absolute currency value lines are shown when you set the “indicator modus” setting to “show all absolute value lines”.
When you only want the relevant currency value lines to be shown, set the “indicator modus” setting to “show Base & Quote absolute value lines”.
========================================================================================================================================================================================
* Fase 2:
this script then places a moving average over the self-made absolute currency value lines,
this moving average has a length of n which can be changed by the “currency absolute value line moving average length” setting.
It then calculates the deviation between the currency absolute value line and its moving average in percentages.
this deviation is used to determine whether a currency is gaining or losing value.
These deviations are shown when you set the “indicator modus” setting to “show all absolute value lines deviation % against moving average”.
When you only want the relevant currency value line to be shown, set the “indicator modus” setting to “show Base & Quote absolute value lines deviation % against moving average”.
Then one deviation is starting to trump the other, this is a signal that one currency is gaining value over the other and there is a possible trade to be found.
Please note that if you use the “show Base & Quote absolute value lines deviation % against moving average” setting, the indicator also plots the difference between the two deviations in the form of a histogram.
when on deviation trumps the other and thus there is a signal for a possible trade, this is also shown by the histogram as an 0-line cross.
========================================================================================================================================================================================
* Fase 3:
this script then uses this information to create an entry signal indicator, which is visualized when set the “indicator modus” setting to “plot as entry indicator”.
When using this mode, the indicator also still shows the difference between two deviations histogram.
When looking at the histogram, you can see that the indicator is prone to giving weak signals when two currencies are barely outperforming each other.
To prevent the indicator from giving weak signals, use the “signal line to entry signal smoothing” setting.
With this setting, u can determine the minimum difference in deviation of currency performance needed to create a signal.
Please note that increasing this value makes it so that you get less weak signals, but has the downside that it tends to delay your signals for a bit.
It is also possible to just show the histogram of the difference between the currency performances.
when you want this, set the “indicator modus” setting to “show signal line as 0-cross”.

TAPLOT Relative Strength New High Multi LookbackThis indicator will compare your Stock or ETF to any other security of your choice. The indicator a stock's price action to that of the S&P 500. A rising line tells you the stock is outperforming the benchmark index. When looking for stocks to swing trade, I like to build my watchlist from stocks that are showing a rising/strong Relative Strength line.
What differentiates this indicator from others that are available out there is:
Ability to choose any benchmark index to compare to (from ticker pick field in settings)
Plotting Relative Strength New High (Relative Strength NH) and Relative Strength New High Before Price (RS NHBP) on the Relative Strength line by looking back at 3 different lookback periods (3 months, 6 months, and 12 months)
Plotting all history occurrences of RS NH and RS NHBP
By being able to plot NHs from all 3 lookback periods gives you an early heads up on stocks that started to outperform the market early on (3 months RS NHs). The indicator then switches to 6 months plotting Crosses for NHs and then to 12 month lookback when 12 month Relative Strength New Highs are present.
The Relative Strength line itself will be plot on all of your chart timeframes however the RS NH and RS NHBP are only plotted on Daily and Weekly charts.
The indictor is very customizable - you are able to adjust:
Benchmark to compare to
Lookback period (default to Multi/All)
Change the width of Relative Strength line and color
Change the size of Dashes, Crosses, and Circles plotted on RS line
Change the color of NH and NHBP plots
Force Relative Strength NH/NHBP shapes to Circles for all lookback periods
This is version 1.0 and initial release. Please report any bugs in the comments section below. Hope you find this useful.
Here is an example of $NFE showing early signs of strength from late Feb 2022 with 3 month Dashed signals then 6 month outperformance with Crosses and finally 12 months outperformance with Circles.

Z-Score DeltaHeavily modified from Z Score by jwammo12
Compares the z-score of two assets, the onscreen one and the reference one configured. If you're familiar, you can think of it as Bollinger Band Percent of Onscreen Asset minus the Bollinger Band Percent of Reference Asset.
It's compared off a simple moving average, due to how standard deviation is calculated.
I view this a more literal meaning of relative strength.
Has the ability to offset or delay in time one to another.
TODO: add MAD and MAD/STD.DEV views
Not my greatest work, but it's functional.

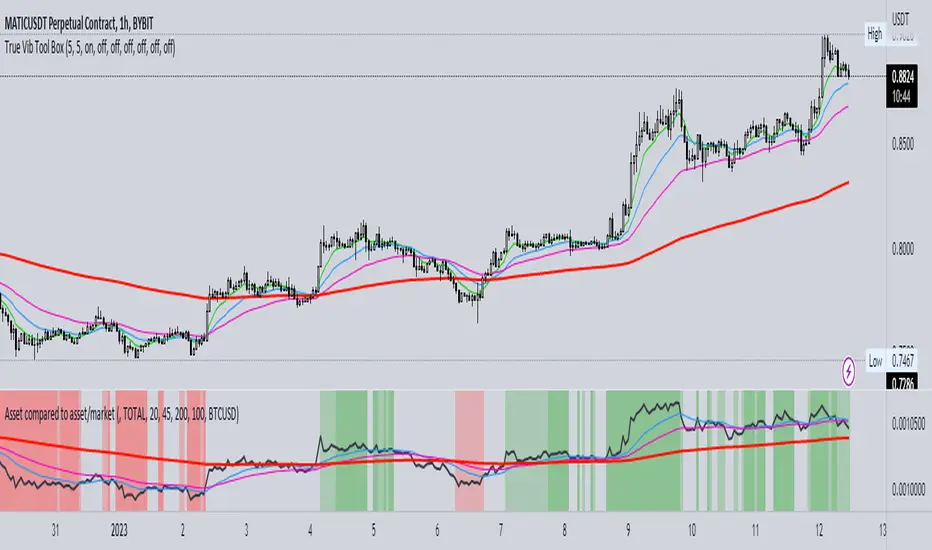
Asset compared to asset/marketThis indicator simply divides an asset to another asset and multiplies the result by 100.
There are the options for choosing a timeframe and symbols. I've also added EMAs.
There's also the option to put red/green background when the EMAs are above the index and are upsloping and vice versa.
Enjoy!
CCI + EMA with RSI Cross StrategyThis strategy uses the CCI + 2 RSIs + 2 EMAs to generate trade signals. Trades are only taken during the normal trading session and all open trades are closed 15 min before the close of the current session. A trailing stop loss is used and is customizable.
Not trading advice, use at your own risk.

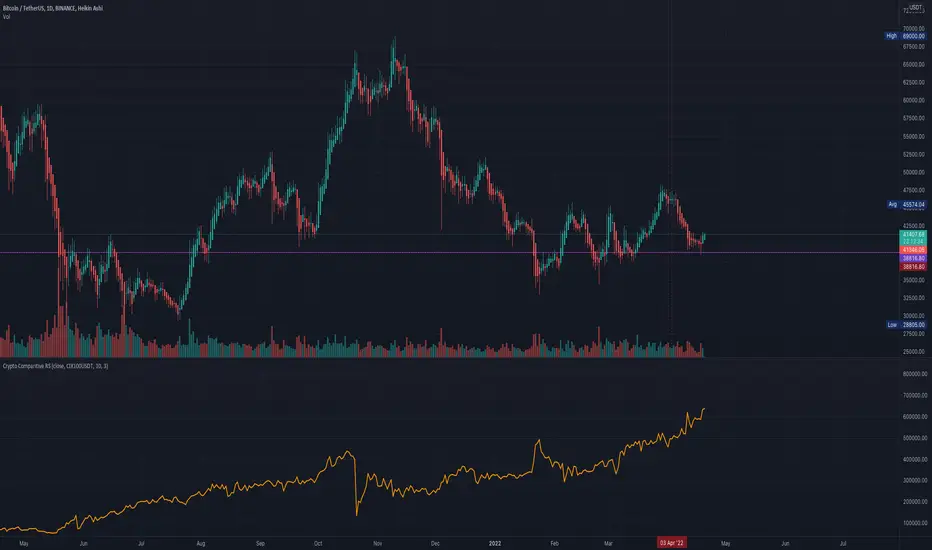
Comparative Relative Strength for Crypto (USDT/USD)Comparative Relative Strength for Crypto (USDT/USD)
An adaption of the indicator as published by © bharatTrader->
Please visit the link for details as published by the original coder.
Configured for Crypto by presetting (per filter) for CIX100 usage - either in USDT (Kucoin) or USD (Capitolcom)
MomentumThis indicator will give you the momentum readings (rate of change) for five lookback periods (15m, 60m, 4hr, 24hr, 48hr).
This is useful when backtesting or retroactively logging the readings into your trade journal (there is no way to roll back the Forex Factory momentum screener that I know of).
There are lines drawing in the background which are set to 100% transparency by default, so don't be puzzled when you occasionally see the bubbles for the line plots being highlighted on your chart.
Message me with any questions or suggestions.

ICT index correlated market indicatorThis is not a real indicator, but is what ICT use as indicator for trading futures indexes.
it can only display SP500, Dow Jon Industrial Average and Nasdaq, if someone want other market can copy the code and change some parameters (is more easy than it can appear)
A good idea is using this other market on backtest to confirm the divergence idea of Linda Raske, than use it to spot quickly in real market.
Another idea published by ICT is the "hidden entry pattern", the entry signal appear in ES or YM but I trade NQ for volatility, so I use the trigger of SP500 or Dow to enter in Nasdaq.
Rember always don't trust anybody, do your own backtest and research!
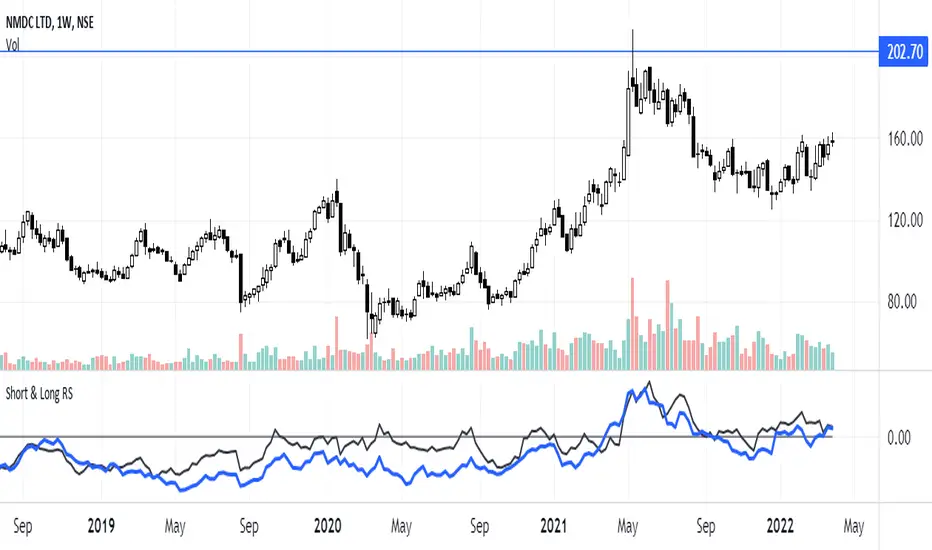
Short & Long Relative StrengthRelative Strength (RS) is a method of identifying stocks which are relatively stronger or weaker as compared the market as a whole or to a relevant benchmark.
To calculate the relative strength of a particular stock, divide the percentage change over some time period by the percentage change of a particular index over the same time period.
The value of RS Indicator oscillates around zero. If value of RS is above ZERO then security is outperforming the benchmark and if value of RS is below ZERO then security is outperforming the benchmark.
Here i have used two RS indicator lines in one indicator - Short Term RS (default value is 65) and Long Term RS (default value is 123).
I have set default benchmark index as Nifty 50 (NSE:NIFTY)
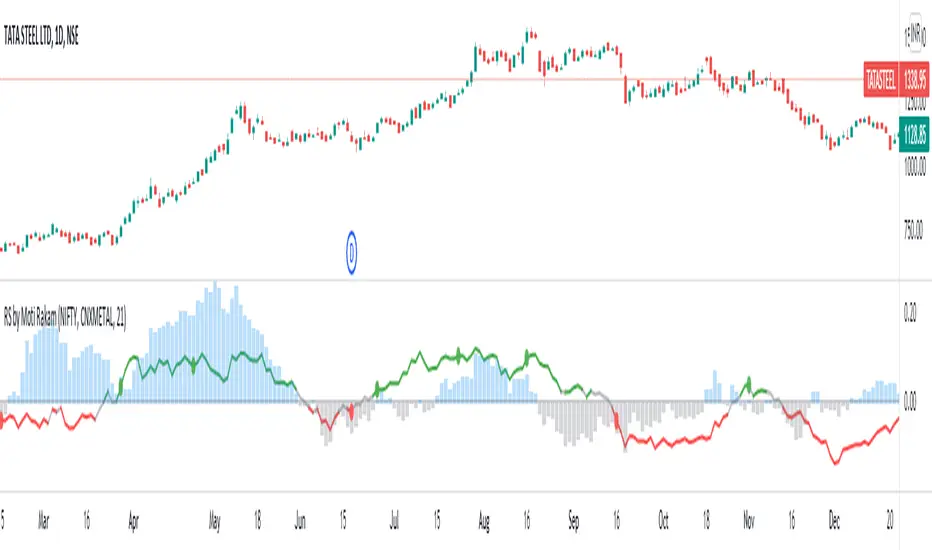
Relative Strength of Stocks - Moti RakamThe indicator plots "Relative Strength" (RS) of a stock, in 2 ways:
1. Relative Strength of the sector index, against the wider market index. For example, in Indian market relative strength of any sector index like CNXAUTO or CNXMETAL, against NIFTY. RS of sector index against wider market index is plotted in "Columns". Blue color of Columns above zero line signifies that "Sector Index is outperforming the Wider Market Index". Gray color Columns under zero line signifies that "Sector Index is underperforming the Wider Market Index".
2. Relative Strength of the stock against it's sector index. For example, in Indian market, RS of TATA STEEL against CNXMETAL. The Stock RS is plotted with a line. Green color of RS line above 0.02 signifies that "Stock is outperforming it's sector index". Red color of RS line below -0.02 signifies that "Stock is underperforming it's sector index". Gray color of RS line between 0.02 and -0.02 represents neutral zone.
IMPORTANT: Right method to ascertain RS of a stock would be to look for the zones where 2 RS (sector RS and stock RS) are in consensus/confluence. For example, RS line of TATA STEEL is in green color and at the same time the CNXMETAL is also in Blue columns against NIFTY.
LifeCycle PerformanceA simple script that can be used to determine if the scrip is outperforming or underperforming the benchmark (selectable by input) with respect to the phase/lifecycle it is in.
The script works on the basis of comparing the phase of the benchmark and the phase of the symbol that it is in. Phase of a stock is defined and explained in many books and can easily be checked out on the internet. The comparison is made on multiple timeframes, and a deduction is made algorithmically to arrive where the chosen symbol in its lifecycle is vis-a-vis the benchmark selected.
The output is color coded bars of varying intensity.
The details are as follows:
Green Shades: Outperformance. Lighter the color stronger the outperformance
Red Shades: Underperformance. Darker the color stronger the outperformance
White: No clear signal
This script can work on any timeframe. For longer duration, use Weekly charts (preferred) for shorter use 60 minute charts (or whatever is normalised value as per session open times. For eg. for Indian markets open from 9:15 AM to 3:30 PM, use 75 minute instead of 60 minute charts).

R-Smart - Relative Strength On observing the market for years I learned that Relative Strength will help us in staying invested in strong bullish stocks (relative to primary indices of your country, in my case it's Nifty 50 for India). Once you identify a strong stock, it's important to know if the stock is trending and is in momentum. To identify, trends and momentum, I used ADX and MACD indicators respectively as part of the R-Smart.
In R-Smart, I used Relative Strength primarily to plot the chart, if the Histogram is positive (greater than 0) then the security is bullish. But then how do we know that it's in trend and having momentum. Well the below color code will help you identify them
1. Histogram in Green : Strong Bullish
2. Histogram in Blue : Weak Bullish
3. Histogram in Orange: Bearish
Apart from the above indicator, I would like to use Super Trend to know the immediate support/resistances on the chart.
# StayInvested
# StayProfitable
# ManageYourRisk

Comparative Relative Strength(CRS), ARS,SRS,Beta,RocShows comparative relative strength(CRS) against any benchmark script , if CRS is above ARS line than ARS is Positive and if CRS turns green than SRS is positive and vice versa.

Aryangel_MACD+RSICombination of MACD and RSI, strong signal for buy/sell with MACD and RSI crossover.
Multiple Relative Strength (Multiple RS) (XP)Multiple Relative Strength (Multiple RS) (XP)
You can see three Relative Strength lines.
The lines are thicker going from RS1 to RS2 to RS3, for differentiation.
Using the three RS, you can see long, medium, and short term performance at once.

Relative StrengthRelative strength is a calculation of the price trend of a stock or a financial instrument in comparison to another instrument, stock, or industry. It shall be determined by taking the price of one commodity and dividing it by another.
Relative strength is a strategy used for determining value stocks and is used in momentum investing as well. It involves investing in stocks that have done well, in relation to their index or benchmark. For example, a relative strength investor might pick technology companies that have outperformed the Nasdaq Composite Index or large-cap stocks that are lagging against the S&P 500 index(Adjustable in the settings).
This indiator will give you a plot for relative strength between the current pair with another pair (adjustable in the settings), with a plotshape for RSNHBP & RSNH
Features :
1. Relative Strength
2. Double EMA of Relative Strength
3. RSNHBP & RSNH
How to use it :
1. Adjust All the settings parameter
2. For Alerting, Just use any alert function call, it will give you an alert of RSNHBP and RSNH

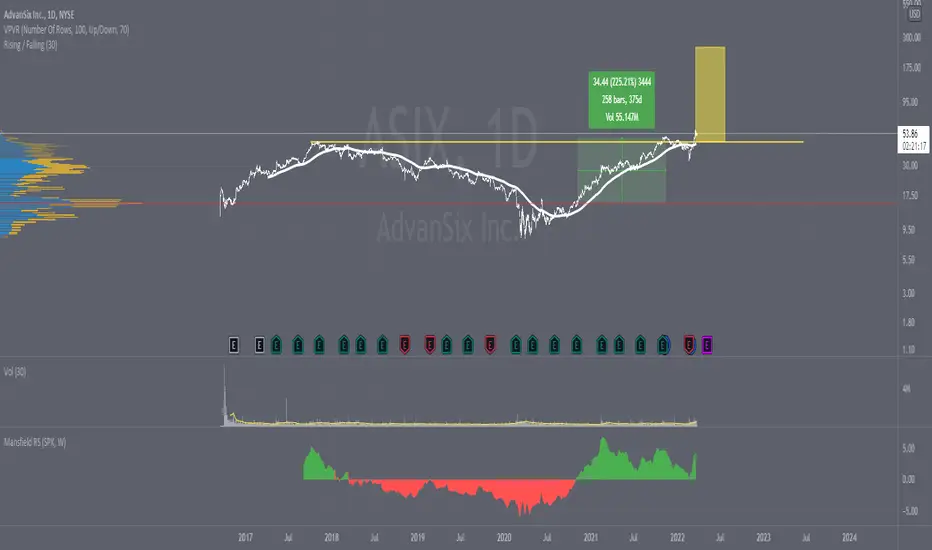
Mansfield RSHello,
I hope you like this representation of the Mansfield Relative Strength Indicator.
The calculations have been made based on the following formulas:
Standard Relative Performance indicator
RP = ( stock_close / index_close ) * 100
Mansfield Relative Performance indicator
MRP = (( RP (today) / sma ( RP (today), n)) - 1 ) * 100
Where:
RP = Standard Relative Performance indicator (see above)
SMA = Simple moving average over n days.
n = 52 for weekly charts, and n = 200 on daily charts
Thanks,