Range Strat - MACD/RSIThis strategy uses a trend based indicator (MACD) for entry/exit signals with a momentum oscillator (RSI) to act as confirmation. Although relying on a trend based indicator this has been created for range bound crypto markets, which have been in a period of chop since June 2022.
Long/Short signals are generated from MACD with the RSI oscillator thresholds suppressing entries at price extremes. This is not a mean reversion RSI strategy! As the indicators are contrary to each other you will need to be generous with the RSI settings in order for signals to trigger.
Strategy is designed for use on the 4h timeframe, it may work well on higher timeframes, but lower time frames will lead to false signals. Use fixed percentage of equity for order size to capture the compounding effect. As a reversal strategy bear in mind that should market trend strongly in either direction stops will be required.
The RSI thresholds can be tailored to provide higher frequency or safer signals. Similarly tweaking MACD settings will provide earlier/more frequent or safer signals. As this is intended to enter near range high / low you should check the visual cues to ensure a ping-pong effect is observed, so that peaks and troughs are captured. Once an observable range is established the strategy works well across a range of crypto markets,
The script is open source, so feel free to amend as you wish. Using a different momentum oscillator may provide better results. I have prior coding experience, but first time using PineScript was last night, so it's not very tidy. I will update this with some additional customisation and TP/SL in the near future.
Usage: Range bound markets
Markets: Cryptocurrency Alts/BTC/ETH
Timeframe: 4h
相對強弱指標(RSI)

Take Profit On Trend v2 (by BHD_Trade_Bot)The purpose of strategy is to detect long-term uptrend and short-term downtrend so that you can easy to take profit.
The strategy also using BHD unit to detect how big you win and lose, so that you can use this strategy for all coins without worry about it have different percentage of price change.
ENTRY
The buy order is placed on assets that have long-term uptrend and short-term downtrend:
- Long-term uptrend condition: ema200 is going up
- Short-term downtrend condition: 2 last candles are down price (use candlestick for less delay)
CLOSE
The sell order is placed when take profit or stop loss:
- Take profit: price increase 2 BHD unit
- Stop loss: price decrease 3 BHD unit
The strategy use $1000 for initial capital and trading fee is 0.1% for each order.
Pro tip: The 1-hour time frame for ETH/USDT has the best results on average.

Triple RSI strategyThis strategy is commonly used both in forex and stock markets for reversal trading. when the rsi line reaches and crosses simultaneously at 3 rsi setups i.e at 7, 14, and 21, a signal is generated.
This strategy works best in 1-hour timeframe. It provides over 60 to 80 percent accuracy in 1-hour timeframe.
In the stock market, this strategy provides an excellent entry point, if one is seeking small profits.
One can expect to make around 10 to 50 pips in the forex market easily. However, I advise seeking support from price action from the lower timeframe in the forex market.
I hope you like it.
Follow for more strategies and scripts like this.

Short Term RSI and SMA Percentage ChangeThis strategy utilises common indicators like RSI and moving averages in order to enter and exit trades. The Relative Strength Index (RSI) is a momentum indicator that has a value between 0 and 100, where a value greater than 70 is considered overbought and a value less than 30 is oversold. If the RSI value is above or below these values, then it can signal a possible trend reversal.
The second indicator used in this strategy is the Simple Moving Average (SMA). A SMA is an arithmetic moving average calculated by adding recent prices and then dividing that figure by the number of time periods in the calculation average. For example, one could add the closing price of a coin for a number of time periods and then divide this total by that same number of periods. Short-term averages respond quickly to changes in the price of the underlying coin, while long-term averages are slower to react.
Long/Exit orders are placed when three basic signals are triggered.
Long Position:
RSI is greater than 50
MA9 is greater than MA100
MA9 increases by 6%
Exit Position:
Price increases 5% trailing
Price decreases 5% trailing
The script is backtested from 1 May 2022 and provides good returns.
A trading fee of 0.1% is also taken into account and is aligned to the base fee applied on Binance.
This script also works well on AVAX 45m/1h, MATIC 15m/45m/1h and ETH 4h.

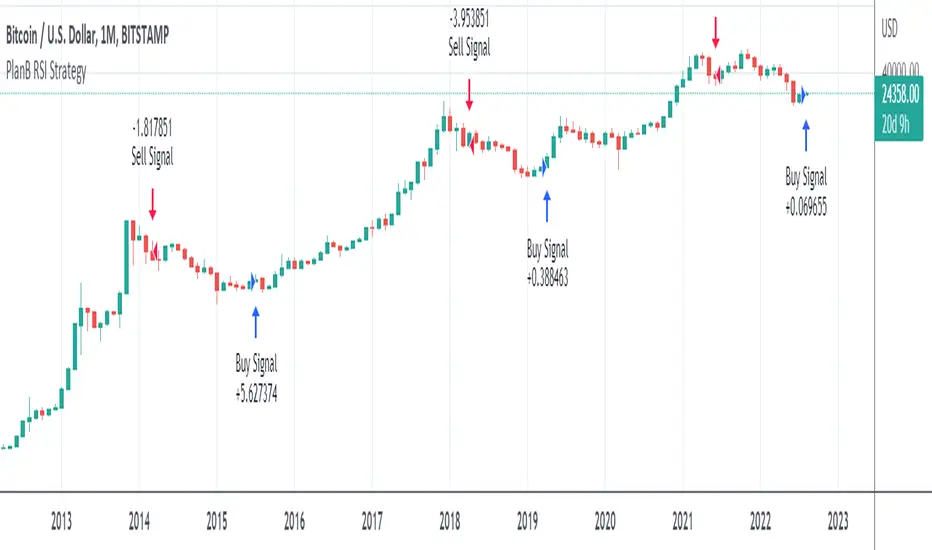
PlanB Quant Investing 101 v2This script has been Inspired by PlanB Article Quant Investing 101.
With this script, I implemented Plan B strategy outlined in that article, trying to reproduce his findings independently and allowing TradeView Users to do the same.
PlabB is aware of this effort, and he's positive about it, via Twitter commenting, liking and sharing of this resource .
Trading Idea:
This script uses RSI index to determine the Buy And Sell signal.
As per the original PlanB article:
IF ( RSI was above 90% last six months AND drops below 65%) THEN sell,
IF ( RSI was below 50% last six months AND jumps +2% from the low) THEN buy, ELSE hold
My simple code is aimed at replicating his study in Pine so that every TV user can check his signal.
Ichimoku Cloud with RSI (By Coinrule)The Ichimoku Cloud is a collection of technical indicators that show support and resistance levels, as well as momentum and trend direction. It does this by taking multiple averages and plotting them on a chart. It also uses these figures to compute a “cloud” that attempts to forecast where the price may find support or resistance in the future.
The Ichimoku Cloud was developed by Goichi Hosoda, a Japanese journalist, and published in the late 1960s. It provides more data points than the standard candlestick chart. While it seems complicated at first glance, those familiar with how to read the charts often find it easy to understand with well-defined trading signals.
The Ichimoku Cloud is composed of five lines or calculations, two of which comprise a cloud where the difference between the two lines is shaded in.
The lines include a nine-period average, a 26-period average, an average of those two averages, a 52-period average, and a lagging closing price line.
The cloud is a key part of the indicator. When the price is below the cloud, the trend is down. When the price is above the cloud, the trend is up.
The above trend signals are strengthened if the cloud is moving in the same direction as the price. For example, during an uptrend, the top of the cloud is moving up, or during a downtrend, the bottom of the cloud is moving down.
This strategy combines the Ichimoku Cloud with the RSI indicator to better enter trades.
Long/Short orders are placed when three basic signals are triggered.
Long Position:
Tenkan-Sen is above the Kijun-Sen
Chikou-Span is above the close of 26 bars ago
Close is above the Kumo Cloud
RSI is greater less than 50
Short Position:
Tenkan-Sen is below the Kijun-Sen
Chikou-Span is below the close of 26 bars ago
Close is below the Kumo Cloud
RSI is greater than 50
The script is backtested from 1 June 2022 and provides good returns.
The strategy assumes each order is using 30% of the available coins to make the results more realistic and to simulate you only ran this strategy on 30% of your holdings. A trading fee of 0.1% is also taken into account and is aligned to the base fee applied on Binance.
This script also works well on SOL (45m timeframe), BNB (1h timeframe), and ETH (1h timeframe).

RSI Improved strategySet a Horizontal Ray at the price that relates highest / lowest RSI .
It 's more clear to decide when to open long / short position manually.
It's a scalping strategy that works in 15min chart(basically works in most of timeframe , if you don't look it as a scalping strategy), when RSI hits Highest / Lowest value , the strategy will open a Long / Short position.
The Default Risk Reward Ratio was 1 (1600 points : 1600 points) you can adjust it in settings
You guys can look it as a RSI alert indicator
Think before you do , use it wisely. Thanks a lot!
There is a lot of useless words in Pine if you wanna look it please ignore it.

Bollinger Bands and RSI Short Selling (by Coinrule)The Bollinger Bands are among the most famous and widely used indicators. A Bollinger Band is a technical analysis tool defined by a set of trendlines plotted two standard deviations (positively and negatively) away from a simple moving average ( SMA ) of a security's price, but which can be adjusted to user preferences. They can suggest when an asset is oversold or overbought in the short term, thus provide the best time for buying and selling it.
The relative strength index ( RSI ) is a momentum indicator used in technical analysis . RSI measures the speed and magnitude of a security's recent price changes to evaluate overvalued or undervalued conditions in the price of that security. The RSI can do more than point to overbought and oversold securities. It can also indicate securities that may be primed for a trend reversal or corrective pullback in price. It can signal when to buy and sell. Traditionally, an RSI reading of 70 or above indicates an overbought situation. A reading of 30 or below indicates an oversold condition.
The short order is placed on assets that present strong momentum when it's more likely that it is about to decrease further. The rule strategy places and closes the order when the following conditions are met:
ENTRY
The closing price is greater than the upper standard deviation of the Bollinger Bands
The RSI is less than 70
EXIT
The trade is closed in profit when the RSI is less than 70
Upper standard deviation of the Bollinger Band is greater than the the closing price.
This strategy comes with a stop loss and a take profit, and as you can see by the results, it is well suited for a bear market.
This trade works very well with ETH (1h timeframe), AVA (4h timeframe), and SOL (3h timeframe) and is backtested from the 1 December 2021 to capture how this strategy would perform in a bear market.
To make the results more realistic, the strategy assumes each order to trade 30% of the available capital. A trading fee of 0.1% is taken into account. The fee is aligned to the base fee applied on Binance, which is the largest cryptocurrency exchange.

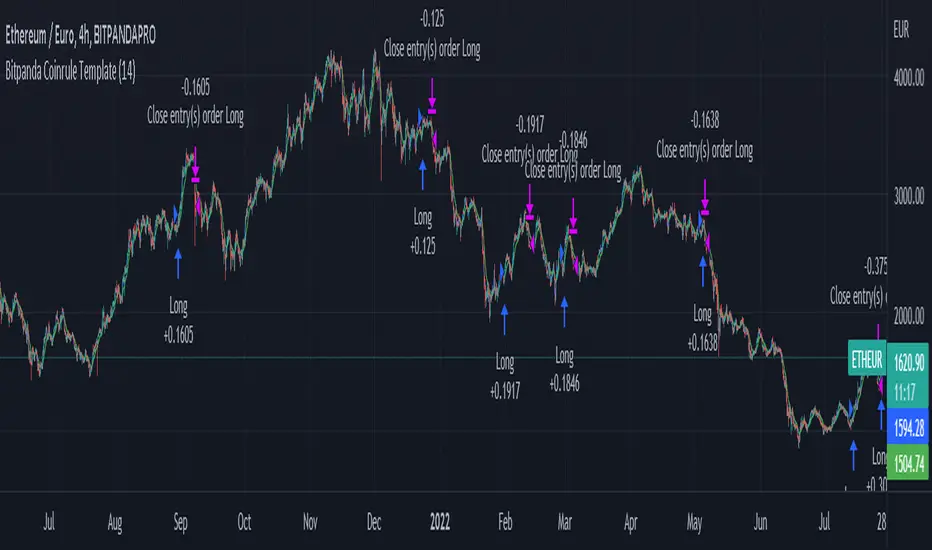
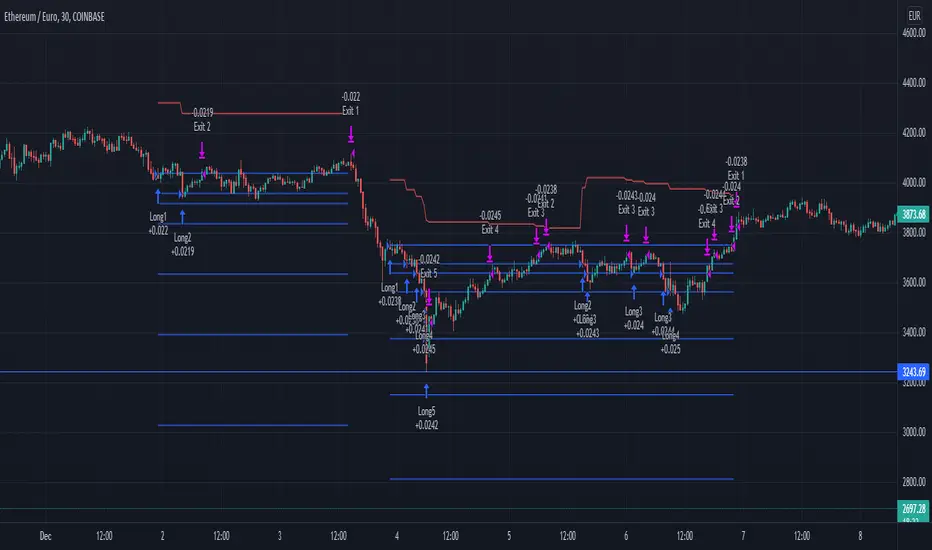
Bitpanda Coinrule TemplateThis strategy for Bitpanda on the Coinrule platform utilises 3 different conditions that have to be met to buy and 1 condition to sell. This strategy works best on the ETH/EUR pair on the 4 hour timescale.
In order for the strategy to enter the trade it must meet all of the conditions listed below.
ENTRY
RSI increases by 5
RSI is lower than 70
MA9 crosses above MA50
EXIT
MA50 crosses above MA9
This strategy works well on LINK/EUR on the 1 day timeframe, MIOTA/EUR on the 2 hour timeframe, BTC/EUR on the 4 hour timeframe and BEST/EUR on the 1 day timeframe (and 4h).
Back tested from 1 January 2020.
The strategy assumes each order is using 30% of the available coins to make the results more realistic and to simulate you only ran this strategy on 30% of your holdings. A trading fee of 0.1% is also taken into account and is aligned to the base fee applied on Binance.
Fib and RSI Strategy PineconnectorUse on 1m only For best results
strategy check for RSI overbought or oversold when key Fib levels are hit
Optimisez to use with Pineconnector using alerts with {{strategy.order.alert_message}}
Feel free to comment or DM if you want to improve
Enjoy

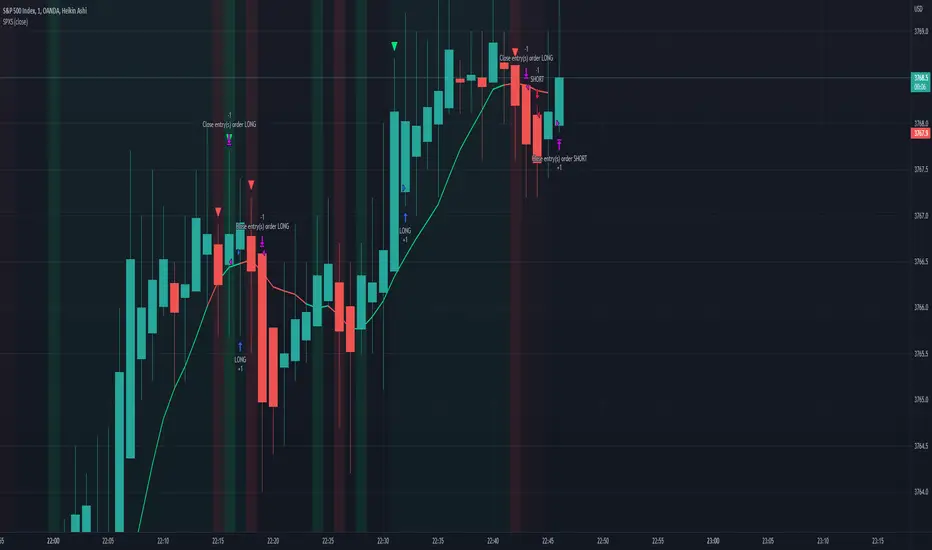
SPX Scalping StrategyThis strategy points out good entries and exits to go with the direction of SPY
Used with:
Ticker: SPX 500 USD
Heiken Ashi Candles
1, 3, 5 min timeframe
Cheat Code- Example 1; Short-Term; Follow the Trend BINANCE:BTCUSDT ; BINANCE:ETHUSDT ; BINANCE:FILUSDT ;
This strategy is simple and easy to read and takes advantage of conditional signs of trend reversals. It works best in 10-minute time frames for most large and mid-cap crypto. This code is a tutorial for creating a profitable yet easy strategy, and hopefully, it can be put to good use :)
5 Minute Scalping StrategyTaking entrys based on the 1 minute timeframe MACD
only taking longs when all emas are in the correct order and there is a bigger than usual MACD downtick and the RSI is above 51
only taking shorts when all emas are in the opposite order and there is a bigger than usual uptick on the MACD and the RSI is bellow 49
bigger than usual ticks are defined by bollinger bands around the Macd and the ticks have to be higher than 35 and lower than -10
you can change whatever setting you like to make the strategy more profitible. pls share when you find a more profitible setting than me
the stoploss doesnt work correct if it would be hit in the same candle you enter the trade. pls share when you have a solution for this
the stratagy is profitible when i backtested it for the last month, but i dont know how it will play out in the future, so you enter the signals at your own risk

Customizable Non-Repainting HTF MACD MFI Scalper Bot Strategy v2Customizable Non-Repainting HTF MACD MFI Scalper Bot Strategy v2
This script was originally shared by Wunderbit as a free open source script for the community to work with. This is my second published iteration of this idea.
WHAT THIS SCRIPT DOES:
It is intended for use on an algorithmic bot trading platform but can be used for scalping and manual trading.
This strategy is based on the trend-following momentum indicator . It includes the Money Flow index as an additional point for entry.
This is a new and improved version geared for lower timeframes (15-5 minutes), but can be run on larger ones as well. I am testing it live as my high frequency trader.
HOW IT DOES IT:
It uses a combination of MACD and MFI indicators to create entry signals. Parameters for each indicator have been surfaced for user configurability.
Take profits are now trailing profits, and the stop loss is now fixed. Why? I found that the trailing stop loss with ATR in the previous version yields very good results for back tests but becomes very difficult to deploy live due to transaction fees. As you can see the average trade is a higher profit percentage than the previous version.
HOW IS MY VERSION ORIGINAL:
Now instead of using ATR stop loss, we have a fixed stop loss - counter intuitively to what some may believe this performs better in live trading scenarios since it gives the strategy room to move. I noticed that the ATR trailing stop was stopping out too fast and was eating away balance due to transaction fees.
The take profit on the other hand is now a trailing profit with a customizable deviation. This ensures that you can have a minimum profit you want to take in order to exit.
I have depracated the old ATR trailing stop as it became too confusing to have those as different options. I kept the old version for others that want to experiment with it. The source code still requires some cleanup, but its fully functional.
I added in a way to show RSI values and ATR values with a checkbox so that you can use the new an improved ATR Filter (and grab the right RSI values for the RSI filter). This will help to filter out times of very low volatility where we are unlikely to find a profitable trade. Use the "Show Data" checkbox to see what the values are on the indicator pane, then use those values to gauge what you want to filter out.
Both versions
Delayed Signals : The script has been refactored to use a time frame drop down. The higher time frame can be run on a faster chart (recommended on one minute chart for fastest signal confirmation and relay to algotrading platform.)
Repainting Issues : All indicators have been recoded to use the security function that checks to see if the current calculation is in realtime, if it is, then it uses the previous bar for calculation. If you are still experiencing repainting issues based on intended (or non intended use), please provide a report with screenshot and explanation so I can try to address.
Filtering : I have added to additional filters an ABOVE EMA Filter and a BELOW RSI Filter (both can be turned on and off)
Customizable Long and Close Messages : This allows someone to use the script for algorithmic trading without having to alter code. It also means you can use one indicator for all of your different alterts required for your bots.
HOW TO USE IT:
It is intended to be used in the 5-30 minute time frames, but you might be able to get a good configuration for higher time frames. I welcome feedback from other users on what they have found.
Find a pair with high volatility (example KUCOIN:ETH3LUSDT ) - I have found it works particularly well with 3L and 3S tokens for crypto. although it the limitation is that confrigurations I have found to work typically have low R/R ratio, but very high win rate and profit factor.
Ideally set one minute chart for bots, but you can use other charts for manual trading. The signal will be delayed by one bar but I have found configurations that still test well.
Select a time frame in configuration for your indicator calculations.
Select the strategy config for time frame (resolution). I like to use 5 and 15 minutes for scalping scenarios, but I am interested in hearing back from other community memebers.
Optimize your indicator without filters : customize your settings for MACD and MFI that are profitable with your chart and selected time frame calculation. Try different Take Profits (try about 2-5%) and stop loss (try about 5-8%). See if your back test is profitable and continue to optimize.
Use the Trend, RSI, ATR Filter to further refine your signals for entry. You will get less entries but you can increase your win ratio.
You can use the open and close messages for a platform integration, but I choose to set mine up on the destination platform and let the platform close it. With certain platforms you cannot be sure what your entry point actually was compared to Trading View due to slippage and timing, so I let the platform decide when it is actually profitable.
Limitations: this works rather well for short term, and does some good forward testing but back testing large data sets is a problem when switching from very small time frame to large time frame. For instance, finding a configuration that works on a one minute chart but then changing to a 1 hour chart means you lose some of your intra bar calclulations. There are some new features in pine script which might be able to address, this, but I have not had a chance to work on that issue.

Soren test 222Say we use strategy.risk.allow_entry_in() to only trade longs. When our script uses the strategy.entry() function to open a short trade, TradingView of course won’t allow our strategy to go short. But that doesn’t mean the trade is ignored. Instead the ‘enter short’ trade – which is actually a sell command – becomes an ‘exit long’ order.
Another way to think about this is the following. The strategy.entry() function can reverse positions: longs into shorts, and shorts into longs. That reverse behaviour gets stopped by strategy.risk.allow_entry_in(). What strategy.entry() instead ends doing is close positions: from long to flat, or from short to flat.
(The example strategies that we discuss later in this article show how strategy.risk.allow_entry_in() makes strategy.entry() close instead of open trades.)
# Can still trade both long or short
strategy.risk.allow_entry_in() can also allow our strategy to trade both long or short. That’s a bit silly, since this is already the default behaviour. But to cod

Oversold RSI with tight SL Strategy (by Coinrule)This is one of the best strategies that can be used to get familiar with technical indicators and start to include them in your trading bot rules.
ENTRY
1. This trading system uses the RSI ( Relative Strength Index ) to anticipate good points to enter positions. RSI is a technical indicator frequently used in trading. It works by measuring the speed and change of price movements to determine whether a coin is oversold (indicating a good entry point) or overbought (indicating a point of exit/entry for a short position). The RSI oscillates between 0 and 100 and is traditionally considered overbought when over 70 and oversold when below 30.
2. To pick the right moment to buy, the strategy enters a trade when the RSI falls below 30 indicating the coin is oversold and primed for a trend reversal.
EXIT
The strategy then exits the position when the price appreciates 7% from the point of entry. The position also maintains a tight stop-loss and closes the position if the price depreciates 1% from the entry price. The idea behind this is to cut your losing trades fast and let your winners ride.
The best time frame for this strategy based on our backtesting data is the daily. Shorter time frames can also work well on certain coins, however in our experience, the daily works best. Feel free to experiment with this script and test it on a variety of your coins! With our backtesting data a trading fee of 0.1% is taken into account. The fee is aligned to the base fee applied on Binance, which is the largest cryptocurrency exchange by volume. In the example shown, this strategy made a handsome net profit of 39.31% on Chainlink with 61.54% of trades being profitable.

Optimised RSI strategy for Reversals (by Coinrule)The most common way to use the RSI to spot a good buy opportunity is to check for values lower than 30. Unfortunately, the RSI can remain in oversold territory for long periods, and that could leave you trapped in a trade in loss. It would be appropriate to wait for a confirmation of the trend reversal.
In the example above I use a short-term Moving Average (in this case, the MA9) coupled with an RSI lower than 40. This combination of events is relatively rare as reversal confirmations usually come when RSI values are already higher. As unusual as this setup is, it provides buy-opportunities with much higher chances of success.
The parameters of this strategy would be:
ENTRY: RSI lower than 40 and MA9 lower than the price
TAKE PROFIT and STOP-LOSS with a ratio of at least 2. That means that if you set up a take profit of 3%, your stop-loss shouldn’t be larger than 1.5%.
The advantage of this approach is that it has a high rate of success and allows you the flexibility of setting up the percentages of the take profit and stop-loss according to your preferences and risk appetite.

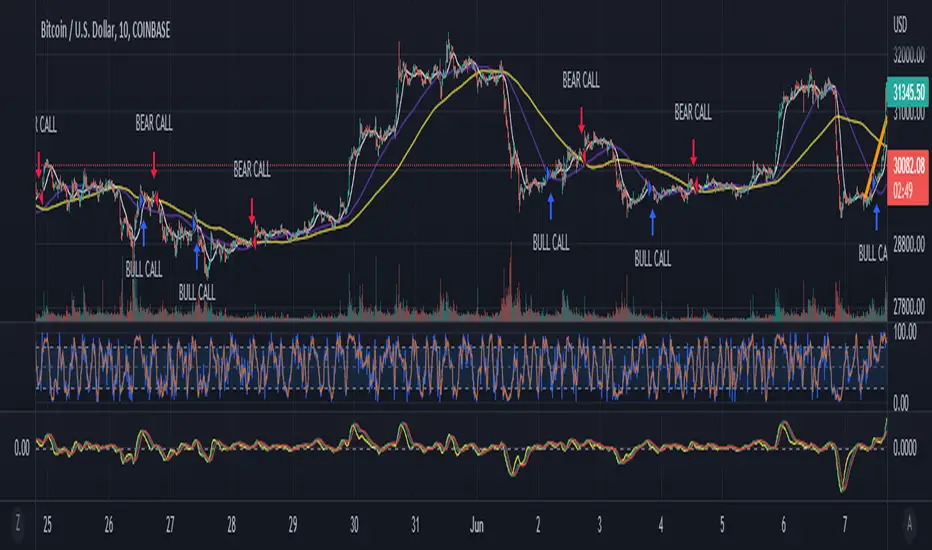
QQE MOD + SSL Hybrid + Waddah Attar ExplosionTRADE CONDITIONS
Long entry:
QQE Mod changes to Blue (leading indicator)
SSL Hybrid is Blue and price is above MA Channel line
Waddah Attar Explosion is Green and above Explosion line
Short entry:
QQE Mod changes to Red (leading indicator)
SSL Hybrid is Red and price is below MA Channel line
Waddah Attar Explosion is Red and above Explosion line
Risk management:
Each trade risks 2% of account (configurable in settings)
SL size determined by swing low/high of previous X candles (configurable in settings)
TP is triggered on SSL Hybrid EXIT arrow signals
TIPS
Timeframe: Personally I've found best results running this on 1H timeframe.
Note: To help visual identification of trade entries and exits you may wish to add the SSL Hybrid and Waddah Attar Explosion to the chart separately. They are being used to determine trade entry/exit within the code of this strategy but it was not possible to display them in a clear way within a single panel. Make sure you set the settings of the auxiliary indicators to match what is in the settings of this indicator if you do decide to add them.
CREDITS
QQE MOD byMihkel00
SSL Hybrid by Mihkel00
Waddah Attar Explosion by shayankm

BB + RSI double strategy developeI'm Korean, and it may not be enough to explain this script in English. I feel sorry for the users of TradingView for this lack of English skills. If you are Korean, please return it to the translator using Papago. It will be a useful manual for you.
This script referenced Chartart's Double Strategy. But there are some changes in his script.
0. Basically, when you break through the top or bottom of the 100th period balliser band and come back into the band, you track the overbuying and overselling of the RSI to determine your position entry. The order is triggered only when both conditions are satisfied at the same time. However, only one condition applies to clearing the position. This is because it is most effective in reducing risk and increasing assets in terms of profit and loss.
1. This script is optimized for 15 minutes of bitcoin futures chart and API via webbook alert. By default, 10x leverage usage and 10 pyramids are applied.
2. Setting a chart period other than 15 minutes will not guarantee sufficient effectiveness. It can also be applied to Ethereum , but it is not recommended to apply to other symbols.
3. I added Enable Date Filter because Chartart's script could not apply the strategy to the user's desired period. This feature allows you to set a period of time when you do not want to use the strategy. You can also uncheck it if you don't want to fully use this feature. Please remember that it is an exclusion period, not a usage period. With this feature, we can see the effectiveness of the strategy from a point in time, not from the entire period. You can also clearly differentiate the effectiveness of the strategy from the point you use it.
4. You can also stop using strategies at certain times of the day when you don't want to apply them. This works similarly to the Enalbe Date Filter described above. This allows you to sleep comfortably even if you don't fully trust this strategy.
5. The period, overbuying, and overselling figures of RSI can be set individually. For example, when you take a long position, you can set the RSI to a period of 7, and at the same time, the RSI entering the short position can be set to a period of 14. You can also set the base figures for overbuying and overselling to levels that you think are reasonable. This figure works in conjunction with the Bollinger Band and affects position entry when it is crossed or returned.
6. Based on API futures trading, basic Sleepy and commission are applied. This is geared towards market price transactions. This makes your revenue look more reasonable.
Thank you very much, Chartart. You are a genius.
-
저는 한국인이고, 영어로 이 스크립트를 설명하는 것이 어렵기 때문에 설명이 부족할 수 있습니다. 이런 영어 능력 부족에 대해서 TradingView 사용자들에게 미안하게 생각합니다. 만약 당신이 한국인이라면 파파고를 사용하여 번역기에 돌려주십시오. 당신에게 유익한 설명서가 될 것입니다.
이 스크립트는 Chart art의 Double Strategy를 참조했습니다. 그러나 그의 스크립트에서 달라진 점이 몇 가지 있습니다.
0. 기본적으로 100기간의 볼린져밴드의 상단 또는 하단을 돌파한 뒤 다시 밴드 안으로 들어올 때 RSI의 과매수, 과매도를 추적하여 포지션 진입을 결정합니다. 두 가지 조건이 동시에 만족되어야만 주문이 트리거 됩니다. 그러나 포지션을 청산하는 것에는 볼린져밴드 하나의 조건만 적용합니다. 여러가지 테스트를 거친 결과 이것이 손익 면에서 가장 효과적으로 리스크를 줄이고 자산을 늘리는 것에 효율적이기 때문입니다.
1. 이 스크립트는 15분의 비트코인 선물 차트와 webhook alert을 통한 API에 최적화되어 있습니다. 기본적으로 10배의 레버리지 사용과 10개의 피라미딩이 적용되어 있습니다.
2. 15분 외에 다른 차트 기간을 설정한다면 충분한 효과를 보장할 수 없습니다. 또한 이더리움에도 적용할 수 있지만, 그 외에 다른 심볼에는 적용하지 않는 것을 권장합니다.
3. Chart art의 스크립트는 전략을 사용자가 원하는 기간에 적용할 수 없었기 때문에, 저는 Enable Date Filter를 추가하였습니다. 이 기능을 통해 전략 사용을 원하지 않는 기간을 설정할 수 있습니다. 또한 이 기능을 완전히 사용하고싶지 않다면 체크를 해제할 수 있습니다. 사용 기간이 아닌 제외 기간인 점을 상기하시길 바랍니다. 이 기능을 통해 우리는 전체 기간이 아닌 가까운 특정 시점부터의 전략 적용 효과를 확인할 수 있습니다. 또한 사용자가 전략을 사용한 시점부터의 효과를 명백히 구분할 수 있습니다.
4. 또한 사용자가 적용을 원하지 않는 하루 중의 특정 시간대에 전략 사용을 멈출 수도 있습니다. 이는 위에 설명한 Enalbe Date Filter와 유사하게 작동합니다. 이를 통해 당신이 온전히 이 전략을 신뢰하지 못하여도 당신은 마음 편하게 잠에 들 수 있습니다.
5. RSI의 기간 및 과매수, 과매도 수치를 개별적으로 설정할 수 있습니다. 예를 들어 당신이 롱 포지션을 취할 때에는 RSI를 7의 기간으로 설정할 수 있고, 동시에 숏 포지션을 진입하는 RSI는 14의 기간으로 설정될 수 있습니다. 또한 과매수 및 과매도의 기준 수치를 당신이 합리적이라고 생각하는 수준으로 설정할 수 있습니다. 이 수치는 볼린져밴드와 함께 작동하여 그것을 넘어서거나 다시 되돌아올 때 포지션 진입에 영향을 미칩니다.
6. API 선물거래를 기준으로 하여 기본적인 슬리피지와 커미션이 적용되어있습니다. 이는 시장가 거래에 맞춰져 있습니다. 이는 당신의 수익을 좀 더 합리적인 수치로 보일 수 있게 합니다.
Chartart에게 특별히 감사합니다. 당신은 천재입니다.

RSI+PA+PrTPHi everybody,
This strategy is a RSI, Price Averaging, Pyramiding Strategy based on the earlier RSI+PA+DCA strategy. See below.
For this slightly different strategy I left the DCA option out and instead focused on the Take Profit calculation. In the previous strategy the Take Profit was directly connected to the Average Price level with a specified take profit %. When the price reached the Take Profit all positions where exited. The strategy opened multiple position based on the PA price levels. The separate positions can close when they reach separately specified Take Profit Limit. Each time the prices crosses the PA layer again the position can be re-opened. This causes the average price to drop each time a separate position is opened and closed.
I thought it was an interesting way to minimize losses and in general it works fine. Only when the market goes bearish it can cause significant losses
For the lack of a better word, I dubbed it Progressive Take Profit. The PrTP works different and is less risky. It doesn't directly follow the average price development and is calculated for a part based on the estimated profits of the separate closed positions. Every time a separate position is closed, the profit of that position is deducted of the Take Profit Limit. This causes the Take Profit Limit to drop les drastically then the average price and the whole position will only be closed when the separately opened and closed positions made up for the biggest losses.
There are still some aspects in the puzzle that are not fully worked out yet and I am still working on it, but I wanted to share this idea already and maybe you have some thoughts about it.
The next step is to re-implement a better worked out DCA function.
To be continued.
Estrategia Larry Connors [JoseMetal]============
ENGLISH
============
- Description:
This strategy is based on the original Larry Connors strategy, using 2 SMAs and RSI.
The strategy has been optimized for better total profit and works better on 4H (tested on BTCUSDT).
LONG:
Price must be ABOVE the slow SMA.
When a candle closes in RSI oversold area, the next candle closes out of the oversold area and the closing price is BELOW the fast SMA = open LONG.
LONG is closed when a candle closes ABOVE the fast SMA.
SHORT:
Price must be BELOW the slow SMA.
When a candle closes in RSI overbought area, the next candle closes out of the overbought area and the closing price is ABOVE the fast SMA = open SHORT.
SHORT is closed when a candle closes BELOW the fast SMA.
*Larry Connor's strategy does NOT use a fixed Stop Loss or Take Profit, as he said, that reduces performance significantly.
- Visual:
Both SMAs (fast and slow) are shown in the chart.
By default, the fast SMA is aqua color, the slow changes between green and red depending on the "trend" (price over slow SMA = bullish, below = bearish).
RSI can't be shown because TradingView doesn't allow to show both overlay and panel indicators, so candles get a RED color when RSI is in OVERBOUGHT area and GREEN when they're on OVERSOLD area to help with that.
Background is colored when conditions are met and a position is going to be open, green for LONGs red for SHORTs.
- Usage and recommendations:
As this is a coded strategy, you don't even have to check for indicators, just open and close trades as the strategy shows.
The original strategy uses a 5 period SMA instead of the 10, and 10/90 for oversold/overbought levels, this has been optimized after the testings and results but feel free to change settings and test by yourself.
Also, the original strategy was developed for daily, but seems to work better en 4H.
- Customization:
As usual I like to make as many aspects of my indicators/strategies customizable, indicators, colors etc., feel free to ask if you feel that something that should be configurable is missing or if you have any ideas to optimize the strategy.
============
ESPAÑOL
============
- Descripción:
Esta estrategia está basada en la estrategia original de Larry Connors, utilizando 2 SMAs y RSI.
La estrategia ha sido optimizada para un mejor beneficio total y funciona mejor en 4H (probado en BTCUSDT).
LONG:
El precio debe estar por encima de la SMA lenta.
Cuando una vela cierra en la zona de sobreventa del RSI, la siguiente vela cierra fuera de la zona de sobreventa y el precio de cierre está POR DEBAJO de la SMA rápida = abre LONG.
Se cierra cuando una vela cierra POR ENCIMA de la SMA rápida.
SHORT:
El precio debe estar POR DEBAJO de la SMA lenta.
Cuando una vela cierra en la zona de sobrecompra del RSI, la siguiente vela cierra fuera de la zona de sobrecompra y el precio de cierre está POR ENCIMA de la SMA rápida = abre SHORT.
Se cierra cuando una vela cierra POR DEBAJO de la SMA rápida.
*La estrategia de Larry Connor NO utiliza un Stop Loss o Take Profit fijo, como él dijo, eso reduce el rendimiento significativamente.
- Visual:
Ambas SMAs (rápida y lenta) se muestran en el gráfico.
Por defecto, la SMA rápida es de color aqua, la lenta cambia entre verde y rojo dependiendo de la "tendencia" (precio por encima de la SMA lenta = alcista, por debajo = bajista).
El RSI no puede mostrarse porque TradingView no permite mostrar tanto los indicadores superpuestos como los del panel, así que las velas obtienen un color ROJO cuando el RSI está en el área de SOBRECOMPRA y VERDE cuando están en el área de VENTA para ayudar a ello.
El fondo se colorea cuando se cumplen las condiciones y se va a abrir una posición, verde para LONGs rojo para SHORTs.
- Uso y recomendaciones:
Como se trata de una estrategia ya programada, ni siquiera hay que comprobar los indicadores, sólo hay que abrir y cerrar las operaciones tal y como muestra la estrategia en el gráfico.
La estrategia original utiliza una SMA de 5 periodos en lugar de 10, y 10/90 para los niveles de sobreventa/sobrecompra, esto ha sido optimizado después de las pruebas y los resultados, pero sé libre de cambiar la configuración y probarla por sí mismo.
Además, la estrategia original fue desarrollada para diario, pero parece funcionar mejor en 4H.
- Personalización:
Como siempre me gusta hacer personalizables todos los aspectos de mis indicadores/estrategias, indicadores, colores, etc., preguntar si notas que falta algo que debería ser configurable o si tienes alguna idea para optimizar la estrategia.

MTF RSI & STOCH Strategy by kziThis script is a teaml job with Indicator-Johns.
First he used my script, then i transform his code.
The origine:
The first transformation:
www.tradingview.com
Funny moment together, thanks for that. :)
This sharing is an indicator where you can see the average of different time frames.
The RSI is the blue line
The Stock is the yellow line
You can manage the timeframe in the parameters.
The strategy is to take position when the two lines get overbought or oversold and close when the stoch and RSI goes to the middle.

Oversold RSI with Tight Stop-Loss Strategy (by Coinrule)KRAKEN:LINKUSD
This is one of the best strategies that can be used to get familiar with technical indicators and start to include them in your rules on Coinrule .
ENTRY
1. This trading system uses the RSI (Relative Strength Index) to anticipate good points to enter positions. RSI is a technical indicator frequently used in trading. It works by measuring the speed and change of price movements to determine whether a coin is oversold (indicating a good entry point) or overbought (indicating a point of exit/entry for a short position). The RSI oscillates between 0 and 100 and is traditionally considered overbought when over 70 and oversold when below 30.
2. To pick the right moment to buy, the strategy enters a trade when the RSI falls below 30 indicating the coin is oversold and primed for a trend reversal.
EXIT
The strategy then exits the position when the price appreciates 7% from the point of entry. The position also maintains a tight stop-loss and closes the position if the price depreciates 1% from the entry price. The idea behind this is to cut your losing trades fast and let your winners ride.
The best time frame for this strategy based on our back testing data is the daily. Shorter time frames can also work well on certain coins, however in our experience, the daily works best. Feel free to experiment with this script and test it on a variety of your coins! With our back testing data a trading fee of 0.1% is taken into account. The fee is aligned to the base fee applied on Binance, which is the largest cryptocurrency exchange by volume. In the example shown, this strategy made a handsome net profit of 52.6% on Chainlink with 66.67% of trades being profitable.
You can execute this strategy on your favorite exchanges with Coinrule .
