Kitchen [ilovealgotrading]
OVERVIEW:
Kitchen is a strategy that aims to trade in the direction of the trend by using supertrend and stochRsi data by calculating at different time values.
IMPLEMENTATION DETAILS – SETTINGS:
First of all, let's understand the supertrend and stocrsi indicators.
How do you read and use Super Trend for trading ?
The price is often going upwards when it breaks the super trend line while keeping its position above the indication level.
When the market is in a bullish trend, the indicator becomes green. The indicator level will act as trendline support in such a scenario. The color of the indicator changes to red to indicate a negative trend once the price crosses the support line. The price uses the super trend level as a trendline resistance during a bearish move.
In our strategy, if our 1-hour and 4-hour supertrend lines show the up or down train in the same direction at the same time, we can assume that a train is forming here.
Why do I use the time of 1 hour and 4 hours ?
When I did a backtest from the past to the present, I discovered that the most accurate and consistent time zones are the 1 hour and 4 hour time zones.
By the way we can change our short term timeframe(1H) and long term timeframe(4H) from settings panel.
How do you read and use the Stoch-RSI Indicator?
This indicator analyzes price dynamics automatically to detect overbought and oversold locations.
The indicator includes:
- The primary line, which typically has values between 0 and 100;
- Two dynamic levels for overbought and oversold conditions.
IF our stoch-rsi indicator value has fallen below our lower boundary line, the oversold event has been observed in the price, if our stoch-rsi value breaks up our bottom line after becoming oversold, we think that the price will start the recovery phase.(The case is also true for the opposite.)
However, this does not always apply and we need additional approvals, Therefore, our 1H and 4H supertrrend indicator provides us with additional confirmation.
Buy Condition:
Our 1H(short term) and 4H(long term) supertrrend indicator, has given the buy signal(green line and yellow line), and if our stochrsi indicator has broken our oversold line up on the past 15 bars, the buy signal is formed here.
Sell Condition:
Our 1H(short term) and 4H(long term) supertrrend indicator, has given the sell signal(red line and orange line), and if our stochrsi indicator has broken our overbuy line down on the past 15 bars, the sell signal is formed here.
Stop Loss or Take Profit Conditions:
Exit Long Senerio:
All conditions are completed, the buy signal has arrived and we have entered a LONG trade, the 1-hour supertrend line follows the price rise(yellow line), if the price breaks below the 1-hour super trend line and a sell condition occurs for 1H timeframe for supertrend indcator, LONG trade will exit here.
Exit Short Senerio:
All conditions are completed, the Sell signal has arrived and we have entered a SHORT trade, the 1-hour supertrend line follows the price down(orange line), if the price breaks up the 1-hour super trend line and a buy condition occurs for 1H timeframe for supertrend indcator, SHORT trade will exit here.
What can you change in the settings panel?
1-We can set Start and End date for backtest and future alarms
2-We can set ATR length and Factor for supertrend indicator
3-We can set our short term and long term timeframe value
4-We can set StochRsi Up and Low limit to confirm buy and sell conditions
5-We can set stochrsi retroactive approval length
6-We can set stochrsi values or the length
7-We can set Dollar cost for per position
8- We can choose the direction of our positions, we can set only LONG, only SHORT or both directions.
9-IF you want to place automatic buy and sell orders with this strategy, you can paste your codes into the Long open-close or Short open-close message sections.
For example
IF you write your alert window this code {{strategy.order.alert_message}}.
When trigger Long signal you will get dynamically what you pasted here for Long Open Message
ALSO:
Please do not open trades without properly managing your risk and psychology!!!
If you have any ideas what to add to my work to add more sources or make calculations cooler, suggest in DM .
相對強弱指標(RSI)

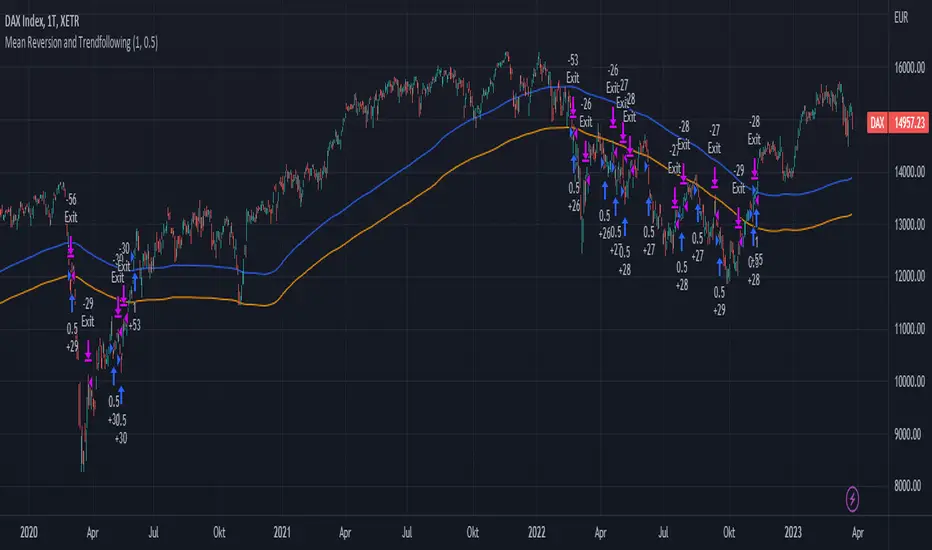
Mean Reversion and TrendfollowingTitle: Mean Reversion and Trendfollowing
Introduction:
This script presents a hybrid trading strategy that combines mean reversion and trend following techniques. The strategy aims to capitalize on short-term price corrections during a downtrend (mean reversion) as well as ride the momentum of a trending market (trend following). It uses a 200-period Simple Moving Average (SMA) and a 2-period Relative Strength Index (RSI) to generate buy and sell signals.
Key Features:
Combines mean reversion and trend following techniques
Utilizes 200-period SMA and 2-period RSI
Customizable starting date
Allows for enabling/disabling mean reversion or trend following modes
Adjustable position sizing for trend following and mean reversion
Script Description:
The script implements a trading strategy that combines mean reversion and trend following techniques. Users can enable or disable either of these techniques through the input options. The strategy uses a 200-period Simple Moving Average (SMA) and a 2-period Relative Strength Index (RSI) to generate buy and sell signals.
The mean reversion mode is active when the price is below the SMA200, while the trend following mode is active when the price is above the SMA200. The script generates buy signals when the RSI is below 20 (oversold) in mean reversion mode or when the price is above the SMA200 in trend following mode. The script generates sell signals when the RSI is above 80 (overbought) in mean reversion mode or when the price falls below 95% of the SMA200 in trend following mode.
Users can adjust the position sizing for both trend following and mean reversion modes using the input options.
To use this script on TradingView, follow these steps:
Open TradingView and load your preferred chart.
Click on the 'Pine Editor' tab located at the bottom of the screen.
Paste the provided script into the Pine Editor.
Click 'Add to Chart' to apply the strategy to your chart.
Please note that the past performance of any trading system or methodology is not necessarily indicative of future results. Always use proper risk management and consult a financial advisor before making any investment decisions.
------
The following is a summary of the underlying whitepaper (onlinelibrary.wiley.com) for this strategy:
This paper proposes a theory of securities market under- and overreactions based on two psychological biases: investor overconfidence about the precision of private information and biased self-attribution, which causes asymmetric shifts in investors' confidence as a function of their investment outcomes. The authors show that overconfidence implies negative long-lag autocorrelations, excess volatility, and public-event-based return predictability. Biased self-attribution adds positive short-lag autocorrelations (momentum), short-run earnings "drift," and negative correlation between future returns and long-term past stock market and accounting performance.
The paper explains that there is empirical evidence challenging the traditional view that securities are rationally priced to reflect all publicly available information. Some of these anomalies include event-based return predictability, short-term momentum, long-term reversal, high volatility of asset prices relative to fundamentals, and short-run post-earnings announcement stock price "drift."
The authors argue that investor overconfidence can lead to stock prices overreacting to private information signals and underreacting to public signals. This overreaction-correction pattern is consistent with long-run negative autocorrelation in stock returns, excess volatility, and further implications for volatility conditional on the type of signal. The market's tendency to over- or underreact to different types of information allows the authors to address the pattern that average announcement date returns in virtually all event studies are of the same sign as the average post-event abnormal returns.
Biased self-attribution implies short-run momentum and long-term reversals in security prices. The dynamic analysis based on biased self-attribution can also lead to a lag-dependent response to corporate events. Cash flow or earnings surprises at first tend to reinforce confidence, causing a same-direction average stock price trend. Later reversal of overreaction can lead to an opposing stock price trend.
The paper concludes by summarizing the findings, relating the analysis to the literature on exogenous noise trading, and discussing issues related to the survival of overconfident traders in financial markets.
Advanced VWAP_Pullback Strategy_Trend-Template QualifierGeneral Description and Unique Features of this Script
Introducing the Advanced VWAP Momentum-Pullback Strategy (long-only) that offers several unique features:
1. Our script/strategy utilizes Mark Minervini's Trend-Template as a qualifier for identifying stocks and other financial securities in confirmed uptrends. Mark Minervini, a 2x US Investment Champion, developed the Trend-Template, which covers eight different and independent characteristics that can be adjusted and optimized in this trend-following strategy to ensure the best results. The strategy will only trigger buy-signals in case the optimized qualifiers are being met.
2. Our strategy is based on the supply/demand balance in the market, making it timeless and effective across all timeframes. Whether you are day trading using 1- or 5-min charts or swing-trading using daily charts, this strategy can be applied and works very well.
3. We have also integrated technical indicators such as the RSI and the MA / VWAP crossover into this strategy to identify low-risk pullback entries in the context of confirmed uptrends. By doing so, the risk profile of this strategy and drawdowns are being reduced to an absolute minimum.
Minervini’s Trend-Template and the ‘Stage-Analysis’ of the Markets
This strategy is a so-called 'long-only' strategy. This means that we only take long positions, short positions are not considered.
The best market environment for such strategies are periods of stable upward trends in the so-called stage 2 - uptrend.
In stable upward trends, we increase our market exposure and risk.
In sideways markets and downward trends or bear markets, we reduce our exposure very quickly or go 100% to cash and wait for the markets to recover and improve. This allows us to avoid major losses and drawdowns.
This simple rule gives us a significant advantage over most undisciplined traders and amateurs!
'The Trend is your Friend'. This is a very old but true quote.
What's behind it???
• 98% of stocks made their biggest gains in a Phase 2 upward trend.
• If a stock is in a stable uptrend, this is evidence that larger institutions are buying the stock sustainably.
• By focusing on stocks that are in a stable uptrend, the chances of profit are significantly increased.
• In a stable uptrend, investors know exactly what to expect from further price developments. This makes it possible to locate low-risk entry points.
The goal is not to buy at the lowest price – the goal is to buy at the right price!
Each stock goes through the same maturity cycle – it starts at stage 1 and ends at stage 4
Stage 1 – Neglect Phase – Consolidation
Stage 2 – Progressive Phase – Accumulation
Stage 3 – Topping Phase – Distribution
Stage 4 – Downtrend – Capitulation
This strategy focuses on identifying stocks in confirmed stage 2 uptrends. This in itself gives us an advantage over long-term investors and less professional traders.
By focusing on stocks in a stage 2 uptrend, we avoid losses in downtrends (stage 4) or less profitable consolidation phases (stages 1 and 3). We are fully invested and put our money to work for us, and we are fully invested when stocks are in their stage 2 uptrends.
But how can we use technical chart analysis to find stocks that are in a stable stage 2 uptrend?
Mark Minervini has developed the so-called 'trend template' for this purpose. This is an essential part of our JS-TechTrading pullback strategy. For our watchlists, only those individual values that meet the tough requirements of Minervini's trend template are eligible.
The Trend Template
• 200d MA increasing over a period of at least 1 month, better 4-5 months or longer
• 150d MA above 200d MA
• 50d MA above 150d MA and 200d MA
• Course above 50d MA, 150d MA and 200d MA
• Ideally, the 50d MA is increasing over at least 1 month
• Price at least 25% above the 52w low
• Price within 25% of 52w high
• High relative strength according to IBD.
NOTE: In this basic version of the script, the Trend-Template has to be used as a separate indicator on TradingView (Public Trend-Template indicators are available in TradingView – community scripts). It is recommended to only execute buy signals in case the stock or financial security is in a stage 2 uptrend, which means that the criteria of the trend-template are fulfilled.
This strategy can be applied to all timeframes from 5 min to daily.
The VWAP Momentum-Pullback Strategy
For the JS-TechTrading VWAP Momentum-Pullback Strategy, only stocks and other financial instruments that meet the selected criteria of Mark Minervini's trend template are recommended for algorithmic trading with this startegy.
A further prerequisite for generating a buy signals is that the individual value is in a short-term oversold state (RSI).
When the selling pressure is over and the continuation of the uptrend can be confirmed by the MA / VWAP crossover after reaching a price low, a buy signal is issued by this strategy.
Stop-loss limits and profit targets can be set variably. You also have the option to make use of the trailing stop exit strategy.
Relative Strength Index (RSI)
The Relative Strength Index (RSI) is a technical indicator developed by Welles Wilder in 1978. The RSI is used to perform a market value analysis and identify the strength of a trend as well as overbought and oversold conditions. The indicator is calculated on a scale from 0 to 100 and shows how much an asset has risen or fallen relative to its own price in recent periods.
The RSI is calculated as the ratio of average profits to average losses over a certain period of time. A high value of the RSI indicates an overbought situation, while a low value indicates an oversold situation. Typically, a value > 70 is considered an overbought threshold and a value < 30 is considered an oversold threshold. A value above 70 signals that a single value may be overvalued and a decrease in price is likely , while a value below 30 signals that a single value may be undervalued and an increase in price is likely.
For example, let's say you're watching a stock XYZ. After a prolonged falling movement, the RSI value of this stock has fallen to 26. This means that the stock is oversold and that it is time for a potential recovery. Therefore, a trader might decide to buy this stock in the hope that it will rise again soon.
The MA / VWAP Crossover Trading Strategy
This strategy combines two popular technical indicators: the Moving Average (MA) and the Volume Weighted Average Price (VWAP). The MA VWAP crossover strategy is used to identify potential trend reversals and entry/exit points in the market.
The VWAP is calculated by taking the average price of an asset for a given period, weighted by the volume traded at each price level. The MA, on the other hand, is calculated by taking the average price of an asset over a specified number of periods. When the MA crosses above the VWAP, it suggests that buying pressure is increasing, and it may be a good time to enter a long position. When the MA crosses below the VWAP, it suggests that selling pressure is increasing, and it may be a good time to exit a long position or enter a short position.
Traders typically use the MA VWAP crossover strategy in conjunction with other technical indicators and fundamental analysis to make more informed trading decisions. As with any trading strategy, it is important to carefully consider the risks and potential rewards before making any trades.
This strategy is applicable to all timeframes and the relevant parameters for the underlying indicators (RSI and MA/VWAP) can be adjusted and optimized as needed.
Backtesting
Backtesting gives outstanding results on all timeframes and drawdowns can be reduced to a minimum level. In this example, the hourly chart for MCFT has been used.
Settings for backtesting are:
- Period from Jan 2020 until March 2023
- Starting capital 100k USD
- Position size = 25% of equity
- 0.01% commission = USD 2.50.- per Trade
- Slippage = 2 ticks
Other comments
- This strategy has been designed to identify the most promising, highest probability entries and trades for each stock or other financial security.
- The combination of the Trend-Template and the RSI qualifiers results in a highly selective strategy which only considers the most promising swing-trading entries. As a result, you will normally only find a low number of trades for each stock or other financial security per year in case you apply this strategy for the daily charts. Shorter timeframes will result in a higher number of trades / year.
- Consequently, traders need to apply this strategy for a full watchlist rather than just one financial security.

Soheil PKO's 5 min Hitman Scalp - 3MA + Laguerre RSI + ADX [Pt]Someone sent me this strategy found on YouTube. It is Soheil PKO's "The Best and Most Profitable Scalping Strategy" Best way to find out is to code it =)
This strategy uses Moving Average Ribbon, Laguerre RSI, and ADX. This script only displays the MA ribbon, you will need to add Laguerre RSI and ADX separately.
Long Entry Criteria:
- 16 EMA > 48 EMA > 200 SMA
- Laguerre RSI > 80
- ADX > 20
Long Exit Criterion:
- 16 EMA < 48 EMA
Short Entry Criteria:
- 16 EMA < 48 EMA < 200 SMA
- Laguerre RSI < 20
- ADX > 20
Short Exit Criterion:
- 16 EMA > 48 EMA
As mentioned in the video, risk management is very important, especially for scalping strategies. Therefore, I've added option for setting Stop Loss and Price Target in the options for you guys to play with.
All parameters are configurable.
Enjoy~~

Shorting when Bollinger Band Above Price with RSI (by Coinrule)The Bollinger Bands are among the most famous and widely used indicators. A Bollinger Band is a technical analysis tool defined by a set of trendlines plotted two standard deviations (positively and negatively) away from a simple moving average ( SMA ) of a security's price, but which can be adjusted to user preferences. They can suggest when an asset is oversold or overbought in the short term, thus providing the best time for buying and selling it.
The relative strength index ( RSI ) is a momentum indicator used in technical analysis. RSI measures the speed and magnitude of a security's recent price changes to evaluate overvalued or undervalued conditions in the price of that security. The RSI can do more than point to overbought and oversold securities. It can also indicate securities primed for a trend reversal or corrective pullback in price. It can signal when to buy and sell. Traditionally, an RSI reading of 70 or above indicates an overbought situation. A reading of 30 or below indicates an oversold condition.
The short order is placed on assets that present strong momentum when it's more likely that it is about to reverse. The rule strategy places and closes the order when the following conditions are met:
ENTRY
The closing price is greater than the upper standard deviation of the Bollinger Bands
The RSI is less than 70.
EXIT
The trade is closed when the RSI is less than 70
The lower standard deviation of the Bollinger Band is less than the closing price.
This strategy was backtested from the beginning of 2022 to capture how this strategy would perform in a bear market.
The strategy assumes each order to trade 70% of the available capital to make the results more realistic. A trading fee of 0.1% is taken into account. The fee is aligned to the base fee applied on Binance, which is the largest cryptocurrency exchange by volume.

Simple_RSI+PA+DCA StrategyThis strategy is a result of a study to understand better the workings of functions, for loops and the use of lines to visualize price levels. The strategy is a complete rewrite of the older RSI+PA+DCA Strategy with the goal to make it dynamic and to simplify the strategy settings to the bare minimum.
In case you are not familiar with the older RSI+PA+DCA Strategy, here is a short explanation of the idea behind the strategy:
The idea behind the strategy based on an RSI strategy of buying low. A position is entered when the RSI and moving average conditions are met. The position is closed when it reaches a specified take profit percentage. As soon as the first the position is opened multiple PA (price average) layers are setup based on a specified percentage of price drop. When the price hits the layer another position with the same position size is is opened. This causes the average cost price (the white line) to decrease. If the price drops more, another position is opened with another price average decrease as result. When the price starts rising again the different positions are separately closed when each reaches the specified take profit. The positions can be re-opened when the price drops again. And so on. When the price rises more and crosses over the average price and reached the specified Stop level (the red line) on top of it, it closes all the positions at once and cancels all orders. From that moment on it waits for another price dip before it opens a new position.
This is the old RSI+PA+DCA Strategy:
The reason to completely rewrite the code for this strategy is to create a more automated, adaptable and dynamic system. The old version is static and because of the linear use of code the amount of DCA levels were fixed to max 6 layers. If you want to add more DCA layers you manually need to change the script and add extra code. The big difference in the new version is that you can specify the amount of DCA layers in the strategy settings. The use of 'for loops' in the code gives the possibility to make this very dynamic and adaptable.
The RSI code is adapted, just like the old version, from the RSI Strategy - Buy The Dips by Coinrule and is used for study purpose. Any other low/dip finding indicator can be used as well
The distance between the DCA layers are calculated exponentially in a function. In the settings you can define the exponential scale to create the distance between the layers. The bigger the scale the bigger the distance. This calculation is not working perfectly yet and needs way more experimentation. Feel free to leave a comment if you have a better idea about this.
The idea behind generating DCA layers with a 'for loop' is inspired by the Backtesting 3commas DCA Bot v2 by rouxam .
The ideas for creating a dynamic position count and for opening and closing different positions separately based on a specified take profit are taken from the Simple_Pyramiding strategy I wrote previously.
This code is a result of a study and not intended for use as a full functioning strategy. To make the code understandable for users that are not so much introduced into pine script (like myself), every step in the code is commented to explain what it does. Hopefully it helps.
Enjoy!

Negroni MA & RSI Strategy, plus trade entry and SL/TP optionsI will start with the context, and some things to think about when using a strategy tool to back-test ideas.
CONTEXT
FIRST: This is derived from other people's work, but I honestly hadn't found a mixed indicator MA strategy tool that does what this now does. If it is out there, apologies!!
This tool can help back-test various MA trends (SMA, EMA, HMA, VWMA); as well as factoring in RSI levels (or not); and can factor in a fixed HTF MA (or not). You can apply a 'retest entry' or a 'breakout entry', and you can also apply various risk mgt for SL/TP orders: 1) No SL/TP; or 2) a fixed %, or 3) dynamic ATR multipliers.
Find below, some details explaining what this tool is attempting to do.
Thank you, tack, salute!
THINGS TO REVIEW (it is not just about 'profitability'!!)
Whilst discretion is always highly encouraged as a trader, and a 100% indicator-driven strategy is VERY unlikely to yield sustainable results going forward, at the very least back-testing your strategies can help provide some guidance, not just on win rate Vs profit factor, but other things including:
a) Trade frequency: if a strategy has an 75% win rate and profit factor of 4, with all your parameters and confluence checks, but only triggers 3 trades every 5 years, is that realistically implementable to your trading situation if you have a $10,000 account?
b) Trade entry type: is it consistently better to wait for a retest of an 'MA zone', or is it better to market buy/sell on breakout of the 'MA zone'?
c) Risk management (SL/TP): is it consistently better to have a fixed static % for SL/TP ("I always place my stops 2% away, whether it is EURUSD or BTCUSDT"), or would you be better placed to try using an ATR multiplier of the respective assets?
d) Moving average type: is your old faithful 100 EMA really serving you well, or is the classic SMA more reliable, or how about the HMA, or the VWMA? Is the 100/200 cross holding up, or do you need something more sensitive? Is there any significant difference between a 10 EMA/20 EMA trend zone compared to a 13 EMA /25 EMA zone?
e) Confluence: Do added confluence checks (RSI, higher timeframe MA) actually improve profitability? But even if they do, is at the cost of cutting too many trades?
INPUTS AND PARAMETERS
Choice 1) Entry Strategy: Retest or Breakout - You can select both!
[ ]:
a) RETEST entry strat: price crosses UNDER FastMA INTO the 'MA trend zone'.
b) BREAKOUT entry strat: price crosses OVER FastMA OUT the 'MA trend zone'.
Choice 2) Risk Management (SL and TP) - You can select more than 1 strategy!
a) No SL/TP: Long trades are closed when the LOW crosses back UNDER the fastMA again, and shorts are closed when the HIGH crosses back OVER the fastMA again.
b) Static % SL/TP: Your SL/TP will be a fixed % away from avg. position price... WARNING: You should change this for various asset classes; FX vol is not the same as crypto altcoin vol!
c) Dynamic ATR SL/TP: Your SL/TP is a multiple of your selected ATR range (default is 50, see 'info' when you select ATR range). ATR accounts for the change in vol of different asset classes somewhat, HOWEVER... you should probably still not have the same multiplier trading S&P500 as you would trading crypto altcoins!
Then select your preferred parameters: EMA, SMA, HMA, VWMA, etc. You can mix and match, and most options have a info/tooltip guide.
RSI note: If you don't care for RSI levels, then set buy signal at 1... i.e always buys! Similarly set sell signal at 99.
ATR note: standard ATR length is usually 14, however... your SL/TP will move POST entry, and can tighten or widen your initial SL/TP... for better AND usually for worse! Go find a trade (strat 3) on the chart, look at the SL/TP lines, now change the number to 5, you'll see.
Fixed HTF MA note: If you don't care for HTF MA confluence, just change the timeframe/options to match the 'Slow MA' options you've chosen.

Rsi strategy for BTC with (Rsi SPX)
I hope this strategy is just an idea and a starting point, I use the correlation of the Sp500 with the Btc, this does not mean that this correlation will exist forever!. I love Trading view and I'm learning to program, I find correlations very interesting and here is a simple strategy.
This is a trading strategy script written in Pine Script language for use in TradingView. Here is a brief overview of the strategy:
The script uses the RSI (Relative Strength Index) technical indicator with a period of 14 on two securities: the S&P 500 (SPX) and the symbol corresponding to the current chart (presumably Bitcoin, based on the variable name "Btc_1h_fixed"). The RSI is plotted on the chart for both securities.
The script then sets up two trading conditions using the RSI values:
A long entry condition: when the RSI for the current symbol crosses above the RSI for the S&P 500, a long trade is opened using the "strategy.entry" function.
A short entry condition: when the RSI for the current symbol crosses below the RSI for the S&P 500, a short trade is opened using the "strategy.entry" function.
The script also includes a take profit input parameter that allows the user to set a percentage profit target for closing the trade. The take profit is set using the "strategy.exit" function.
Overall, the strategy aims to take advantage of divergences in RSI values between the current symbol and the S&P 500 by opening long or short trades accordingly. The take profit parameter allows the user to set a specific profit target for each trade. However, the script does not include any stop loss or risk management features, which should be considered when implementing the strategy in a real trading scenario.

Kimchi Premium StrategyThis strategy is based on the Korea Premium, also known as the “Kimchi Premium,” which indicates how expensive or cheap the price of Bitcoin in Korean Won on a Bitcoin exchange in South Korea is relative to the price of Bitcoin being traded in USD or Tether. Inverse Kimchi Premium RSI was newly defined to create a strategy with Kimchi Premium. Assuming that the larger the kimchi premium, the greater the individual's purchasing power. In this case, if the Inverse Kimchi Premium RSI falls and closes the candle below the bear level, a short is triggered. Long is the opposite.
This strategy defaults to a combination of the traditional RSI and the Inverse Kimchi Premium RSI. If the user wishes to unlock the Inverse Kimchi Premium RSI combination and only use it as a traditional RSI strategy, the following settings can be used.
Use Combination of Inverse Kimchi Premium RSI: Uncheck
Resolution: Chart (4hr Candle)
Source: Close
Length of RSI: 14
Bull Level: 74
Bear Level: 25
__________________________________________________________________________________
김치프리미엄(김프) 전략은 달러 혹은 테더로 거래되고 있는 비트코인 가격 대비 한국에 있는 비트코인 거래소의 비트코인 원화 가격이 얼마나 비싸고 싼 지를 나타내는 코리아 프리미엄, 일명 "김치 프리미엄" 지표를 기반으로 만들어졌습니다. 김치 프리미엄을 가지고 전략을 만들기위해 Inverse Kimchi Premium RSI를 새롭게 정의하였습니다. 김치 프리미엄이 커질수록 개인의 매수세가 커진다고 가정하고, 이 경우 Inverse Kimchi Premium RSI이 하락하여 Bear Level 아래에서 캔들 마감을 하면 Short을 트리거 합니다. Long은 그 반대입니다.
이 전략은 전통적인 RSI와 Inverse Kimchi Premium RSI을 조합하여 기본값을 설정하였습니다. 유저가 원한다면 Inverse Kimchi Premium RSI의 조합을 해제하고 전통적인 RSI 전략으로만 사용하려면 아래 다음의 설정값을 사용할 수 있습니다.
Use Combination of Inverse Kimchi Premium RSI: 체크 해제
Resolution: Chart (4hr Candle)
Source: Close
Length of RSI: 14
Bull Level: 74
Bear Level: 25

ATR_RSI_Strategy v2 with no repaint [liwei666]🎲 Overview
🎯 this is a optimized version based on ATR_RSI_Strategy with no-repaint.
Sharpe ratio: 1.4, trade times: 116 ,
trade symbol: BINANCE:BTCUSDTPERP 15M
you can get same backtesting result with the correct settings.
🎲 Strategy Logic
🎯 the core logic is quite simple, use ATR and RSI and SMA
1. when price is in high volatility ( atr_value > atr_ma);
2. wait for a break signal (rsi_value > rsi_buy or rsi_value < rsi_sell);
3. entry Long or Short,use trailing stop-loss to max security and percent TP to keep profit.
🎲 Settings
🎯 there are 7 input properties in script, but I only finetune 4 of them ( bold field below ),
you may change other parameter to get better result by yourself.
atr_length: length to get atr value
atr_ma_length : length of smoothing atr value
atr_ma_norm_min : atr_ma normalized min value, filter high volatility ranges
atr_ma_norm_max : atr_ma normalized max value, filter high volatility ranges
rsi_length : length to get rsi value
rsi_entry: 50 +/- rsi_entry to get entry threshold
trailing_percent: trailing stop-loss percent
🎲 Usage
🎯 the commission set to 0.05% , part of exchange the commission is less than 0.05% in reality,
but I will still use 0.05% in my next script.
🎯 this script use 50% of equity to size positions follow general script position,
you can adjust the value to fix size or 100% of equity to compare result with other strategy,
but I still suggest you use 5-10% of equity for each strategy in reality.
🎯any questions please comment below. if there are any words violate House Rule, please tell me below and i will revise immediately
don't want be hiddened again 😂😂
Additionally, I plan to publish 20 profitable strategies in 2023;
let‘s witness it together!
Hope this strategy will be usefull for you :)
enjoy! 🚀🚀🚀

DRM StrategyOne of the ways I go when I develop strategies is by reducing the number of parameters and removing fixed parameters and levels.
In this strategy, I'm trying to create an RSI indicator with a dynamic length.
Length is computed based on the correlation between Price and its momentum.
You can set min and max values for the RSI, and if the correlation is close to 1, we'll be at a min RSI value. When it's -1, we'll be at the max level.
I got this idea from Sofien Kaabar's book.
The strategy is super simple, and there might be much room for improvement.
Performance on the deep backtesting is not excellent, so I think the strategy needs some filters for regimes, etc.
Thanks to @MUQWISHI for helping me code it.
Disclaimer
Please remember that past performance may not indicate future results.
Due to various factors, including changing market conditions, the strategy may no longer perform as well as in historical backtesting.
This post and the script don’t provide any financial advice.

RSI and MA with Trailing Stop Loss and Take Profit (by Coinrule)The relative strength index is a momentum indicator used in technical analysis. It measures the speed and magnitude of a coin's recent price changes to evaluate overvalued or undervalued conditions in the price of that coin. The RSI is displayed as an oscillator (a line graph essentially) on a scale of zero to 100. When the RSI reaches oversold levels, it can provide a signal to go long. When the RSI reaches overbought levels, it can mark a good exit point or alternatively, an entry for a short position. Traditionally, an RSI reading of 70 or above indicates an overbought situation. A reading of 30 or below indicates an oversold condition.
A moving average (MA) calculates the average of a selected range of prices, usually closing prices, by the number of periods in that range. Essentially it is used to help smooth out price data by creating a constantly updated average price.
The Strategy enters and closes trades when the following conditions are met:
Entry Conditions:
RSI is greater than 50
MA9 is greater than MA50
RSI increases by 5
Exit Conditions:
Price increases by 1% trailing
Price decreases by 2% trailing
This strategy is back-tested from 1 January 2022 to simulate how the strategy would work in a bear market. The strategy provides good returns.
The strategy assumes each order is using 30% of the available coins to make the results more realistic and to simulate you only ran this strategy on 30% of your holdings. A trading fee of 0.1% is also taken into account and is aligned to the base fee applied on Binance.

M0PB (Momentum Pullback)Long/short strategy that identifies extreme readings on the rsi as a *momentum signal*, unlike most RSI strategies the script will look to buy or sell the first pullback in the direction of the extreme RSI reading.
Enters positions on the first pullback to the 5ema(low)/ 5ema(high) and exits at rolling 12 bar high/ low. The rolling high/ low feature means that if the price enters into a prolonged consolidation the profit target will begin to reduce with each new bar. The best trades tend to work within 2-6 bars.
Built for use on 5 min intervals on FX, Indexes, and Crypto. Lower than 5 minute time frames tend to be noisier and mean more commissions and a higher risk of slippage so the suggested timeframe is 5 mins.
Hard stop is X ATR (users can experiment with this) from the position entry price. This can be adjusted in user inputs.
There is a lot of slack left in entries and exits but the overall strategy is fairly robust across timeframes and markets and has between 60%-70% win rate with larger winners.
Signals that occur from economic news volatility are best avoided.

I11L - Meanreverter 4h---Overview---
The system buys fear and sells greed.
Its relies on a Relative Strength Index (RSI) and moving averages (MA) to find oversold and overbought states.
It seems to work best in market conditions where the Bond market has a negative Beta to Stocks.
Backtests in a longer Timeframe will clearly show this.
---Parameter---
Frequency: Smothens the RSI curve, helps to "remember" recent highs better.
RsiFrequency: A Frequency of 40 implies a RSI over the last 40 Bars.
BuyZoneDistance: Spacing between the different zones. A wider spacing reduces the amount of signals and icnreases the holding duration. Should be finetuned with tradingcosts in mind.
AvgDownATRSum: The multiple of the Average ATR over 20 Bars * amount of opentrades for your average down. I choose the ATR over a fixed percent loss to find more signals in low volatility environments and less in high volatility environments.
---Some of my thoughts---
Be very careful about the good backtesting performance in many US-Stocks because the System had a favourable environment since 1970.
Be careful about the survivorship bias as well.
52% of stocks from the S&P500 were removed since 2000.
I discount my Annual Results by 5% because of this fact.
You will find yourself quite often with very few signals because of the high market correlation.
My testing suggests that there is no expected total performance difference between a signal from a bad and a signal from a good market condition but a higher volatility.
I am sharing this strategy because i am currently not able to implement it as i want to and i think that meanreversion is starting to be taken more serious by traders.
The challange in implementing this strategy is that you need to be invested 100% of the time to retrieve the expected annual performance and to reduce the fat tail risk by market crashes.

RSI Divergence Strategywhat is "RSI Divergence Strategy"?
it is a RSI strategy based this indicator:
what it does?
it gives buy or sell signals according to RSI Divergences. it also has different variables such as "take profit", "stop loss" and trailing stop loss.
how it does it?
it uses the "RSI Divergence" indicator to give signal. For detailed information on how it works, you can visit the link above. The quantity of the inputs is proportional to the rsi values. Long trades are directly traded with "RSI" value, while short poses are traded with "100-RSI" value.
How to use it?
The default settings are for scalp strategy but can be used for any type of trading strategy. you can develop different strategies by changing the sections. It is quite simple to use.
RSI length is length of RSİ
source is source of RSİ
RSİ Divergence lenght is length of line on the RSI
The "take profit", "stop" and "trailing stop" parts used in the "buy" group only affect buys. The "sell" group is similarly independent of the variables in the "buy" group.
The "zoom" section is used to enlarge or reduce the indicator. it only changes the appearance, it does not affect the results of the strategy.

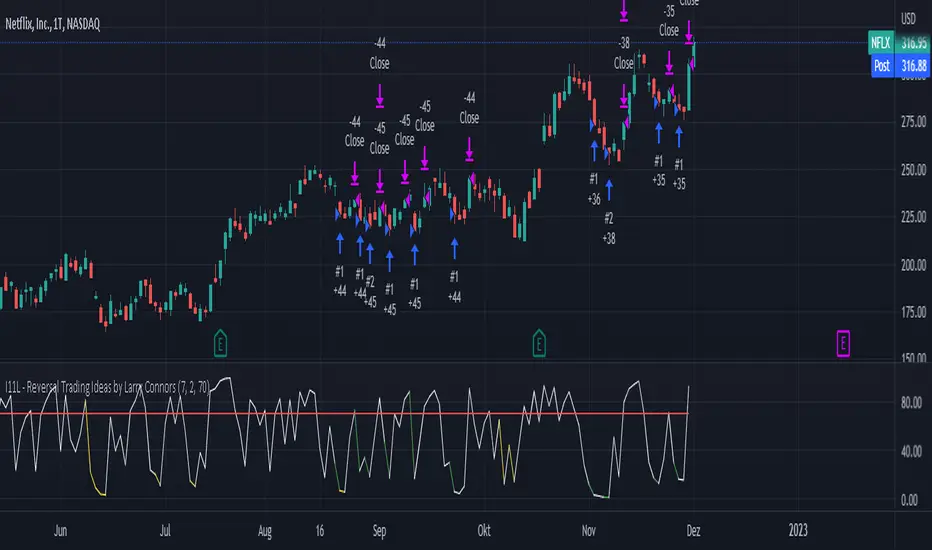
I11L - Reversal Trading Ideas by Larry ConnorsThis is my own Twist on Larry Connors Simple Tradingideas.
It Combines the RSI, Averaging In and the Lowest Bars in a Single System.
The current Configuration is designed for the Daily Timeframe.
Feel free to play with the Parameters and keep in mind that Larry Intended to buy fear and sell the greed!
The Rules are the following:
---Buy---
Buy, if the lowest Bar of your Configuration has been hit (default is set to 7).
---Average Down--
Buy, if the lowest Bar of your Configuration * Your open trades has been hit AND only if the buyin is atleast 1% cheaper.
---Close---
Close, if the RSI closes above a certain level (default is set to 70).
---TP---
There is no TP
---SL---
There is no SL, so be cautions of your tail Risk!
EMA RSI Strategy
Simple strategy
=============
If the last two closes are in ascending order, the rsi is below 50 and ascending, and the current candle is above 200 ema, then LONG. If the last two closes are in descending order, the rsi is above 50 and descending, and the current candle is below 200 ema, then SHORT.
LONG Exit strategy:
ATR: Last 14 day
Lowest: The lowest value of the last 14 candles
Limit points = (Trade Price - Lowest + ATR) * 100000
trail_points : Limit/2
trail_offset = Limit/2
SHORT Exit strategy:
ATR: Last 14 day
Highest: The higher value of the last 14 candles
Limit points = (Trade Price - Highest + ATR) * 100000
trail_points : Limit/2
trail_offset = Limit/2
Backtest results for the AUDUSD pair gave positive results over the last three months.
I am testing this strategy using a python bot in a real environment this week and will update the results at the end of the week.
Disclaimer
This is not financial advice. You should seek independent advice to check how the strategy information relates to your unique circumstances.
We are not liable for any loss caused, whether due to negligence or otherwise arising from the use of, or reliance on, the information provided directly or indirectly by this strategy.

Simple RSI and SMA Long and Short (by Coinrule)The relative strength index ( RSI ) is a momentum indicator used in technical analysis . RSI measures the speed and magnitude of a security's recent price changes to evaluate overvalued or undervalued conditions in the price of that security. The RSI is displayed as an oscillator (a line graph) on a scale of zero to 100. The RSI can do more than point to overbought and oversold securities. It can also indicate securities that may be primed for a trend reversal or corrective pullback in price. It can signal when to buy and sell. Traditionally, an RSI reading of 70 or above indicates an overbought situation. A reading of 30 or below indicates an oversold condition.
A simple moving average ( SMA ) calculates the average of a selected range of prices, usually closing prices, by the number of periods in that range.
The Strategy enters and closes the trade when the following conditions are met:
LONG
SMA100 is greater than SMA150
RSI is greater than 50
SHORT
SMA100 is less than SMA150
RSI is less than 50
When a long position is opened, it remains open until the conditions for a short are met at which point the long position is closed and the short position is opened. Then, when the conditions for the long position are met, the short will be closed and a long will be opened.
This strategy is back tested from 1 January 2022 to simulate how the strategy would work in a bear market. The strategy provides good returns.
The strategy assumes each order is using 30% of the available coins to make the results more realistic and to simulate you only ran this strategy on 30% of your holdings. A trading fee of 0.1% is also taken into account and is aligned to the base fee applied on Binance.

3Commas Bot DCA Backtester & Signals FREEThis is a DCA Strategy backtester + signals, built to emulate the 3Commas DCA bots. It uses your choice of 4 different buy signals, 2 of which can be adjusted in the settings. Everything is customizable so you can backtest specific settings with different buy signals and find the best performing strategy for your risk tolerance and capital. It can be used to backtest strategies on stocks as well, but just make sure your base order is larger than the share price for the entire backtesting range or it will not calculate properly.
You can use this template to code your own buy signals and then backtest them as a DCA strategy if you know some basic pine script.
The indicator shows all of your backtesting orders on the chart. The red line is your take profit level, the blue line is your average price level, the white line is your first order and the green lines are your average down orders. If you enable a stop loss in the settings your stop loss will be shown as an orange line once all of your average down orders have been hit, it will not be set until price has dipped below your covered trading range.
These levels update when things change during backtesting so you can visualize your strategy and how it would perform as well as see if your percentage deviation is large enough to cover dips. When backtesting trades are taken, the chart will show where they were taken(in backtesting) along with info on those trades such as the number each order is, the size of that order and the percentage deviation that order is from the initial buy.
SENDING SIGNALS TO 3COMMAS
Tradingview cannot sync this backtester to 3Commas and with the way alerts are setup for strategies on Tradingview, the best option for you to give signals to your bot would be to use this backtester to figure out what trigger you want to use and then setup that indicator separately to send alerts to your bot. All of the indicators used for signals in this backtester are available for free and can be configured to match this backtester and send alerts to 3Commas for you. Just make sure you set your alerts to once per bar close and don’t use less than a 15 second timeframe because then you could trigger the Tradingview threshold for alerts and get your alerts shut off.
You can also use this backtester with your own buy triggers if you know a little pine script. Just make copy of the script and code in your own buy signals and see how it backtests.
INFO PANEL FOR ANALYZING YOUR STRATEGY
The right hand side of the screen will show an info panel that shows a lot of different information so you can quickly see your bot settings and how it performed right on the screen.
In the top right corner you will see in purple your bot settings. These include your stoploss % if turned on, take profit %, average down order %, average down order % multiplier, volume multiplier, max number of orders allowed and size of your base order.
The top section of the first column “Current Trade” shows these stats: the open trade’s average price, the open trade’s take profit price, the open trade’s PNL, how far price is from your open tarde’s take profit level in percentage, your open position size and number of open orders.
The bottom section of the first column “Overall Performance” shows these stats: total number of trades taken during backtesting range, the largest amount of trades that were open at one time during backtesting, the max drawdown, the average number of bars per trade, gross profit, net profit, percent profit from your initial capital, current portfolio value and your initial capital.
CUSTOMIZABLE OPTIONS TO FIND THE PERFECT STRATEGY
Stoploss On/Off
This will turn your stoploss on or off. By default it is set to off and will not affect anything unless turned on.
Stoploss Percentage
This is the percentage below your final average down order price that will be set as a stoploss to keep your account from going too far in the red on big dips.
Take Profit Percentage - This is the percentage of profit you want the trade to hit before taking profit on your entire DCA trade. This level updates everytime you average down.
Average Down Percentage - This is the percentage that price has to drop from your initial order to initiate your first safety order. If the Average Down Percent Multiplier is set to 1 then this percentage will be the same for every average down order.
Average Down Percentage Multiplier - This multiplies your Average Down Percentage so each safety order needs a larger percentage deviation than the previous one. This keeps your buys closer together at the beginning and further apart when you hit more orders so you can extend your trading range but still be aggressive when price is going sideways.
Volume Multiplier Per New Order - This multiplies the size of each trade based on your base order. If you set it to a 2x multiplier then each average down order will be 2 times the size of the last one. So for example, a $100 base order with a 2x multiplier would have these values for the first 3 average down orders: 200, 400, 800.
Size Of Base Order - This is the size of your first position entry and will be used as a starting point for the volume multiplier. If your base order is $100 then it will buy $100 worth of whatever crypto you are backtesting this on. If you are looking at stock charts, you need to make sure your base order is higher than the share price across the entire backtesting range or it will not perform correctly.
Max Number Of Orders - This is the maximum number of orders the bot can take, including your base order. Adjust this to suit the amount of capital you are willing to allocate to your bot based on how much money it will require to run according to your bot settings.
TIPS ON HOW TO USE FOR BEST RESULTS
If you don’t have a lot of capital to work with, then use longer timeframes with a reasonable take profit percentage so that you don’t need a lot of average down orders. You can also try keeping the volume multiplier close to 1.
You can use the 3Commas dca bot settings page to see how much capital you will need for your strategy if you match it to the settings you have on this indicator. You can also check to see how much of a percentage deviation your bot is covering to make sure you have a reasonable range to trade in and orders to cover big dips. You can also check your coverage by seeing how far down the chart the green lines cover, which are your average down orders.
Make sure the initial capital in the properties tab of the settings has enough to cover all of your orders otherwise you will get unrealistic backtesting results. Also, make sure you leave the order size in the properties tab on contracts so it calculates your trades correctly. The only settings you need to touch in the properties tab is the initial capital. Unless you are trading somewhere that has lower commission fees, then you can change that to match, but leave all the other settings as is for it to function properly.
Increasing the volume multiplier will make your average price and take profit target follow the price action a lot closer as price falls, but it can also lead to having very large orders very quickly once you get into the 1.5-3x multiple range. Try using a high volume multiplier with less safety orders and you will get better results, however you need to have money on the sidelines to add on major dips to keep your bot turning a profit. Be very careful with this as greed and impatience will hurt your overall performance. This bot is meant to make money with lots of small wins so don’t get greedy and make sure you have enough money to cover large dips. If you are being aggressive with your bot, then I recommend only using 25% or less of your portfolio to trade aggressively and then use the smart trade feature on 3commas to add chunks of funds to your trades when price dips below your last safety order. Or if you want it to run without any supervision, then use lower volume multipliers and have lots of safety orders that can cover entire bear markets and still keep buying lower.
It’s a good idea to have some capital on the sidelines that you can add in when price dips quickly. This will help lower your average price and allow your bot to get out in profit quicker. 3Commas bot has a smart trade feature that will allow you to track your average price when adding extra funds and it will automatically update your other orders which is very convenient. Look at the longer timeframes when price dips and only add chunks at major areas where price is very likely to bounce. Or you can be aggressive when trading and add to your position when price dips and is at a likely bounce zone to maximize profits.
Only trade coins that have a good amount of liquidity as the larger your orders get, the harder it will be to sell if there isn’t much liquidity. Also, beware of how large your first order is as it will usually be a market order and can move the market if there is not much liquidity.
Since this bot takes a lot of trades and performs best when taking small profits consistently, you will need to factor in exchange fees. The bot is set to .5% commission(you can change this) on the buy and sell orders as most exchanges charge that amount. Some exchanges offer no fee trading on certain coins so be sure to look around for those so you can keep the commissions and maximize profits.
I strongly encourage you to try out a lot of different setting combinations across multiple different coins and do it across a few months to see how it would have performed under various market conditions. This will help you get a better idea of how much of a percentage deviation you’ll need to be able to cover to keep your bot running and making constant profits. You can also use the deep backtesting feature of the strategy panel to see how it would have done, but just beware that the info panel of the indicator will not reflect deep backtesting results, only the normal backtesting range.
MARKETS
This backtester can be used on any market including crypto, stocks, forex & futures. You just need to make sure your base order is larger than the share price when using this on things besides crypto.
TIMEFRAMES
This backtester can be used on all timeframes.

Catching the Bottom (by Coinrule)This script utilises the RSI and EMA indicators to enter and close the trade.
The relative strength index (RSI) is a momentum indicator used in technical analysis. RSI measures the speed and magnitude of a security's recent price changes to evaluate overvalued or undervalued conditions in the price of that security. The RSI is displayed as an oscillator (a line graph) on a scale of zero to 100. The RSI can do more than point to overbought and oversold securities. It can also indicate securities that may be primed for a trend reversal or corrective pullback in price. It can signal when to buy and sell. Traditionally, an RSI reading of 70 or above indicates an overbought situation. A reading of 30 or below indicates an oversold condition.
An exponential moving average (EMA) is a type of moving average (MA) that places a greater weight and significance on the most recent data points. The exponential moving average is also referred to as the exponentially weighted moving average. An exponentially weighted moving average reacts more significantly to recent price changes than a simple moving average simple moving average (SMA), which applies an equal weight to all observations in the period.
The strategy enters and exits the trade based on the following conditions.
ENTRY
RSI has a decrease of 3.
RSI <40.
EMA100 has crossed above the EMA50.
EXIT
RSI is greater than 65.
EMA9 has crossed above EMA50.
This strategy is back tested from 1 April 2022 to simulate how the strategy would work in a bear market and provides good returns.
Pairs that produce very strong results include ETH on the 5m timeframe, BNB on 5m timeframe, XRP on the 45m timeframe, MATIC on the 30m timeframe and MATIC on the 2H timeframe.
The strategy assumes each order is using 30% of the available coins to make the results more realistic and to simulate you only ran this strategy on 30% of your holdings. A trading fee of 0.1% is also taken into account and is aligned to the base fee applied on Binance.

RSI with Slow and Fast MA Crossing Strategy (by Coinrule)This strategy utilises 3 different conditions that have to be met to buy and 1 condition to sell. This strategy works best on the ETH/USDT pair on the 4-hour timescale.
In order for the strategy to enter the trade, it must meet all of the conditions listed below:
ENTRY
RSI increases by 5
RSI is lower than 70
MA9 crosses above MA50
To exit a trade, the below condition must be met:
EXIT
MA50 crosses above MA9
This strategy works well on LINK/USDT on the 1-day timeframe, MIOTA/USDT on the 2-hour timeframe, BTC/USDT on the 4-hour timeframe, and BEST/USDT on the 1-day timeframe (and 4h).
Back-tested from 1 January 2020.
The strategy assumes each order is using 30% of the available coins to make the results more realistic and to simulate you only ran this strategy on 30% of your holdings. A trading fee of 0.1% is also taken into account and is aligned to the base fee applied on Binance.

Risk Management Strategy TemplateThis strategy is intended to be used as a base template for building new strategies.
It incorporates the following features:
Risk management:
Configurable X% loss per stop loss
Configurable R:R ratio
Trade entry:
Calculated position size based on risk tolerance
Trade exit:
Stop Loss currently configurable ATR multiplier but can be replaced based on strategy
Take Profit calculated from Stop Loss using R:R ratio
Backtesting:
Configurable backtesting range by date
Trade drawings:
TP/SL boxes drawn for all trades. Can be turned on and off
Trade exit information labels. Can be turned on and off
NOTE: Trade drawings will only be applicable when using overlay strategies
Debugging:
Includes section with useful debugging techniques
Strategy conditions
Trade entry:
LONG
C1: Price is above EMA line
C2: RSI is crossing out of oversold area
SHORT
C1: Price is below EMA line
C2: RSI is crossing out of overbought area
Trade exit:
Stop Loss: Stop Loss ATR multiplier is hit
Take Profit: R:R multiplier * Stop Loss is hit
The idea is to use RSI to catch pullbacks within the main trend.
Note that this strategy is intended to be a simple base strategy for building upon. It was not designed to be traded in its current form.

RSI SMA Crossover StrategyOverview
RSI SMA Crossover Strategy works the same way as traditional MA crossover strategies, but using RSI instead of price. When RSI crosses over the SMA, a long position is opened (buy). When RSI crosses under the SMA, the long position is closed (sell).
This strategy can be very effective when the right inputs are used (see below). Be sure to use the backtesting tool to determine the optimal parameters for a given asset/timeframe.
Inputs/Parameters
RSI Length: length for RSI calculation (default = 50)
SMA Length: length for SMA calculation (default = 25)
Strategy Properties
Initial Capital = $1000
No default properties are defined for Slippage, Commission, etc, so be sure to set these values to get accurate backtesting results. This script is being published open-source for a reason - save yourself a copy and adjust the settings as you like!
Backtesting Results
Testing on Bitcoin (all time index) 1D chart, with all default parameters.
$1,000 initial investment on 10/07/2010 turns into almost $2.5 billion as of 08/30/2022 (compared to $334 million if the initial investment was held over the same period)
Remember, results can vary greatly based on the variables mentioned above, so always be sure to backtest.
