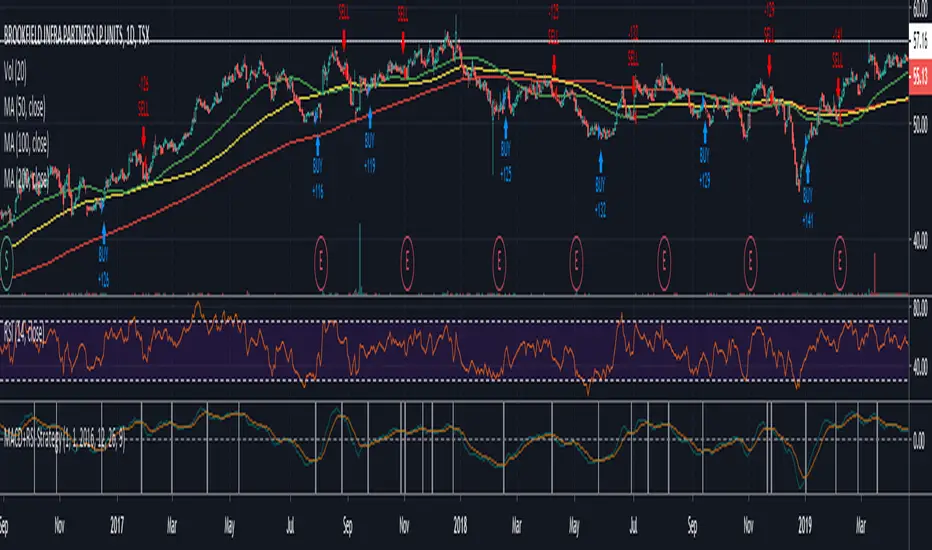
MACD_RSI strategyUse three indicator to entry a position
EMA (20), MACD (12, 26, 20), RSI (14)
apply ema20 on rsi as signal line
Entry long when
price above EMA20, MACD above signal line and RSI above signal line
Entry short when
price below EMA20, MACD below signal line and RSI below signal line
Study only, use it under your own risk.
相對強弱指標(RSI)

MA 12, MA 24, RSI OB-OS, CCI by WP@SITechDeveloped by Worachart Pirunruk, MD - Siam Intelligence Technology
This is the signal that generates based on 4 Technical Analysis Tools:
1. SMA 12,
2. SMA 26,
3. RSI 14,3,3
4. CCI
Signal to Buy/Long when the RSI below Dynamic oversold line based on close price back 60 bars.
Parameter. This signal doesn't have to best TP point, I'm working on improvement, now. Btw, don't forget to calculate you Margin Level. I'll teach you guys later of how to calculate.
Have fun Trading guys, and don't forget to give back to others. Because, Giving is Receiving."
WP@SITech


Simple EMA_Hull_RSI StrategyAnother simple strategy. Crossing EMA & Hull MA and the level of RSI (overbought/oversold) defines long or short.
Can be improved by varying the parameters and adding take profit / stop loss.
Backtest: ETHUSD (Bitmex): 5m

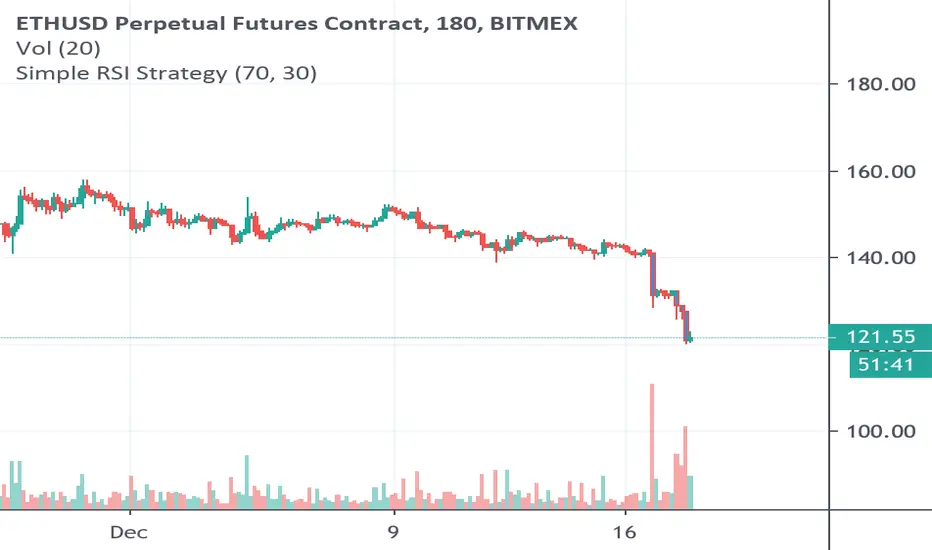
Simple RSI Strategy Buy/Sell at a certain levelSimple Strategy based on RSI, using overbought or oversold levels, defined by us, sell or buy an asset.
Backtest: ETHUSD (Bitmex) - 3h
Ichimoku Kinko Hyo Cloud - no offset - no repaint - strategyIchimoku Kinko Hyo Cloud - no offset - no repaint - RSI filter - strategy
The indicator contains both the standard Ichimoku Cloud , as well as the one without the visual offset.
The Strategy Tester indicates good backtest results when the Ichimoku Cloud is paired with the RSI .
However, it seems it likes to work more as a standalone system.
The indicator can be easily converted to the study() mode by commenting/uncommenting a few lines,
then the alarms can be configured.
There are entry and exit signals ready to be used by the alert system.
The coloring of the cloud without offset contains all 3 conditions: Uptrend , Downtrend , Transition .

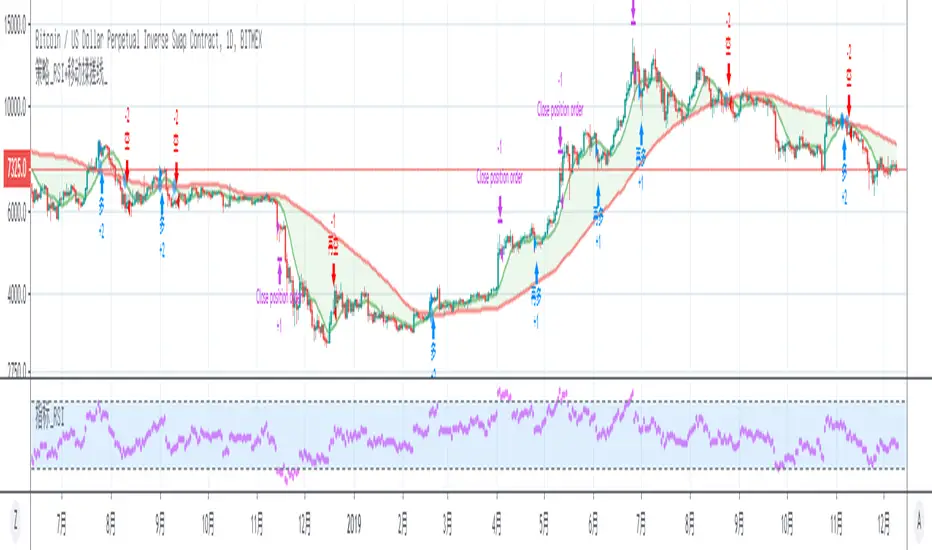
SMA_Cross + RSI1. long
a. RSI does not open an order when it is overbought, until the RSI falls below a certain threshold, and then open a position
b. There are already many positions. If the RSI is overbought, it will be profitable. When the RSI falls below a certain threshold, open a long position again until the moving average crossover signal turns short.
2. Short
a. RSI does not open an order when it is oversold, and then opens a position after RSI rises to a certain threshold
b. There are already short positions. If the RSI is oversold, it will be profitable to close the short position. When the RSI rises above a certain threshold, open the short position again until there is a reversal of the moving average crossing signal.
1. 做多
a. RSI在超买区间时不开单,直到RSI回落到某个阈值之下,再开仓
b. 已经有多仓,如果RSI超买,则平多获利,当RSI回落到某个阈值之下后,再次开多,直到有均线交叉信号反转做空
2. 做空
a. RSI在超卖区间时不开单,直到RSI上升到某个阈值之后,再开仓
b. 已经有空仓,如果RSI超卖,则平空获利,当RSI上升到某个阈值之上后,再次开空,直到有均线交叉信号反转做多
ANN RSI SUPER TREND STRATEGY BY che_traderCreate a strategy for the good indicator created by @RafaelZioni
Which is composed of ANN data taken from
and the super trend shared by www.tradingview.com
Feel free to share and copy this script!
Enjoy!

VRSI-MARSI StrategyI wanted to create an indicator which resembles price movement, aside to volume movement.
The "yellow-blue" line is the MA(5) of the RSI (9) of closing price.
The "orange" line is the MA(5) of the RSI (9) of Volume .
(Default plot of RSI and VRSI is not visible but can be made visible ("Settings" > "Style" > set "Opacity" of "RSI & VRSI"))
The Long (Buy) condition is triggered when the MA(5) of the RSI (9, close) goes up.
The Short (Sell) condition is triggered when the MA(5) of the RSI (9, close) goes down.
Comparing the price movement with the "orange" Volume line helps to spot a possible trend change,
for example when price goes up and an ascending Volume line starts to flatten or starts descending,
this could be a sign that the Bullish trend is weakening, predicting a possible trend change.
Or, when for example a downwards price movement is accompanied with a rising Volume line, this can be a sign of large Bearish power.
Because it still is a RSI indicator, the midline (50), and Oversold/Overbought area's (20-30 & 70-80) are important to watch, especially the MARSI!
A second strategy is made (VRSI-MARSI Strategy 2) where the Long/Short condition is triggered when "MA RSI (close) - MA RSI ( Volume )" crosses.
-------------------------------------------------------------------------------------------------------------------------------------------------------------------------
The Long & Short entries, as well as the Entry Close are visible 1 bar after the trigger.
When the blue line changes in a yellow line (and vice versa) it will show a candle earlier (see yellow dashed lines = (1)).
Also, the condition is fulfilled when the candle closes (2), but the order doesn't take place in the same bar, but the next (3).
Because this is a strategy the "actual Order" will not take place at the "Close" of the candle (2), but at the "Open" at the NEXT candle (3).
I also have this strategy as a study (A+B), where the "Buy" & "Sell" shows a candle earlier.
-------------------------------------------------------------------------------------------------------------------------------------------------------------------------
The entries are default 5% of equity, without pyramiding, which already gives large profits.
A large part of the profit is because of the Entry Close of the Long & Short entries.
You can easily turn these off (Settings > Inputs) to see what profit the strategy gives without Entry Close.
Here they are disabled:
-------------------------------------------------------------------------------------------------------------------------------------------------------------------------
More information available in the script ;-)

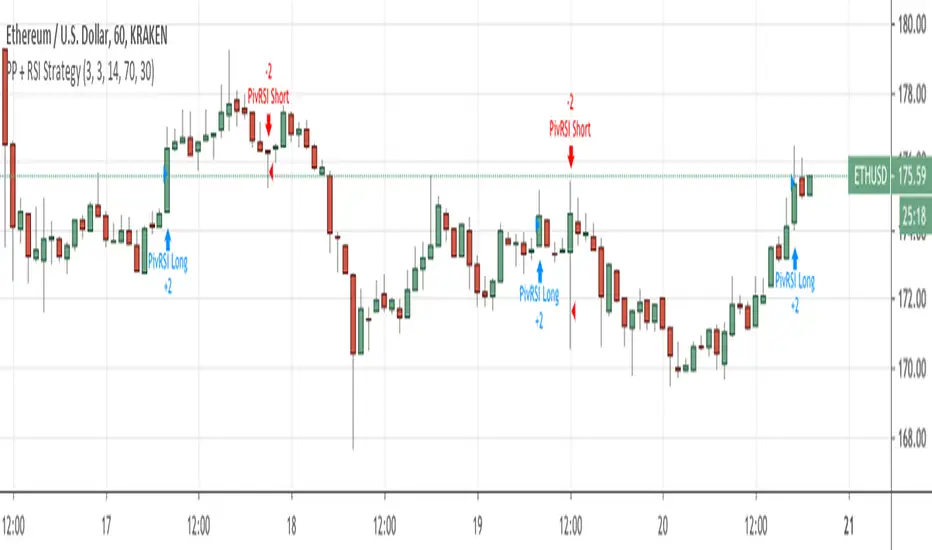
Pivot Point Reversal + RSI StrategyThis strategy joins the Pivot Reversal strategy with the RSI indicator.
We check RSI level at the pivot point level and only if RSI condition is satisfied we update levels for stop orders.
The strategy works pretty good for crypto, 30m, 1h, 2h timeframes.
Easy to Use Stochastic + RSI StrategyA simple strategy that yields some great results.
CODE VARIABLES
LINE 2 - Here you can change your currency and amount you want to invest on each entry.
LINE 10/11/12 - Here we establish what date we want to start backtesting from. Simply change the defval on each line to change the date (In the code below we start on Jan 1st, 2014).
LINES 19 through 27 - Here we set our Stochastic and RSI sensitivity (Currently %K = 14, %D = 3, RSI = 14). Change these to your preference.
LINE 39/41 - Here we execute our orders (Currently set when %K crosses %D under the 20 value and RSI is less than 50 to BUY, %K crosses %D above the 80 value and RSI is greater than 60 to SELL). Change these to your preference.
NOTE: As a beginner you may not want to short stock, therefore LINE 6 was added to only allow long positions.
I didn't overlay the RSI value over the Stochastics because it was too cluttered. Just add the RSI indictor seperately to your layout.
As always, couple this with trend following and exit/entry rules to make the profitability even higher!
Cheers!


Easy to Use MACD+RSI Strategy
BEGINNERS REJOICE!
Easy to use strategy test using MACD with RSI as a confirming indicator. The code is structured to make it easy to manipulate the variables to your choosing.
EASY TO CHANGE CODE VARIABLES
LINE 2 = Change the amount you invest every trade and the currency
LINE 8/9/10 = Change the defval of each of these lines to backtest from a certain date
LINE 16/17/18 = Change the MACD sensitivity by changing the defval on each line
LINE 21 = Change the value after close toadjust the sensitivity of the RSI
LINE 37/39 = Change/remove the < and > variables for macdLine and rsivalue after the crossover/crossunder to adjust your buying point further.
As a beginner you may not feel comfortable with shorting stocks, therefore LINE 5 was added to only allows long positions.
Funny how a simple indicator can return such a high profitability. Couple this with some trend/exit strategies and you'll have something really special!
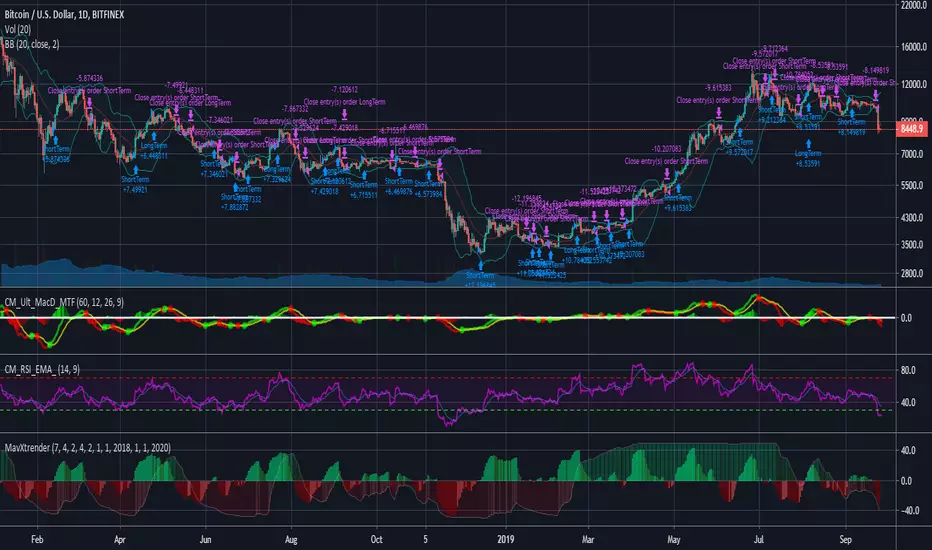
REAL STRATEGY : Dow_Factor_MFI/RSI_DVOG_StrategyI'm actually one of those who think it's more important to extract clues from indicators than strategy, but I wanted to test the data about the probability and dow factor I've shared for a long time.
Usually, Bitcoin is used as an eye stain for strategy success, since the graph has increased significantly from the beginning.
To prevent this, I used a commission and in the last lines of document I shared Bitmex's Bitcoin and Ethereum 1W test results.
I don't think there's a factor to repaint. ( Warn me if u see or observe )
I considered Bitcoin because I found working with liquid parities much more realistic.
Ethereum and Bitmex have been featured as a spot and may soon find a place at the CME , so I've evaluated the Ethereum .
But since the Ethereum Bitmex was also spot new, I deleted results that were less than 10 closed trades.
Since the Dow Theory also looks at the harmony in the indices, just try it in the Cryptocurrency market.
Use as indicator in other markets. Support with channels, trend lines with big periods and other supportive indicators.
And my personal suggestion : Use this script and indicator TF : 4H and above.
Specifications :
Commission. ( % 0.125 )
Switchable Methods ( Relative Strength Index / Money Flow Index )
Alarms. (Buy / Sell )
Position closure when horizontal market rates weighs.
Progressive gradual buy/sell alarms.
Clean code layout that will not cause repaint. (Caution : source = close )
Switchable barcolor option (I / 0 )
*****Test results :*****
drive.google.com
Summary:
It was a realistic test.
It has achieved great success in some markets, but as I mentioned earlier, use it only to gain insight into the price movements of cryptos.
Use as indicator in other markets.
This code is open source under the MIT license. If you have any improvements or corrections to suggest, please send me a pull request via the github repository : github.com
Stay tuned ! Noldo.

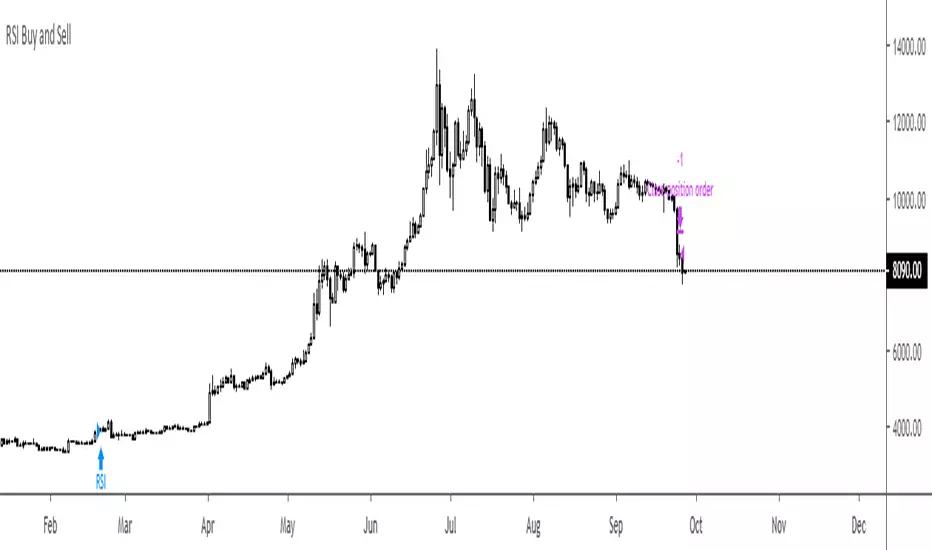
RSI Buy and SellThis is sooooooooo simple.
Buy when RSI is above 70 and don't sell til it'sunder 30.
BTC Daily Strategy BFStrategy based on code by @CredibleHulk so thanks for that.
This is a strategy for the Daily Bitcoin chart which uses the MACD, RSI, Stochastic RSI and a moving average.
The conditions for long or short signals depend on the indicators above crossing user-defined thresholds.
Long signal = (Stochastic RSI k value is below Stochastic Sell Threshold) AND EITHER (MACD delta crosses above MACD Threshold OR RSI crosses above RSI Threshold)
Short signal = (MACD delta crosses below 0) AND EITHER (Close Price - an SMA of the ohlc4 values crosses below the DMA threshold OR Stochastic RSI k value is above Stochastic Sell Threshold)
INSTRUCTIONS
Green background = go long
Red background = go short
You can adjust stop loss values for long or short signals in settings as well as all parameters for the indicators.

MavXtrenderConverted the B-Xtrender script from Puppytherapy into a strategy script.
B-Xtrender was created by Bharat Jhunjhunwal and published in this IFTA Journal .
I've added the following features:
Ability to use factors instead of individual values for each parameter. This will allow you to quickly check different averages (5 vs 7 for example).
Defaults adjusted for crypto trading (7 days/week).
Switches to use either the short or long term indicator, or both.
Time window
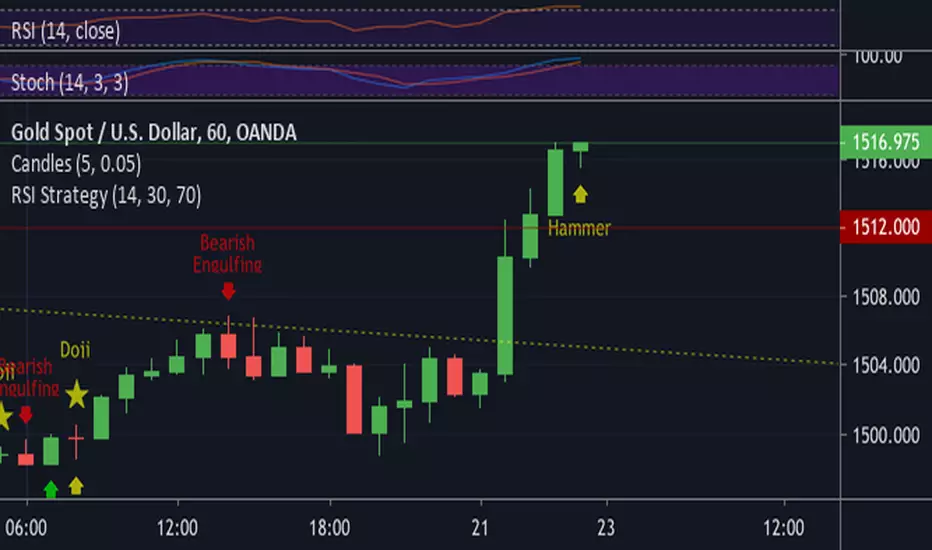
RSI StrategyNothing special in this strategy its just purely and application of RSI in 1hour chart of XAUUSD.
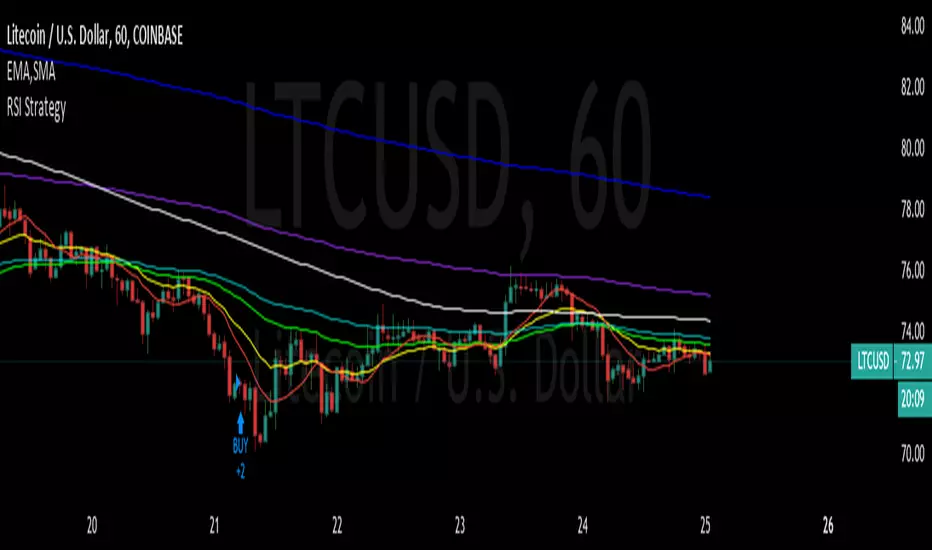
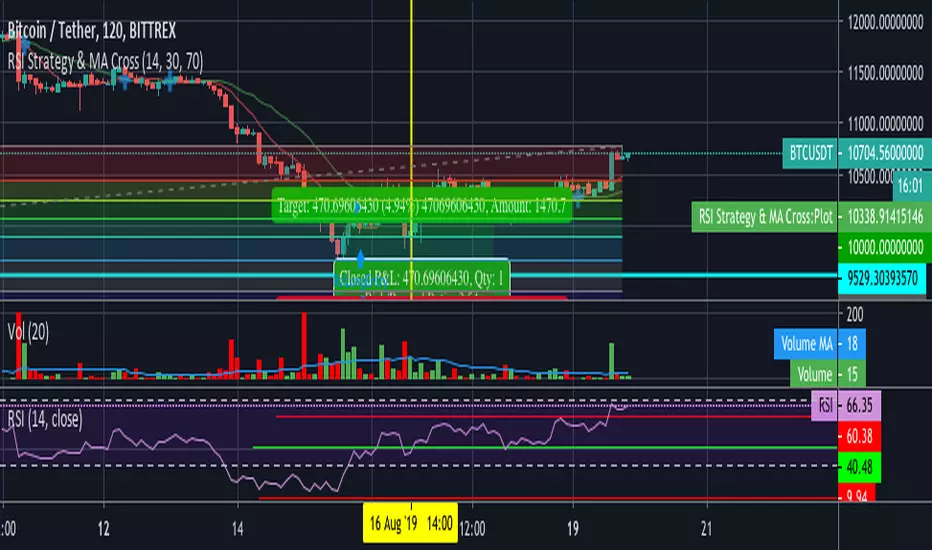
RSI Strategy & MA CrossCombination of two strategy.
MA Cross strategy is using 2 sma at 9 & 21. It can be configured through the source code.
RSI strategy to decide whether the stock/crypto is currently overbought/oversold.
Useful for quick entry and exit trade.
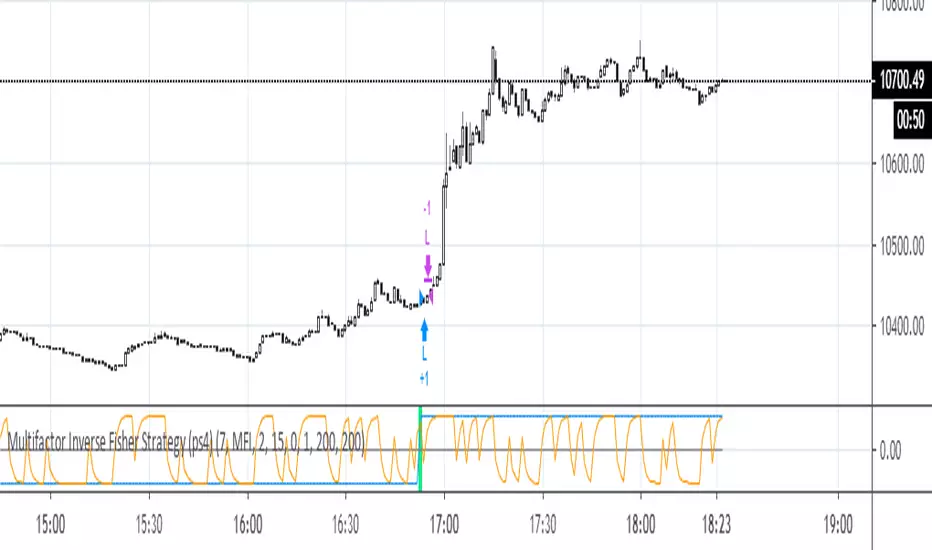
Multifactor Inverse Fisher Strategy (ps4)Best for higher time frames - 30m, 1H, 2H, 3H, 4H, D this strategy uses several factors that are pushed through an Inverse Fisher Transform (IFT). The higher the TF, the better the performance, up to 98%, but the number of deals tends to drop). Middle time frames (5m, 15m) look viable with Scaled Price (Scaled %P) and MFI factors. The factor list can be extended to include cci, stoch, rsi_stoch, emo, macd, cog, dpo, roc, accdist, cctbb, mom, awesome, tva, etc. Some of them need to be rescaled to a 0..100 interval. The IFT produces a value in the -1..1 interval (see: www.mesasoftware.com). This indicator does NOT repaint.
2-Period RSI strategy (with filter)2-period RSI strategy backtest described in several books of the trader Larry Connors . This strategy uses a 2 periods RSI , one slow arithmetic moving average and one fast arithmetic moving average.
Entry signal:
- RSI 2 value below oversold level (Larry Connors usually sets oversold to be below 5, but other authors prefer to work below 10 due to the higher number of signals).
- Closing above the slow average (200 periods).
- Entry at closing of candle or opening of next candle.
Exit signal:
- Occurs when the candlestick closes above the fast average (the most common fast average is 5 periods, but some traders also suggest the 10 period average).
Entry Filter (modification made by me):
- Applied an RSI2 arithmetic moving average to smooth out oscillations.
- Entered only when RSI2 is below oversold level and RSI2 moving average is below 30.
* NOTE: In the stocks that I evaluate daily the averages of 4 and 6 periods work very well as a filter.
Comments:
This strategy works very well in Daily charts but can be applied in other chart times as well. As this is a strategy to catch market fluctuations, it presents different results with different stocks.
I have been applying this strategy to the stocks of the Brazilian market (BOVESPA) and have enjoyed the result. Every day I evaluate the stocks that are generating entry signals and choose which one to trade based on the stocks with the highest Profit Value.
The RSI 2 averaging filter probably will reduce profit of the backtests because reduces the number of signals, but the Profit Value will usually increase. For me this was a good thing because without the filter, this strategy usually shows more signals than I have capital to allocate.
Before entering a trade I look at which fast average the paper has the highest Profit Value and then I use this average as my output signal for that trade (this change has greatly improved the result of the outputs).
This strategy does not use Stop Loss because normally Stop Loss decreases effectiveness (profit). In any case, the option to apply a percentage Stop Loss if desired is added in the script. As the strategy does not use stop, extra caution with risk management is advisable. I advise not to allocate more than 20% of the trade capital in the same operation.
I'm still studying ways to improve this strategy, but so far this is the best setup I've found. Suggestions are always welcome and we can test to see if they improve the backtest result.
Good luck and good trades.
================================================
Backtest das estratégia do IFR de 2 períodos descrita em varios livros do trader Larry Connors . Esta estratégia usa um IFR de 2 períodos, uma média movel aritmética lenta e uma média movel aritmética rápida.
Sinal de entrada:
- Valor do IFR 2 abaixo do nível de sobrevenda (Larry Connors usualmente define sobrevenda sendo abaixo de 5, mas outros autores preferem trabalhar abaixo de 10 devido ao maior número de sinais).
- Fechamento acima da média lenta (200 períodos).
- Realizado a compra no fechamento do candle ou na abertura do candle seguinte.
Sinal de saída:
- Ocorre quando o candle fecha acima da média rápida (a média rápida mais comum é a de 5 períodos, mas alguns traders sugerem também a média de 10 períodos).
Filtro para entrada (modificação feita por mim):
- Aplicado uma média móvel aritmética do IFR2 para suavisar as oscilações.
- Realizado a entrada apenas quando o IFR2 está abaixo do nível de sobrevenda e a média móvel do IFR2 está abaixo de 30.
*OBS: nos ativos que avalio diariamente as médias de 4 e 6 períodos funcionam muito bem como filtro.
Comentários:
Esta estratégia funciona muito bem no tempo gráfico Diário mas pode ser aplicada tambem em outros tempos gráficos. Como trata-se de uma estratégia para pegar oscilações do mercado, ela apresenta diferentes resultados com diferentes ativos.
Eu venho aplicando esta estratégia nos ativos do mercado brasileiro (BOVESPA) e tenho gostado do resultado. Diariamente eu avalio os papeis que estão gerando entrada e escolho qual irei realizar o trade baseado nos papeis que apresentam maior Profit Value.
O filtro da média do IFR 2 reduz o lucro nos backtests pois reduz também a quantidade de sinais, mas em compensação o Profit Value irá normalmente aumentar. Para mim isto foi algo positivo pois, sem o filtro, normalmente esta estratégia apresenta mais sinais do que possuo capital para alocar.
Antes de entrar em um trade eu olho em qual média rápida o papel apresenta maior Profit Value e então eu utilizo está média como meu sinal de saída para aquele trade (esta mudança tem melhorado bastante o resultado das saídas).
Está estratégia não utiliza Stop Loss pois normalmente o Stop Loss diminui a eficácia (lucro). De qualquer maneira, foi acrescentado no script a opção de aplicar um Stop Loss percentual caso seja desejado. Como a estratégia não utiliza stop é aconselhável um cuidado redobrado com o gerenciamento de risco. Eu aconselho não alocar mais de 20% do capital de trade em uma mesma operação.
Ainda estou estudando formas de melhorar esta estratégia, mas até o momento está é a melhor configuração que encontrei. Sugestões são sempre bem vindas e podemos testar para verificar se melhoram o resultado do backtest.
Boa sorte e bons trades.

Strategy JMA(7,50,RSI) crossing RSI(14,close)Hello, i would like to submit a script dealing with Jurik Moving Average Crossing RSI . Also to avoid false positive, i made a test with long/short positions and entry/closing prices but unfortunately it's not working. I may be too noob to Pine.
If you have some ideas to refactor / improve / make this section works:
// ======= DEBUGGGGGGGG ============
long_price = 0.0
short_price = 0.0
if(startTime and endTime)
if(goLong())
long_price := close
strategy.entry("Buy", strategy.long, when = goLong())
strategy.close("Buy", when = killLong() and close > long_price)
// Shorting if using
goShort() => killLong()
killShort() => goLong()
if(startTime and endTime)
if(goShort())
short_price := close
strategy.entry("Sell", strategy.short, when = goShort() and close < short_price)
strategy.close("Sell", when = killShort())
// =========================
Thanks,
