Universal Renko Bars by SiddWolfUniversal Renko Bars or UniRenko Bars is an overlay indicator that applies the logic of Renko charting directly onto a standard candlestick chart. It generates a sequence of price-driven bricks, where each new brick is formed only when the price moves a specific amount, regardless of time. This provides a clean, price-action-focused visualization of the market's trend.
WHAT IS UNIVERSAL RENKO BARS?
For years, traders have faced a stark choice: the clean, noise-free world of Renko charts, or the rich, time-based context of Candlesticks. Choosing Renko meant giving up your favorite moving averages, volume profiles, and the fundamental sense of time. Choosing Candlesticks meant enduring the market noise that often clouds true price action.
But what if you didn't have to choose?
Universal Renko Bars is a revolutionary indicator that ends this dilemma. It's not just another charting tool; it's a powerful synthesis that overlays the pure, price-driven logic of Renko bricks directly onto your standard candlestick chart. This hybrid approach gives you the best of both worlds:
❖ The Clarity of Renko: By filtering out the insignificant noise of time, Universal Renko reveals the underlying trend with unparalleled clarity. Up trends are clean successions of green bricks; down trends are clear red bricks. No more guesswork.
❖ The Context of Candlesticks: Because the Renko logic is an overlay, you retain your time axis, your volume data, and full compatibility with every other time-based indicator in your arsenal (RSI, MACD, Moving Averages, etc.).
The true magic, however, lies in its live, Unconfirmed Renko brick. This semi-transparent box is your window into the current bar's real-time struggle. It grows, shrinks, and changes color with every tick, showing you exactly how close the price is to confirming the trend or forcing a reversal. It’s no longer a lagging indicator; it’s a live look at the current battle between buyers and sellers.
Universal Renko Bars unifies these two powerful charting methods, transforming your chart into a more intelligent, noise-free, and predictive analytical canvas.
HOW TO USE
To get the most out of Universal Renko Bars, here are a few tips and a full breakdown of the settings.
Initial Setup for the Best Experience
For the cleanest possible view, it's highly recommended that you hide the body of your standard candlesticks, that shows only the skelton of the candle. This allows the Renko bricks to become the primary focus of your chart.
→ Double click on the candles and uncheck the body checkbox.
Settings Breakdown
The indicator is designed to be powerful yet intuitive. The settings are grouped to make customization easy.
First, What is a "Tick"?
Before we dive in, it's important to understand the concept of a "Tick." In Universal Renko, a Tick is not the same as a market tick. It's a fundamental unit of price movement that you define. For example, if you set the Tick Size to $0.50, then a price move of $1.00 is equal to 2 Ticks. This is the core building block for all Renko bricks. Tick size here is dynamically determined by the settings provided in the indicator.
❖ Calculation Method (The "Tick Size" Engine)
This section determines the monetary value of a single "Tick."
`Calculation Method` : Choose your preferred engine for defining the Tick Size.
`ATR Based` (Default): The Tick Size becomes dynamic, based on market volatility (Average True Range). Bricks will get larger in volatile markets and smaller in quiet ones. Use the `ATR 14 Multiplier` to control the sensitivity.
`Percentage` : The Tick Size is a simple percentage of the current asset price, controlled by the `Percent Size (%)` input.
`Auto` : The "set it and forget it" mode. The script intelligently calculates a Tick Size based on the asset's price. Use the `Auto Sensitivity` slider to make these automatically calculated bricks thicker (value > 1.0) or thinner (value < 1.0).
❖ Parameters (The Core Renko Engine)
This group controls how the bricks are constructed based on the Tick Size.
`Tick Trend` : The number of "Ticks" the price must move in the same direction to print a new continuation brick. A smaller value means bricks form more easily.
`Tick Reversal` : The number of "Ticks" the price must move in the opposite direction to print a new reversal brick. This is typically set higher than `Tick Trend` (e.g., double) to filter out minor pullbacks and market noise.
`Open Offset` : Controls the visual overlap of the bricks. A value of `0` creates gapless bricks that start where the last one ended. A value of `2` (with a `Tick Reversal` of 4) creates the classic 50% overlap look.
❖ Visuals (Controlling What You See)
This is where you tailor the chart to your visual preference.
`Show Confirmed Renko` : Toggles the solid-colored, historical bricks. These are finalized and will never change. They represent the confirmed past trend.
`Show Unconfirmed Renko` : This is the most powerful visual feature. It toggles the live, semi-transparent box that represents the developing brick. It shows you exactly where the price is right now in relation to the levels needed to form the next brick.
`Show Max/Min Levels` : Toggles the horizontal "finish lines" on your chart. The green line is the price target for a bullish brick, and the red line is the target for a bearish brick. These are excellent for spotting breakouts.
`Show Info Label` : Toggles the on-chart label that provides key real-time stats:
🧱 Bricks: The total count of confirmed bricks.
⏳ Live: How many chart bars the current live brick has been forming. These bars forms the Renko bricks that aren't confirmed yet. Live = 0 means the latest renko brick is confirmed.
🌲 Tick Size: The current calculated value of a single Tick.
Hover over the label for a tooltip with live RSI(14), MFI(14), and CCI(20) data for additional confirmation.
TRADING STRATEGIES & IDEAS
Universal Renko Bars isn't just a visual tool; it's a foundation for building robust trading strategies.
Trend Confirmation: The primary use is to instantly identify the trend. A series of green bricks indicates a strong uptrend; a series of red bricks indicates a strong downtrend. Use this to filter out trades that go against the primary momentum.
Reversal Spotting: Pay close attention to the Unconfirmed Brick . When a strong trend is in place and the live brick starts to fight against it—changing color and growing larger—it can be an early warning that a reversal is imminent. Wait for the brick to be confirmed for a higher probability entry.
Breakout Trading: The `Max/Min Levels` are your dynamic breakout zones. A long entry can be considered when the price breaks and closes above the green Max Level, confirming a new bullish brick. A short entry can be taken when price breaks below the red Min Level.
Confluence & Indicator Synergy: This is where Universal Renko truly shines. Overlay a moving average (e.g., 20 EMA). Only take long trades when the green bricks are forming above the EMA. Combine it with RSI or MACD; a bearish reversal brick forming while the RSI shows bearish divergence is a very powerful signal.
A FINAL WORD
Universal Renko Bars was designed to solve a fundamental problem in technical analysis. It brings together the best elements of two powerful methodologies to give you a clearer, more actionable view of the market. By filtering noise while retaining context, it empowers you to make decisions with greater confidence.
Add Universal Renko Bars to your chart today and elevate your analysis. We welcome your feedback and suggestions for future updates!
Follow me to get notified when I publish New Indicator.
~ SiddWolf
Renkochart

MestreDoFOMO RENKO Sushy System v6🔍 What is this script?
The MestreDoFOMO RENKO Sushy System is a visual tool developed to help traders better interpret the market trend based on a Renko logic adapted to traditional candlestick charts.
It does not use TradingView's native Renko chart, but rather a simulation of Renko behavior, calculated dynamically in real time, adapting to the percentage movement of the price.
🧠 How does it work?
The script uses a Renko simulation with an adjustable percentage base (Renko Size), allowing the trader to define the size of the virtual "blocks" or "bricks" in % of the price. This logic creates a dynamic trend line that changes direction only when there is a sufficient variation in the price — filtering out noise and helping to focus on the prevailing direction.
When a change in direction occurs, a visual signal is displayed on the chart:
💲 Buy signal, when the trend changes from bearish to bullish
👹 Sell signal, when the trend changes from bullish to bearish
These signals are not automatic trading alerts, but rather visual periodic signals based on the internal logic of the system.
📈 Why do we include EMAs (20, 50 and 200)?
Exponential moving averages (EMAs) are widely used in technical analysis as supporting tools for understanding market structure:
EMA 20: A short-term indicator, useful for capturing recent movements.
EMA 50: Considered an interactive trend average, often used as dynamic support/resistance.
EMA 200: A long-term reference, often used to identify the "bigger direction" of the market.
EMAs are indicated in the script and can be enabled or disabled according to the user's preference. They are not part of the signal logic — they serve only as visual and contextual support to assist the trader's manual analysis.
📋 Included features
✅ Renko logic adapted to the candlestick chart, with sensitivity control in %
✅ Trend line based on the current Renko direction
✅ Visual signals of trend change (buy/sell)
✅ Option to enable/disable EMAs 20, 50 and 200
✅ Information panel with trend status, EMA values and current parameters
✅ Customizable trend change alerts
✅ Background color to strengthen the direction (green = high, red = low)
🛠 How to use?
Choose the timeframe: Works best on timeframes longer than 1 hour (e.g. 1H, 4H, Daily).
Adjust the Renko size (%): Try starting with 1% and adjusting according to the asset (crypto, forex, etc.).
Decide whether to use EMAs: Only activate if you want additional context.
Observe the signals and the trend line: They are useful for detecting possible reversals or confirmations of movement.
Combine with other elements: This system is a support tool. For best results, use it in conjunction with price action, liquidity zones or other complementary indicators.
⚠️ Important notice
This script does not execute orders or make automatic decisions. It is an educational and visual tool created to help read the trend in a clean and simple way.
No guarantee of past or future performance is provided. Use is at the sole risk of the user.

Non-Repainting Renko Emulation Strategy [PineIndicators]Introduction: The Repainting Problem in Renko Strategies
Renko charts are widely used in technical analysis for their ability to filter out market noise and emphasize price trends. Unlike traditional candlestick charts, which are based on fixed time intervals, Renko charts construct bricks only when price moves by a predefined amount. This makes them useful for trend identification while reducing small fluctuations.
However, Renko-based trading strategies often fail in live trading due to a fundamental issue: repainting .
Why Do Renko Strategies Repaint?
Most trading platforms, including TradingView, generate Renko charts retrospectively based on historical price data. This leads to the following issues:
Renko bricks can change or disappear when new data arrives.
Backtesting results do not reflect real market conditions. Strategies may appear highly profitable in backtests because historical data is recalculated with hindsight.
Live trading produces different results than backtesting. Traders cannot know in advance whether a new Renko brick will form until price moves far enough.
Objective of the Renko Emulator
This script simulates Renko behavior on a standard time-based chart without repainting. Instead of using TradingView’s built-in Renko charting, which recalculates past bricks, this approach ensures that once a Renko brick is formed, it remains unchanged .
Key benefits:
No past bricks are recalculated or removed.
Trading strategies can execute reliably without false signals.
Renko-based logic can be applied on a time-based chart.
How the Renko Emulator Works
1. Parameter Configuration & Initialization
The script defines key user inputs and variables:
brickSize : Defines the Renko brick size in price points, adjustable by the user.
renkoPrice : Stores the closing price of the last completed Renko brick.
prevRenkoPrice : Stores the price level of the previous Renko brick.
brickDir : Tracks the direction of Renko bricks (1 = up, -1 = down).
newBrick : A boolean flag that indicates whether a new Renko brick has been formed.
brickStart : Stores the bar index at which the current Renko brick started.
2. Identifying Renko Brick Formation Without Repainting
To ensure that the strategy does not repaint, Renko calculations are performed only on confirmed bars.
The script calculates the difference between the current price and the last Renko brick level.
If the absolute price difference meets or exceeds the brick size, a new Renko brick is formed.
The new Renko price level is updated based on the number of bricks that would fit within the price movement.
The direction (brickDir) is updated , and a flag ( newBrick ) is set to indicate that a new brick has been formed.
3. Visualizing Renko Bricks on a Time-Based Chart
Since TradingView does not support live Renko charts without repainting, the script uses graphical elements to draw Renko-style bricks on a standard chart.
Each time a new Renko brick forms, a colored rectangle (box) is drawn:
Green boxes → Represent bullish Renko bricks.
Red boxes → Represent bearish Renko bricks.
This allows traders to see Renko-like formations on a time-based chart, while ensuring that past bricks do not change.
Trading Strategy Implementation
Since the Renko emulator provides a stable price structure, it is possible to apply a consistent trading strategy that would otherwise fail on a traditional Renko chart.
1. Entry Conditions
A long trade is entered when:
The previous Renko brick was bearish .
The new Renko brick confirms an upward trend .
There is no existing long position .
A short trade is entered when:
The previous Renko brick was bullish .
The new Renko brick confirms a downward trend .
There is no existing short position .
2. Exit Conditions
Trades are closed when a trend reversal is detected:
Long trades are closed when a new bearish brick forms.
Short trades are closed when a new bullish brick forms.
Key Characteristics of This Approach
1. No Historical Recalculation
Once a Renko brick forms, it remains fixed and does not change.
Past price action does not shift based on future data.
2. Trading Strategies Operate Consistently
Since the Renko structure is stable, strategies can execute without unexpected changes in signals.
Live trading results align more closely with backtesting performance.
3. Allows Renko Analysis Without Switching Chart Types
Traders can apply Renko logic without leaving a standard time-based chart.
This enables integration with indicators that normally cannot be used on traditional Renko charts.
Considerations When Using This Strategy
Trade execution may be delayed compared to standard Renko charts. Since new bricks are only confirmed on closed bars, entries may occur slightly later.
Brick size selection is important. A smaller brickSize results in more frequent trades, while a larger brickSize reduces signals.
Conclusion
This Renko Emulation Strategy provides a method for using Renko-based trading strategies on a time-based chart without repainting. By ensuring that bricks do not change once formed, it allows traders to use stable Renko logic while avoiding the issues associated with traditional Renko charts.
This approach enables accurate backtesting and reliable live execution, making it suitable for trend-following and swing trading strategies that rely on Renko price action.

HKM - Renko Emulator with EMA TrendThis is a Renko based Emulator to plot on any chart type which prints the box as printed on a Renko charts and is a Non-Repaint version. You can use either Traditional or ATR Method on current chart Timeframe. Option to plot an EMA Line is provided with Trend indication.

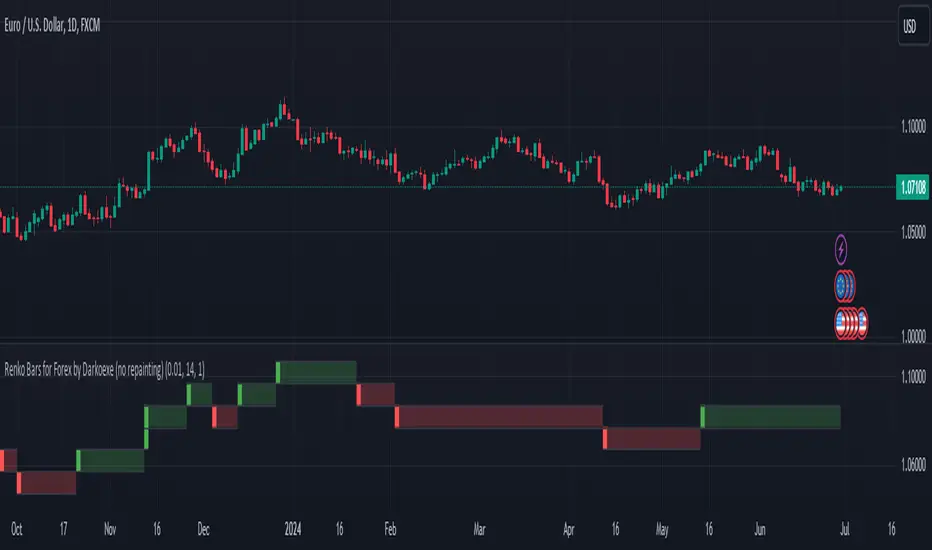
Renko Bars for Forex by Darkoexe (no repainting)This indicator achieves plotting Renko bars with no repainting by resetting the open of the first Renko bar every market open after the FOREX market close. The indicator displays Renko bars for a timeframe chart which means multiple Renko bars can appear in the same timeframe as a single chart candle. This is because Renko bars aren't time bound, they are formed based on price movement. Whenever multiple Renko bars would appear in the timeframe of a single chart candle, the Renko bars will be displayed in a stacked manner meaning the Renko bars will be stacked on top of each other. If the Renko bars stacked are green, the top Renko bar close is the Renko close price of the timeframe. Whenever there's no Renko price movement for a specific candles timeframe, there will be a shadow of the color of the previous Renko bar displayed. These shadows can go on for a while if there's no significant price movement or if the Renko brick size input parameter is set too high.
There's 2 ways to calculate the size of each Renko bar. The first way (the default way) uses a fixed fixed brick size where you can choose the size of each brick. The second way uses a dynamic brick size which just uses the ATR with whatever length you would like to determine the brick size for each Renko bar. The dynamic option also has a factor input which would be multiplied with the calculated ATR to determine the brick size. To use the dynamic option, just check the box in the inputs section labeled "Dynamic Renko Box Size (uses the ATR for renko box size)".
Enjoy!!!
Psychlogical TP Levels Indicator V 1This indicator works based on the Average True Range and Renko Charts.
The Renko charts are a perfect way to observe the market trend without noise.
From the image below, you can see that as long as the market is bullish, the Renko chart remains green, and when the market turns from bullish to bearish, the Renko chart also changes its direction. As can be seen in the image below
This indicator allows you to view the clear trend in the market.
Inside the indicator's settings, you can change the ATR Period you want. By default, it is set to 14.
Applying the indicator to charts will plot areas of two colours in a separate window. You have to pay attention to when the indicator changes its colour.
An important thing you need to understand is The psychological indicator is not a buy/sell indicator. It means you’ll not use it for opening a buy/sell trade. You’ll use it for Taking Profit levels only.
Here is how you can use the indicator to decide the take profit levels.
You can open your buy trades with any strategy you use. When you open your trade, you should pay attention to the colour or Psychological Indicator. Now, as the market goes up, you should wait for the indicator to turn from green to red, and when that happens, this will signal to close the trade.
Similarly, for short positions, you can open your sell trades with any strategy you use. When you open your trade, you should pay attention to the colour or Psychological Indicator. Now, as the market goes down, you should wait for the indicator to turn from red to green, and when that happens, this will signal to close the trade. Please check the image below.

Tuned Renko Adaptive Indicator for Free ver.1.0Tuned Renko Adaptive Indicator for Free ver.1.0
It is an indicator that displays the Renko chart on top of the candlestick chart.
The box size of the standard Tradingview function and the indicator using the "ticker.renko () function" does not change even if the "ATR method" is used, but the box size of this indicator changes in real time depending on the volatility.
Since you can display general indicators such as moving averages and Renko charts on one chart, it is very useful for grasping trends.
Please contact me if you have any problems.
( Google translate)
練行足チャートをローソク足チャートに重ねて表示するインジケーターです。
Tradingviewの標準機能や「ticker.renko()関数」を使用したインジケーターは「ATR方式」を使用してもボックスサイズは変動しませんが、このインジケーターのボックスサイズはボラティリティによってリアルタイムで変動します。
移動平均線等の一般的なインジケーターと練行足を一つのチャートに表示できるので、トレンドを把握するのにとても役立ちます。
何か問題があればご連絡ください。

Renko Candles OverlayHello All,
For long time I got many request for Renko Candles and now here it's, Renko Candles Overlay . I tried to make almost everything optional, so you can play with the options as you want.
Let see the options:
Method: the option for brick scaling method: ATR, ATR/2, ATR/4, Percent, Traditional
- ATR Period: period for Average True Range and it's valid if the method is ATR
- ATR/2 Period: period for Average True Range and it's valid if the method is ATR/2
- ATR/4 Period: period for Average True Range and it's valid if the method is ATR/4
- Traditional: User-defined brick size, it's valid if the method is Traditional
- Percent: Percent of Close price, it's valid if the method is Percent
if the method is not Traditional (fixed brick size) then Brick size is calculated/updated when new bricks added. so The box sizes may be different because of the calculation is dynamic.
Levels & Lines for new Bricks: if you enable this option then the script shows the levels for new brick
Change Bar Color: optionally the script changes the bar color by using direction of the bricks
and some other options for coloring.
The script shows the bricks for visible area, which is approximately 280 candles. so if you change the width and number of the bricks then number of bricks that is shown is adjusted automatically to fit the screen. you can see the examples below:
The script shows the levels to new brick as a line and label:
Because of real-time bar is not confirmed until the candle close, the script shows the bricks as Unconfirmed , and unconfirmed bricks shown in different color:
You can change the width of the bricks (width is 10 in following example):
Optionally candle colors are changde by the direction of the bricks:
If you have any recommendation then please drop a comment under the script ;)
Enjoy!

MM CHEATCODE V2The Best Renko system out there. The second coming to the original Cheatcode Algo we made
with options to use Tradition point calculations or ATR values for price measurement
- Select up to 3 tp levels
- ATR Risk calculator
- Strategy presets for easy setting selection for certain assets
- A trailing Ma for stint entries filters
- Volatility bands (BB, Kentler,Donchain)
- ATR super trend for added trend & trade filter
- MTF filter (up to 3)
- Added Session display as well as strict filter to only trade during that session(s) selected
- Full signal Alerts (meaning the full signal will send Entry, TP, Sl )
- added MM Capo volatility filter
Also Have Automation Version Available
How to use
You can use a setting preset in for the asset selected and the settings will automatically adjust but won't apply to your setting screen. (Tradingview limitations)
For the most part the buy signal will plot when the ATR moves in up/down direction
Filter your trades with the various trend detections indicators added when they all line up you have the best probability for the trade.
Renko is the best way to trade basic market structure and now with all the confirmation you need.
ALL Links below or PM us for access to this indicator Happy Trading

Renko chartThis script displays the renko chart of the candlesticks chart
The color of the chart is green (red) if the trend is up (down).
The following settings are available:
Renko parameters:
Style = Box Size Assignment Method: 'ATR', 'Traditional'.
Parameter = ATR Length if `Style` is equal to 'ATR', or Box Size if `style` is equal to 'Traditional'.
Timeframe parameters:
Period = Resolution, e.g. 'm' - minutes, 'D' - daily, 'W' - weekly, 'M' - monthly, or same as chart
Multiplier = Multiplier of resolution, e.g. '60' - 60m if Period is 'm'
Alerts are also provided, to catch these conditions:
trend change = up to down or viceversa
bullish reversal = down to up
bearish reversal = up to down

[blackcat] L5 Renko MasterLevel: 5
Background
Like many people in the Tradingview community, I have been studying how to apply Renko charts to backtesting and live trading for long. However, as we all know, the official Tradingview Renko chart is not recommended for backtesting because it will lead to unrealistic backtesting results. So, I thought about developing a set of customized Renko charts that can be used for backtesting and second-level trading. This "L5 Renko Master" is one of them that I am introducing today.
In fact, this is not a Renko chart based on Tick's principle. It is based on OHLC data, because this kind of chart can be used for reliable backtesting and trading in Tradingview. Therefore, the Renko Master in this script can actually coexist with the standard Japanese candlestick chart, but the trend reversal information it prompts is based on a principle similar to Renko. When the two can coexist and produce trading signals at the same time, this is really a very interesting invention.
Function
First of all, this Renko chart can coexist in the main chart with the Japanese candlestick chart. It can support up to 1 second level of display and trading. By configuring two parameters, you can adapt it to different Time Frames.
Secondly, this Renko chart can be used for backtesting strategies, because it is essentially OHLC data. Although the absolute value of the price cannot correspond to the original OHLC one-to-one, the certainty of the trend reversal is relatively high. It can be compared with Japanese candlesticks on the timeline.
Finally, this Renko chart is embedded with a Renko intrinsic trading strategy, which can be used to locate entry points through red and green labels. This strategy supports Tradingview alerts. You can get "LONG" or "SHORT" trading reminders by creating alerts. In order to obtain a clear market structure, Zen Stroke (Autolength ZigZag) and Zen Kiss (Special Moving Averages) can be checked to be superimposed and displayed on the main chart to facilitate understanding of the temporal and spatial position of prices in the market.
Indicator Set
Renko Master Boxes (砖块图)
Zen Stroke (Auto ZigZag , 自动画缠论笔)
Zen Kiss Moving Averages (缠论均线)
Inputs
Price --> Price source used to produce Renko, close is default.
RefBarBack --> Lookback period length to calculate Renko. The larger value, the less sensitive to price ripples and sideways.
BoxPerc --> Internal box percentage input. The larger value, the less sensitive to price ripples and sideways.
Show Zen Stroke (AutoLen ZigZag)? --> Switch to turn on and off ZigZag.
Shown Renko MA? --> Switch to turn on and off special moving averages.
Key Signal
Bricks
Green bricks for up trend
Red bricks for down trend
Labels
Green labels for buy/long.
Red labels for sell/short.
Zen Stroke (ZigZag)
Green line section for up stroke
Red line section for down stroke
Moving Averages
Yellow for fast line
Fuchsia for slow line
Pros and Cons
Suitable for discretionary trading and bots via alerts. However, only well selected trading pair and time frame can guarantee bot works.
Intuitive and effective, the output signal is more reliable after multi-indicator resonance
Remarks
My third L5 indicator published
Closed-source
Invite-only
Redeem Fee Life Lock Guarantee
Although I take the efforts to inform the script requesters that the best way to promote trading skills is to learn from the open source scripts I released by themself and to improve their PNIE script programming skills, there are still many people asking how to obtain or pay to use BLACKCAT L4/L5 private scripts. In fact, I do not encourage people to use Tradingview Coins ( TVC ) / Cryptocurrency to redeem the right to use BLACKCAT L4/L5 scripts. However, redeeming private script usage rights through TV Coins/ Cryptocurrency may be an effective way to force more people to learn PINE script programming seriously. And then I can concentrate on answering more valuable community questions instead of being overwhelmed by L4/L5 scripting permission reqeusts.
I would like to announce a ‘Redeem Fee Lock Guarantee’ program to further simplify the L4/L5 indicator/strategy utility offering and distinguish itself from the competition. ‘Redeem Fee lock guarantee’ is one of the major initiatives by BLACKCAT as a part of overall value packaging designed to guard BLACKCAT’s followers’ against cost-overruns and operational risks usually borne by them when it comes to PINE script innovation ecosystem. The TVCs redeemed for L4/L5 a follower signs up for with BLACKCAT is their guaranteed lifetime locked in TVC Quantity/ cryptocurrency, with no special conditions, exclusions and fine print whatsoever. Based on this scheme, I can constantly refine, expand, upgrade and improve PINE script publishing to ensure the very best experiences for my followers. The 'Redeem Fee Lock Guarantee' is a step in the direction of rewarding the valuable followers. NOTE: Every L4/L5 script redeeming service is ONLY limited to TVC or Cryptocurrency ("Win$ & Donate w/ This" Addresses displayed on script page) redeeming which the 1st signed up TVC Qty/ equivalent cryptocurrency is the lifetime offered TVC Qty/ equivalent crypto.
How to subscrible this indicator?
The script subscription period only has two options of one month or one year, and its price is floating. The latest price of the script subscription is proportional to the number of likes/agrees this script has already received. Therefore, the price of subscribing to this script shows an increasing trend, and the earliest subscribers can enjoy the price of lifetime lock to this script. As the number of likes / agrees of this script increases, the subscription fee for one month and one year will also increase linearly. Whatever, the first subscription price of the use will be locked for life.
Monthly subscription and annual subscription can be done either by tradingview coins ( TVC ) or by converting into equivalent cryptocurrency at the exchange rate (1TVC=0.01USD) for redeem.
TVC payment needs to pay TVC directly in the comments under this script. Every time I authorize a new user, I will update the latest number of subscribed users and latest price for next subscription under the script comment. If there are any conflicting scenario happened to the rules and my update. My updated price based on the rule will be the final price for next subscription. The following subscribers need to pay the corresponding amount of TVC or cryptocurrency in accordance with the latest number of users and price announced by me in accordance with the rules published.
TVC redemption is the method I strongly recommend, and I hope you can complete the redemption in the comment area of this script. This is like a blockchain structure, each comment is a block, each subscription is a chain, which is conducive to open and transparent publicity and traceability to avoid unnecessary disputes.
Monthly Subscription Charges
500TVC <50 Agrees (A)
50A<850TVC<100A
100A<1000TVC<150A
150A<1350TVC<200A
200A<1500TVC<250A
250A<1850TVC<300A
300A<2000TVC<350A
350A<2350TVC<400A
400A<2500TVC<450A
450A<2850TVC<500A
500A<3000TVC<550A
550A<3350TVC<600A
600A<3500TVC<650A
650A<3850TVC<700A
700A<4000TVC<750A
750A<4350TVC<800A
800A<4500TVC<850A
850A<4850TVC<900A
900A<5000TVC<950A
950A<5350TVC<1000A
1000A<5500TVC<1050A
And so on...
Annual Subscription Charges
5000TVC <50 Agrees (A)
50A<8500TVC<100A
100A<10000TVC<150A
150A<13500TVC<200A
200A<15000TVC<250A
250A<18500TVC<300A
300A<20000TVC<300A
350A<23500TVC<400A
400A<25000TVC<450A
500A<28500TVC<550A
500A<30000TVC<550A
550A<33500TVC<600A
600A<35000TVC<650A
650A<38500TVC<700A
700A<40000TVC<750A
750A<43500TVC<800A
800A<45000TVC<850A
850A<48500TVC<900A
900A<50000TVC<950A
950A<53500TVC<1000A
1000A<55000TVC<1050A
And so on...

Quantum RenkoIf you are a more experienced trader, you might have come across the word “renko” or have seen it in trading forums and communities. It refers to a Japanese charting technique that is extremely popular among traders because of the particular way it plots price action. And it does this by removing time, and in effect focuses on price action delivering smooth trends and clear congestion phases. More importantly however it reveals momentum since it is independent of time and so as the market speeds up, so does the chart, and vice versa. This is a concept you would not see in a normal time-based chart.
Each bar is created when the price exceeds the previous bar’s high or low by a predefined amount or what we call the box size or brick size. This gives the renko chart a pleasant appearance of equally sized bars running up or down in 45-degree angles. This delivers some great advantages.
First, it allows traders to focus solely on price as the chart filters out all minor price fluctuations and market “noise”. This makes it easier for traders not only to identify strong moves but also to spot significant turning points, and so deploy smarter entries and exits.
Second, a renko chart helps traders in what is probably one of the most difficult aspects of trading, namely staying in a position once a move is underway. The renko chart does this by displaying price momentum as it speeds up and slows down and it does this because a renko chart is devoid of time.
Finally, because the bricks are drawn at 45-degree angles from each other, the charts are easier to read and to analyze.
Unfortunately, on TradingView the renko chart is extremely limited for free users and the Quantum Renko indicator offers a great solution with some exciting new features.
Dual Mode
You can use the Quantum Renko indicator for TradingView in 2 different ways.
Standard
When applied, the Quantum Renko indicator appears below the main chart and creates a renko chart representation of the time-based chart above. Please note that in Standard mode, and since renko charts are devoid of time, the time x-axis of the chart does not apply to the renko chart displayed. Right off the bat, the Dynamic Renko indicator takes the time-based chart above and calculates the best box size that matches the current timeframe then uses it to create the renko bars below. The computed box size is displayed at the right-hand side of the renko chart’s last bar. It can also accept a fixed box size by entering it in the indicator’s Fixed Box Size input.
Time-accurate
The renko chart is a powerful approach to adopt as an intra-day trader, as it smooths out the price action into a series of blocks or steps, and so delivers a uniform chart which is easy to analyse. And of course, being a non time-based chart, it reveals momentum as the price action speeds up and slows down which is invaluable when scalping. However, there is a problem. As it is a non time-based chart it can be tricky to align this with a time based chart as the two are not synchronised. So, where a trader is running the renko alongside a time-based chart using one to analyse the other and vice versa, it is almost impossible to align the two correctly. This is even more significant when using indicators on the time-based chart such as volume, third party proprietary indicators or those which are freely available. So, what’s the answer?
The Time-accurate renko indicator solves the issue instantly. It is unique and as far as we know nobody has developed such an indicator to provide a solution to this problem. So how does it work? And as you might expect the answer is all in the name. We call it the Time-accurate renko indicator because that’s what it is. In simple terms it aligns the bricks it builds with the time-based chart above. So where for example the time-based price action moves into congestion, so does the time accurate renko and will build a horizontal wall of bricks at that level until the price action breaks away, at which point the Time-accurate renko begins building in the normal way with bricks which rise or fall with the trend. What the chart then delivers is a wonderful picture of clear levels of support and resistance as you might see when a brick wall is under construction, helping traders to establish breakaway price action which all the time is mirrored on the time-based chart with the chosen indicators. What makes the Time-accurate renko even more powerful is the option to select either your own choice of brick size or alternatively the optimised version which means you are trading in harmony with the market. The optimal setting is derived from calculations based on average true range and delivers the perfect brick size for all markets, timeframes and session times, so there is no more guesswork. The indicator does it all for you. However, if you prefer to set your own brick size this is available also.
And the best news of all, is that the Time-accurate renko is included with the Standard renko, so you have two indicators for the price of one and can switch from one to the other at any time or perhaps run both. The choice is yours with this unique combination of renko indicators.

Renko Simple OverlaySimple Renko Overlay that attempts to deal with the delay present in the Renko function while still using brick size from the Renko function.

Renko + CandlesThis indicator has been designed to show you both candle chart and Renko chart in one place.
I think most of you are familiar with candle chart which is working with the time and price movements but Renko chart is based on price differences and is not related to the "time" parameter.
so if you see a Renko brick is appear up(or down) to the previous brick it means that a certain and fixed price movement has been occurred (which mostly calculate by ATR). and also this indicator works in any time frame.
Remember because we want both charts we have time parameter in this indicator, and if the price doesn't move up or down a certain percentage from previous bars, it will plot a renko bar beside the previous one.
you can use this indicator to see if the price moves up or down.
Or you can determine the important support and resistances with much less noises.
it can be used as a confirmation for you to keep your positions or exit.
go ahead and discover it...
If you have any questions, don't hesitate! ask in the comments section below.

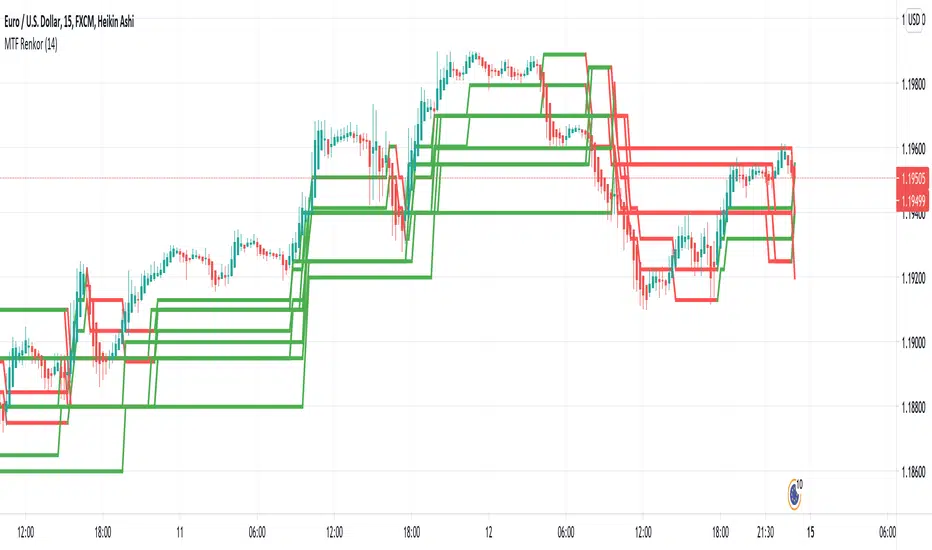
MTF RenkoThis indicator Should be opened on a 15 min chart
It will display the Renko Highs and lows of:
30 min chart
45 min chart
60 min chart
and
120 min chart
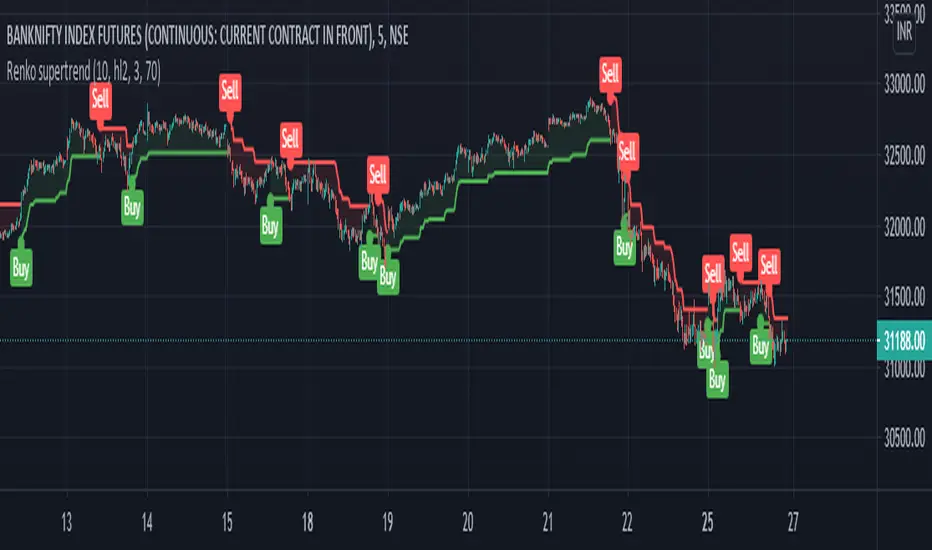
Renko supertrend by Ak
hi friends....publishing Renko supertrend indicator.
Renko charts are a great way to help those who can be spooked by the chaos of the markets (I'm one!), but they have a big drawback in that the price you see on renko chart is often significantly different from the real price that you would trade on. This brings issues of unrealistic expectations of profits/losses, and also makes back testing a strategy very difficult. I still wouldn't recommend ever using TradingView's "strategy" tool when using renko charts, but using this indicator you can do accurate manual back tests.
U have to chose box size..so its not repaint when u refresh chart..bcs on atr based chart its repaint when u refresh chart.
This uses Renko boxes as source on normal chart..don't use it on renko charts
There is an option for use normal japanes candle supertrend..so we can compare how this renko chart prevent false trades.
[MACLEN] HODL ZONE RENKO
PLEASE READ!
Trade at your own risk. Please read about renko charts before using this indicator. This indicator is for educational purposes only.
This Indicator is only valid in renko charts with 1 second timeframe. For BTCUSDT . With the traditional method and the size box of 80.
With this indicator we can detect zones of buy and sell. Even that is not recommended to use leverage, I use it to find an entry and use only small leverages. It could be also used to accumulate and HODL bitcoin .
Please, comment anything.
POR FAVOR LEER!
Tradea bajo tu propio riesgo. Por favor lee sobre las graficas renko antes de usar este indicador. Este indicador es solamente con fines educativos.
Este indicador es válido solamente en graficas renko con un timeframe de 1 segundo. Para BTCUSDT . Con cajas del método tradicional de un tamaño de 80.
Con este indicador podemos detectar zonas de compra y venta. A pesar de que no es recomendable usar apalancamiento, yo lo uso para encontrar entradas y solo uso apalancamientos pequeños. También podría usarse para acumular y holdear bitcoin .
Por favor, escríbeme cualquier duda o comentario.

Renko Candles & Trend System [racer8]Brief:
Renko Candles & Trend System (RCTS) allows traders to have a renko chart alongside their main chart.
This is an off-chart version of my previous indicator called "Renko Dots" with an extra component (SMA).
A true masterpiece, I'm very proud of it. I put a lot of work into it 😝
RCTS has 3 parameters:
Renko Method - Traditional or ATR. These are 2 different ways to calculate Renko.
Renko Length - Length controls traditional Renko bar's fixed price range or controls the ATR period.
SMA Length - Simple moving average of all Renko values.
Signals:
Renko can be either green candle (bullish), red candle (bearish), or dots (neutral).
When Renko is above sma, go long.
When Renko is below sma, go short.
Fire icon (🔥) indicates that Renko crossed sma.
You may change this icon to pretty much any icon you like by copying & pasting any emoji/icon off the internet into the emoji parameter.
Here's a link to save you time: getemoji.com
Or here's a quick list of some icons to copy & paste into the emoji parameter:
Smileys 😄️ 😉 🥰 😝 😎
Gestures 👌 ✌️ 🤟 👍 👊 🙏
Animals 🐱 🦊 🐻 🐼 🐮 🐷
Other 😈 👺 🤡 💀 👽 🤖 🎃 ❤️ 💛 💙
***(This is a hand-picked list I made including only my favorites)
What is a Renko chart?
A Renko chart is a special chart that modifies a regular price chart's information about the close price and transforms it into Renko values that are plotted as Renko boxes on a chart. These boxes typically have a fixed range, say 10 pips for example. Or 1 ATR.
For more information on Renko charts : www.investopedia.com
Just for fun, I've included the following features:
- A heart emoji in the short title (💙)
- A heart made out of @s in the script's code
- A nice quote in the script's code
Have fun.
Hit the like button!
Stay safe.
Enjoy and happy halloween guys & girls 😉

Renko Bar ChangeI realized it's not in the TV Library so I think it's mandatory to add.
If you wish to access and use for yourself contact me - I reply on Average in less than 4 hours on a 60 day period.
---
Renko Bar Change Indicator Documentation:
Renko Parameters:
Set Box Size either via ATR or your own Float-Value after choosing the correct Renko Style-Option.
Both Renko Style Options are self-explanatory.
Alerts and Plots:
1) Green arrow visualizing a green Renko bar after a red Renko bar
2) Red arrow visualizing a red Renko bar after a green Renko bar
3) Alert for green Renko Bar after red Renko Bar
4) Alert for red Renko Bar after green Renko Bar

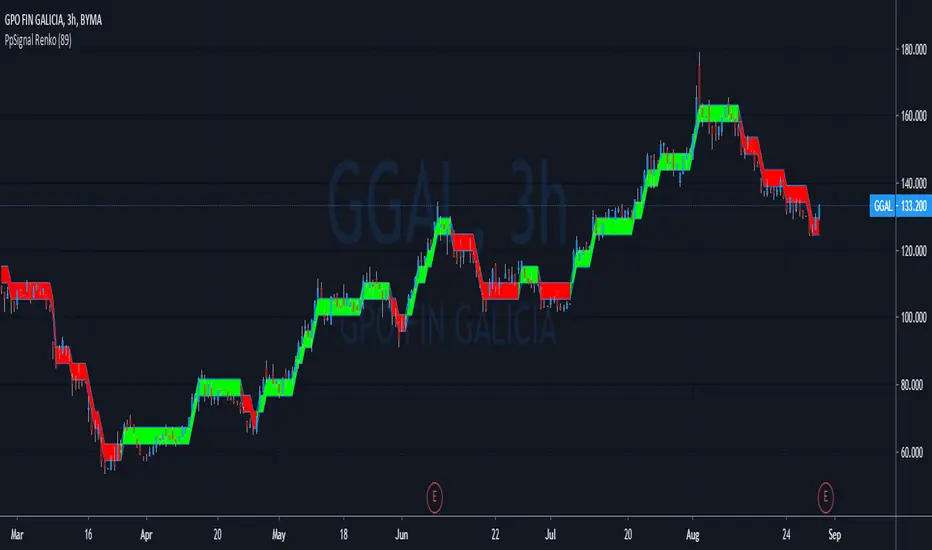
PpSignal RenkoA renko chart is a type of financial chart of Japanese origin used in technical analysis that measures and plots price changes. A renko chart consists of bricks, which proponents say more clearly show market trends and increase the signal-to-noise ratio compared to typical candlestick charts
PpSignal Renko emulator you can see the Renko chart and the candle in the same time.
Work with atr Average true range.
Buy when the Renko is lime end sell when the Renko is red.
Be careful the Renko chart changes color when the close Renko price is higher than the open Renko so it can repaint up to the close price of the current candle
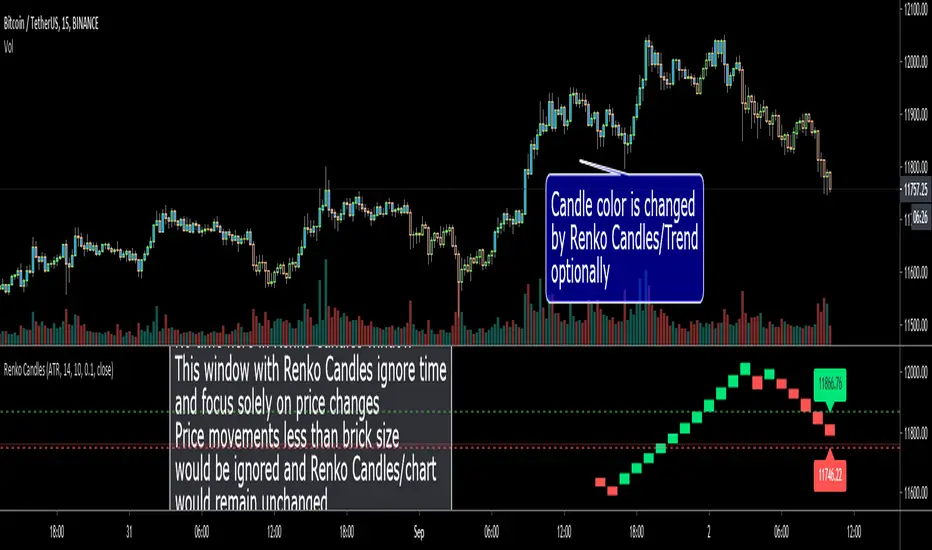
Renko CandlesHello Traders!
This scripts draws Renko Candles in a seperate window dynamically and live. it shows only last 20 Renko candles. there is no time in that window, that means this window with Renko candles ignore time and focus solely on price changes. For Example If the brick value is set at 10 points, a move of 10 points or more is required to draw another brick. Price movements less than 10 points would be ignored and the Renko chart would remain unchanged. If you don't know what Renko Chart/Candle is then you should read some articles about it ;)
"Method" in the option is same as in Renko Chart, two methods: "Traditional" or "ATR ". default value is ATR
if you choose Traditional method then you need to set brick size accordingly. Increasing or decreasing the box size will affect the "smoothness" of the chart.
if you choose ATR mode then brick size will be set by using Average True Range(ATR) indicator
You have option to use Closing Price or High/Low. by default it's "Close"
Optionally it can change candle colors by Renko Bricks/Trend
Optionally it can show the levels for new bricks.
in this example, Mode = Traditional and Brick size: 10
in this example, Mode = Traditional and Brick size: 50
in this example Mode = ATR
Do not forget to click "Donate" button ;)
Enjoy!
Hancock - Renko Brick ProductionThis is the accompanying script that shows how many renko bricks were produced in each direction per candle. It gives a basic indication of volatility, some might find it useful.
Happy trading
Hancock

Renko Level Strategy 2Renko Level Strategy
Main change of my previous strategy, that it look to one level of RENKO and use ATR value from each previous candle.
I think it is more correct than use levels that appears in first candle of new RENKO level, cause it base on current volatility, but not on volatility that was many candles ago.
