Magic Moving AveragesThis indicator plots up to three adaptive “Magic MAs” plus a weighted combo line, with optional traditional SMAs for comparison.
Instead of averaging only closes, each Magic MA:
looks at the midpoints of highs/lows and opens/closes
decides whether recent behaviour favours the highs or the lows
builds a series of either highs or lows, then smooths it over your chosen length
You can run:
Short / Medium / Long Magic MAs
A weighted combo line (using 1–10 weights)
Optional traditional short/long SMAs on close
How I use it:
Price above the combo line → bullish bias
Price below the combo line → bearish bias
Short/medium/long Magic MAs together → dynamic support/resistance and trend structure
Traditional SMAs on for comparison with “classic” moving average behaviour
Inputs:
Magic MA lengths control how reactive vs smooth each regime is
Weights (1–10) let you emphasise short, medium or long regimes in the combo
This is a free / educational version of the Magic MAs.
It’s not financial advice – always manage your own risk.
Rma

DeepClean Linear indicator 1. Indicator Name
DeepClean Linear indicator
2. One-Line Introduction
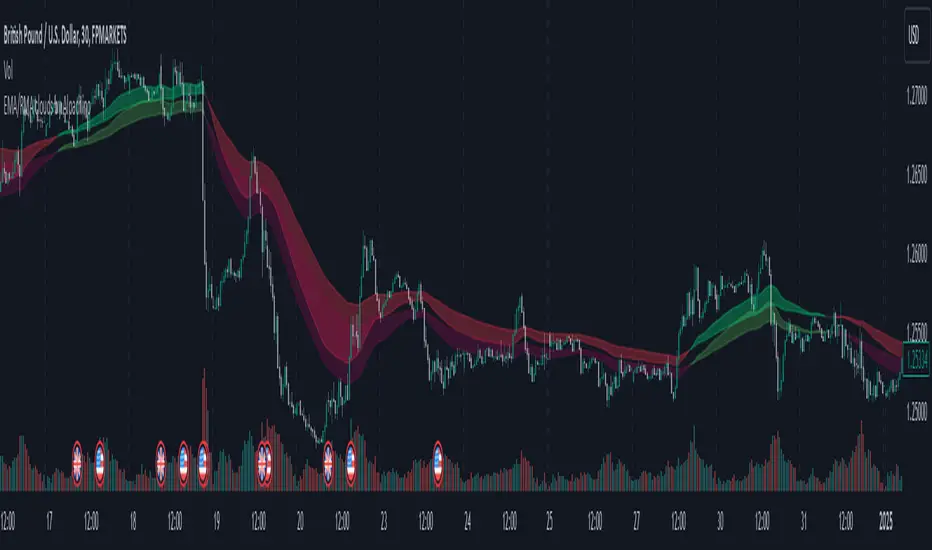
A trend-recognition indicator that overlays a “transparent wave” on price, removing noise and revealing directional bias and trend intensity in a highly intuitive visual form.
3. Overall Summary
The DeepClean Linear indicator calculates trend direction using changes in linear regression slope and determines trend strength by comparing how consistently the regression line moves over a defined lookback window.
Rather than merely identifying trend direction, the indicator applies a triple-layer noise-filtering process (EMA → SMA → RMA) to produce a clean, wave-shaped data line that filters out unnecessary market noise.
This transparent wave sits directly on top of price, allowing traders to visually compare price movement and trend strength at the same time.
A stronger trend results in a taller, thicker wave, while weakening momentum causes the wave to thin, making it easier to spot trend continuation, exhaustion, or upcoming reversal.
Color automatically shifts based on trend:
Bright cyan/teal during bullish conditions
Reddish tones during bearish conditions
Transparency dynamically adjusts depending on strength
The indicator excels at identifying the true underlying trend by ignoring minor fluctuations and is well suited for scalping, swing trading, and position trading.
It also significantly reduces false signals in ranging markets, making it ideal for trend-following strategies.
4. Advantages
① Ultra-Clean Noise-Reduced Wave
Utilizes a 3-stage smoothing filter (EMA → SMA → RMA) to produce a much cleaner wave than standard moving averages, highlighting only core trend movement.
② Trend Direction & Strength at a Glance
Based on comparative linear regression behavior, the indicator quantifies both direction and strength, making convergence/divergence highly visible.
③ Intuitive Price Overlay Visualization
The semi-transparent wave sits directly on price action, allowing traders to instantly see divergence from price, trend weakening, or early turning points.
④ Dynamic Transparency Coloring
Strong trends appear bold and intense, while weaker trends fade visually—making signal interpretation effortless.
⑤ Excellent Range Filtering
During low-direction phases (state = 0), the wave turns neutral, preventing forced or premature entries.
⑥ Multi-Timeframe Compatibility
The wave remains stable from 1-minute to weekly charts, making it suitable for trend analysis, execution, and risk control across all timeframes.
📌 Core Concept Overview
The indicator evaluates the relative comparison of linear regression values over the last n periods.
A positive trend value indicates bullish bias
A negative trend value indicates bearish bias
Intensity represents strength and controls wave height
waveTop / waveBot define the visual wave area relative to price
State Values
1 = Bullish Trend
-1 = Bearish Trend
0 = Neutral / Weak Direction
⚙️ Settings Overview
Option Description
Trend Lookback (n) Comparison window for regression slope. Higher = bigger trend focus.
Range Tolerance (%) Strength threshold to classify bullish/bearish movement. Higher = more conservative.
Source Price source for regression calculations.
Linear Reg Length Length of the linear regression.
Noise Filter Strength (smoothK) Controls the smoothing intensity. Higher = smoother wave.
Wave Amplitude (amp) Adjusts the height/thickness of the wave.
Bull/Bear Color Colors for bullish/bearish waves.
Base Transparency Base opacity level; modified dynamically by trend strength.
📈 Bullish Timing Recognition Examples
Wave begins turning brighter teal and more opaque, indicating strengthening upward pressure.
waveTop expands above price, signaling early trend expansion.
State flips to 1, often marking a trend restart or early reversal phase.
A steadily rising wave height suggests sustained bullish momentum.
📉 Bearish Timing Recognition Examples
Wave shifts into red tones, showing bearish dominance.
waveBot expands below price, indicating rising downside volatility.
State stays at -1 while intensity increases, signaling entry into strong downtrend conditions.
A shift from weak → strong bearish intensity can provide short-entry timing cues.
🧪 Recommended Usage
Use as a core component in trend-following systems
Adjust position size based on wave thickness (trend strength)
Combine with RSI/MACD to reduce false signals during overbought/oversold zones
Sudden wave expansion during volatility increases helps detect trend acceleration
In sideways markets, frequent state = 0 readings help avoid low-probability trades
🔒 Important Notes
As a trend-based indicator, it may misread choppy/ranging markets
Because of smoothing, signals may appear slightly delayed
Extreme news volatility can temporarily distort trend clarity

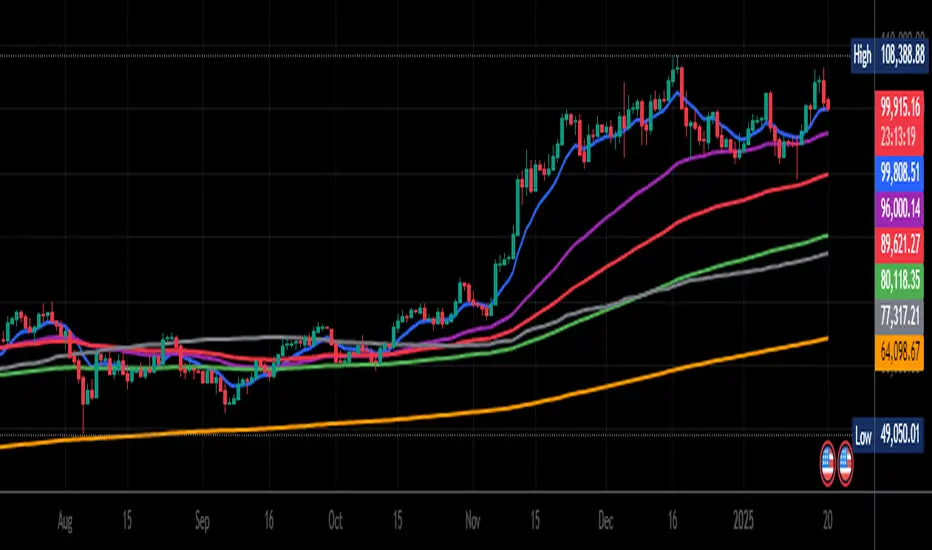
SuperTrend Dual RMAOverview
The SuperTrend Dual RMA is a hybrid volatility-based trend-following system that merges two Relative Moving Averages (RMAs) with an Average True Range (ATR)–anchored SuperTrend framework. The primary purpose of this indicator is to offer a smoother and more reliable depiction of directional bias while maintaining sensitivity to price volatility and market volume.
Traditional SuperTrend implementations typically rely on a single moving average and a fixed volatility envelope. This dual RMA structure introduces an adaptive central tendency line that reacts proportionally to both price and volume, allowing for more nuanced identification of trend reversals and continuation patterns.
**Core Concept**
The indicator is built around two key principles — smoothing and volatility adaptation.
1. **Smoothing:** The use of two separate RMAs with configurable lengths creates a dynamic equilibrium between short-term responsiveness and long-term stability. The first RMA captures near-term directional shifts, while the second provides broader market context. The average of both becomes the foundation of the SuperTrend bands.
2. **Volatility Adaptation:** The ATR multiplier and period define the distance between upper and lower bands relative to recent volatility. This ensures that the SuperTrend line remains flexible across varying market conditions — expanding during high volatility and contracting during calm phases.
**Calculation Steps**
* The indicator first computes two volume-weighted RMAs based on the typical price (`hlc3`) multiplied by trading volume.
* Each RMA is normalized by the smoothed volume to maintain proportional weighting.
* These two RMAs are averaged to produce a “basis line” that reflects the current market consensus price.
* The ATR is calculated over a user-defined period, then multiplied by a volatility factor (ATR multiplier).
* The resulting ATR value defines dynamic upper and lower thresholds around the basis line.
* Trend direction is determined by price closing behavior relative to these thresholds:
* When the closing price exceeds the upper band, the trend is considered bullish.
* When it drops below the lower band, the trend turns bearish.
* If price remains within the bands, the prior trend direction is maintained for consistency.
**Visual Structure**
The SuperTrend Dual RMA provides multiple layers of visual feedback for enhanced interpretation:
* Two distinct RMA lines (short and long) are plotted with complementary colors for contrast and clarity.
* A soft fill between the RMA lines highlights the interaction between short- and medium-term momentum.
* The ATR-based SuperTrend bands are drawn above and below the basis, with adaptive coloring that corresponds to the prevailing trend direction.
* Bar colors automatically adjust to reflect bullish or bearish bias, making it easy to identify trend shifts without relying solely on crossovers.
* Optional triangle markers appear below or above bars to signal potential buy or sell opportunities based on crossover logic.
**Signals and Alerts**
The indicator provides real-time crossover detection:
* **Buy Signal:** Triggered when the closing price moves above the SuperTrend line, confirming potential bullish continuation or reversal.
* **Sell Signal:** Triggered when the closing price drops below the SuperTrend line, indicating possible bearish momentum or reversal.
Both conditions have built-in `alertcondition()` functions, allowing users to set automated alerts for trading or monitoring purposes. This enables integration with TradingView’s alert system for push notifications, emails, or webhook connections.
**Usage Guidelines**
* **Trend Identification:** Use the color-coded trend line and bar color as a visual guide to the current directional bias.
* **Entry and Exit Timing:** Consider entering trades when a new crossover alert appears, preferably in the direction of the overall higher-timeframe trend.
* **Parameter Tuning:** Adjust the RMA lengths and ATR parameters based on asset volatility. Shorter RMA and ATR settings provide faster reactions, suitable for intraday or high-frequency trading, while longer configurations better fit swing or position strategies.
* **Risk Management:** Because the SuperTrend inherently acts as a dynamic stop level, traders can use the opposite band or SuperTrend line as a trailing stop or exit signal.
**Practical Applications**
* Trend confirmation in multi-timeframe strategies.
* Adaptive trailing stop placement using the lower or upper band.
* Visual comparison of volume-weighted price movement against volatility envelopes.
* Integration into algorithmic trading systems as a signal filter or trend bias component.
* Identification of overextended conditions when price significantly diverges from the SuperTrend basis.
**Originality and Advantages**
The SuperTrend Dual RMA differentiates itself from conventional SuperTrend scripts through three innovative design choices:
1. **Dual Volume-Weighted RMAs:** By incorporating two RMAs weighted by trading volume, the indicator accounts for liquidity dynamics, producing smoother and more reliable averages compared to price-only calculations.
2. **Anchored SuperTrend Framework:** The SuperTrend bands are not derived from a fixed source (such as a single close or median price) but from a blended RMA basis, making them more adaptable to varying market behaviors.
3. **Integrated Multi-Layer Visualization:** The inclusion of filled regions between RMAs, dynamic band coloring, and bar tinting enhances readability and analytical depth without overwhelming the chart.
These improvements collectively create a more balanced and data-rich representation of market structure, offering a higher degree of analytical precision. It’s suitable for traders seeking both discretionary and systematic use, as the indicator’s logic is transparent and compatible with alert-based or automated workflows.
**Summary**
The SuperTrend Dual RMA is a refined evolution of the classic SuperTrend, optimized for traders who value smoother directional tracking and more intelligent volatility adaptation. It blends two time-sensitive, volume-aware moving averages with an ATR-derived volatility system to deliver reliable, actionable trend information. Its visual design, adaptive responsiveness, and integrated alert functionality make it a complete solution for identifying and managing trends across multiple asset classes and timeframes.

Multiple Colored Moving AveragesMULTIPLE COLORED MOVING AVERAGES - USER GUIDE
DISCLAIMER
----------
Both the code and this documentation were created heavily using artificial intelligence. I'm lazy...
This indicator was inspired by repo32's "Moving Average Colored EMA/SMA" indicator. *
What is this indicator?
-----------------------
This is a TradingView indicator that displays up to 4 different moving averages on your chart simultaneously. Each moving average can be customized with different calculation methods, colors, and filtering options.
Why would I use multiple moving averages?
-----------------------------------------
- See trend direction across different timeframes at once
- Identify support and resistance levels
- Spot crossover signals between fast and slow MAs
- Reduce false signals with filtering options
- Compare how different MA types react to price action
What moving average types are available?
----------------------------------------
11 different types:
- SMA: Simple average, equal weight to all periods
- EMA: Exponential, more weight to recent prices
- WMA: Weighted, linear weighting toward recent data
- RMA: Running average, smooth like EMA
- DEMA: Double exponential, reduced lag
- TEMA: Triple exponential, even less lag
- HMA: Hull, fast and smooth combination
- VWMA: Volume weighted, includes volume data
- LSMA: Least squares, based on linear regression
- TMA: Triangular, double-smoothed
- ZLEMA: Zero lag exponential, compensated for lag
How do I set up the indicator?
------------------------------
Each MA has these settings:
- Enable/Disable: Turn each MA on or off
- Type: Choose from the 11 calculation methods
- Length: Number of periods (21, 50, 100, 200 are common)
- Smoothing: 0-10 levels of extra smoothing
- Noise Filter: 0-5% to ignore small changes
- Colors: Bullish (rising) and bearish (falling) colors
- Line Width: 1-5 pixels thickness
What does the smoothing feature do?
-----------------------------------
Smoothing applies extra calculations to make the moving average line smoother. Higher levels reduce noise but make the MA respond slower to price changes. Use higher smoothing in choppy markets, lower smoothing in trending markets.
What is the noise filter?
--------------------------
The noise filter ignores small percentage changes in the moving average. For example, a 0.3% filter will ignore any MA movement smaller than 0.3%. This helps eliminate false signals from minor price fluctuations.
When should I use this indicator?
---------------------------------
- Trend analysis: See if market is going up, down, or sideways
- Entry timing: Look for price bounces off MA levels
- Exit signals: Watch for MA slope changes or crossovers
- Support/resistance: MAs often act as dynamic levels
- Multi-timeframe analysis: Use different lengths for different perspectives
What are some good settings to start with?
-------------------------------------------
Conservative approach:
- MA 1: EMA 21 (short-term trend)
- MA 2: SMA 50 (medium-term trend)
- MA 3: SMA 200 (long-term trend)
- Low noise filtering (0.1-0.3%)
Active trading:
- MA 1: HMA 9 (very responsive)
- MA 2: EMA 21 (short-term)
- MA 3: EMA 50 (medium-term)
- Minimal or no smoothing
How do I interpret the colors?
------------------------------
Each MA changes color based on its direction:
- Bullish color: MA is rising (upward trend)
- Bearish color: MA is falling (downward trend)
- Gray: MA is flat or unchanged
What should I look for in crossovers?
-------------------------------------
- Golden Cross: Fast MA crosses above slow MA (bullish signal)
- Death Cross: Fast MA crosses below slow MA (bearish signal)
- Multiple crossovers in same direction can confirm trend changes
- Wait for clear separation between MAs after crossover
How do I use MAs for support and resistance?
---------------------------------------------
- In uptrends: MAs often provide support when price pulls back
- In downtrends: MAs may act as resistance on rallies
- Multiple MAs create support/resistance zones
- Stronger levels where multiple MAs cluster together
Can I use this with other indicators?
-------------------------------------
Yes, it works well with:
- Volume indicators for confirmation
- RSI or MACD for timing entries
- Bollinger Bands for volatility context
- Price action patterns for setup confirmation
What if I get too many signals?
-------------------------------
- Increase smoothing levels
- Raise noise filter percentages
- Use longer MA periods
- Focus on major crossovers only
- Wait for multiple MA confirmation
What if signals are too slow?
-----------------------------
- Reduce smoothing to 0
- Lower noise filter values
- Switch to faster MA types (HMA, ZLEMA, DEMA)
- Use shorter periods
- Focus on the fastest MA only
Which MA types work best in different markets?
----------------------------------------------
Trending markets: EMA, DEMA, TEMA (responsive to trends)
Choppy markets: SMA, TMA, HMA with smoothing (less whipsaws)
High volatility: Use higher smoothing and noise filtering
Low volatility: Use minimal filtering for better responsiveness
Do I need all the advanced features?
------------------------------------
No. Start with basic settings:
- Choose MA type and length
- Set colors you prefer
- Leave smoothing at 0
- Leave noise filter at 0
Add complexity only if needed to improve signal quality.
How do I know if my settings are working?
-----------------------------------------
- Backtest on historical data
- Paper trade the signals first
- Adjust based on market conditions
- Keep a trading journal to track performance
- Be willing to modify settings as markets change
Can I save different configurations?
------------------------------------
Yes, save different indicator templates in TradingView for:
- Different trading styles (scalping, swing trading)
- Different market conditions (trending, ranging)
- Different instruments (stocks, forex, crypto)

Mean Reversion & Momentum Hybrid | D_QUANT 📌 Mean Reversion & Momentum Hybrid | D_QUANT
📖 Description:
This indicator combines mean reversion logic, volatility filtering, and percentile-based momentum to deliver clear, context-aware buy/sell signals designed for trend-following and contrarian setups.
At its core, it merges:
A Bollinger Band % Positioning Model (BB%)
A 75th/25th Percentile Momentum System
A Volatility-Adjusted Trend Filter using RMA + ATR
All tied together with a dynamic gradient-style oscillator that visualizes signal strength and persistence over time — making it easy to track high-conviction setups.
Signals only trigger when all three core components align, filtering out noise and emphasizing high-probability turning points or trend continuations.
⚙️ Methodology Overview:
Bollinger Bands % (BB%):
Price is measured as a percentage between upper and lower Bollinger Bands (based on OHLC4). Entries are only considered when price exceeds custom BB% thresholds — emphasizing market extremes.
Volatility-Based Trend Filter (RMA + ATR):
A smoothed RMA baseline is paired with ATR to define trend bias. This ensures signals only occur when price deviates meaningfully beyond recent volatility.
Percentile Momentum Model (75th/25th Rank):
Price is compared against its rolling 75th and 25th percentile. If price breaks these statistical boundaries (adjusted by ATR), it triggers a directional momentum condition.
Signal Consensus Engine:
All three layers must agree — BB% condition, trend filter, and percentile momentum — before a buy or sell signal is plotted.
Gradient Oscillator Visualization:
Signals appear as a fading oscillator line with a gradient-filled area beneath it. The color intensity represents how “fresh” or “strong” the signal is, fading over time if not reconfirmed, offering both clarity and signal aging at a glance.
🔧 User Inputs:
🧠 Core Settings:
Source: Select the price input (default: close)
Bollinger Bands Length: Period for BB basis and deviation
Bollinger Bands Multiplier: Width of the bands
Minimum BB Width (% of Price): Prevents signals during low-volatility chop
📊 BB% Thresholds:
BB% Long Threshold (L): Minimum %B to consider a long
BB% Short Threshold (S): Maximum %B to consider a short
🔍 Trend Filter Parameters:
RMA Length: Period for the smoothed trend baseline
ATR Length: Lookback for ATR in trend deviation filter
⚡️ Momentum Parameters:
Momentum Length: Period for percentile momentum calculation
Mult_75 / Mult_25: ATR-adjusted thresholds for breakout above/below percentile levels
🎨 Visualization:
Bar Coloring: Highlights candles during active signals
Background Coloring: Optional background shading for signals
Show Oscillator Plot: Toggle the gradient-style oscillator
🧪 Use Case:
This indicator works well across all assets for trend identification. It is particularly effective when used on higher timeframes (e.g. 12H, 1D,2D) to capture mean reversion bounces or confirm breakouts backed by percentile momentum and volatility expansion.
⚠️ Notes:
This is not financial advice. Use in combination with proper risk management and confluence from other tools.

BK Multiple MA, RMA, SMA, HMA, VWAP, Rolling VWAP **Indicator Description**
I’m incredibly proud to introduce my third indicator to the TradingView community: **BK Multiple MA with HMA, VWAP, and Rolling VWAP**! This tool has been a game-changer in my trading strategy, and I’m excited to share it with others who are navigating the markets.
This indicator holds a special place in my heart because it represents the first technical analysis concept introduced to me by my mentor when I began apprenticing under him. His wisdom, guidance, and passion for trading—and for life—left an indelible mark on my journey. I dedicate this work, and every indicator I introduce, to the foundation he helped me build, while giving glory first and foremost to God.
**Moving Averages (MAs)** are one of the most widely used tools in technical analysis, and this indicator takes them to the next level. It allows you to plot **six fully customizable moving averages simultaneously**, with options including:
- **Exponential Moving Average (EMA)**
- **Simple Moving Average (SMA)**
- **Relative Moving Average (RMA)**
- **Hull Moving Average (HMA)**
- **Volume Weighted Average Price (VWAP)**
- **Rolling VWAP**
This flexibility makes the indicator highly versatile, whether you’re a day trader, swing trader, or long-term investor. By customizing periods, colors, and line widths for each MA, you can tailor the indicator to perfectly suit your trading style.
**Key Features**
1. **Six Fully Customizable MAs**:
- Adjust periods, line colors, and widths to match your preferences.
- Select from EMA, SMA, RMA, HMA, VWAP, or Rolling VWAP for each line.
2. **Unique Rolling VWAP Option**:
- Rolling VWAP calculates the volume-weighted average price over a user-defined period, such as 200 candles.
- This feature is ideal for traders seeking volume-weighted levels that don’t reset with each session, making it invaluable for trend-following and swing trading.
3. **HMA for Smoother Trends**:
- The Hull Moving Average (HMA) is designed to reduce lag and provide a responsive, noise-free view of price trends.
- It’s a powerful tool for spotting reversals and confirming directional momentum.
4. **Session VWAP**:
- Traditional VWAP resets with each trading session, making it a reliable benchmark for intraday support and resistance levels.
**How It Works**
- **VWAP**: Reflects the average price weighted by volume for the current trading session, commonly used by institutional traders to identify key price levels.
- **Rolling VWAP**: Extends VWAP functionality by calculating over a user-defined period, allowing for flexible multi-timeframe analysis.
- **HMA**: A fast, smooth moving average that reacts quickly to price changes while filtering out noise.
The combination of these options provides traders with a comprehensive view of market dynamics, enabling better decision-making.
**Final Thoughts**
This indicator is deeply meaningful to me because it represents the first concept my mentor introduced when I began apprenticing under him. His wisdom, guidance, and passion for trading—and for life—left an indelible mark on my journey. I dedicate this work, and every indicator I introduce, to the foundation he helped me build, while giving glory first and foremost to God.
If this indicator helps you succeed, I humbly ask that you honor the blessings in your life by giving back—whether through acts of kindness, philanthropy, or helping others in need.
May the Almighty guide us all toward wisdom and success in our endeavors. All glory belongs to God!
EMA/RMA clouds by AlpachinoRE-UPLOAD
The indicator is designed for faster trend determination and also provides hints about whether the trend is strong, weaker, or if a range is expected.
It consists of an exponential moving average (EMA) and a slower smoothed moving average (RMA). I chose these because EMA is the fastest and is respected by the market, while I discovered through practice that the market often respects RMA, and in some cases, even more than EMA. Their combination is necessary because I want to take advantage of the best qualities of both averages. Displaying averages based solely on the close values creates a simple line that the market might respect. However, this is often not the case. Market makers know that many traders still believe in the theory that closing above/below an EMA signals a valid new trend. They commonly apply this belief to EMA200. Traders think that if the market closes below EMA, it signals a downtrend. That’s not necessarily true. This misconception often traps inexperienced traders.
For this reason, my indicator does not include a separate line.
I use what are called envelopes. In other words, for both EMA and RMA, the calculation uses the high and low of the selected period, which can be chosen as an input in the indicator.
Why did I choose high and low?
To stabilize price fluctuations as much as possible, especially to allow enough space for the price to react to the moving average. This reaction occurs precisely between the high and low.
Modes:
EMA Cloud – This is the most common envelope in terms of averages. It shows the best reactions with a period of 50.
What should you observe: the alignment of the envelope or its slope.
Usage:
Breakouts through the entire envelope tend to be strong, which signals that the trend may change. However, what interests you most is that the first test of the envelope after a breakout is the most successful entry point for trades in the breakout direction.
In an uptrend, the first support will be the high of the envelope, and the second (let’s call it the "ultimate support") will be the low of the envelope.
If, during an uptrend, the market closes below the low, be cautious, as the trend may reverse.
If the envelope is broken, trade the retest of the envelope.
In general, if the price is above the envelope, focus on long trades; if it’s below the envelope, focus on short trades.
Double Cloud – Since we already know that highs and lows are more relevant for price respect, I utilized this in the double cloud. Here, I use calculations for EMA and RMA highs and EMA and RMA lows.
The core idea is that since the price often reacts more to RMA than EMA, I wanted to eliminate attempts by market makers to lure you into incorrect directions. By creating more space for the price to react to the highs or lows, I made the cloud fill the area between EMA and RMA highs. This serves as the last zone where the price can hold. If the price breaks above this high cloud during a return, this doesn’t happen randomly—you should pay attention, as it’s likely signaling a range or a trend change.
The same applies to the low cloud for EMA and RMA.
The advantage of the double cloud is that you can see two clouds that may move sideways. This can resemble two walls—and they really act as such.
Usage:
Let’s say we have a downtrend. The market seems to be experiencing a downtrend exhaustion. Here's the behavior you might observe:
The price returns to the EMA/RMA low; the first reaction may still have some strength, but each subsequent return will move higher and higher into the cloud with increasingly smaller rejections downward. This indicates the absorption of selling pressure by bullish pressure. Eventually, the price may close above the cloud, significantly disrupting the downtrend and potentially signaling a reversal.
A confirmation of the reversal is usually seen with a retest of the cloud and a bounce upward into an uptrend.
The second scenario, which you’ll often see, involves sharp and significant moves through both envelopes. This kind of move is the strongest signal of a trend change. However, do not jump into trades immediately—wait for the first retest, which is usually successful. Additional tests may not work, as the breakout might not signify a trend change but rather a range.
When the clouds are far apart, it signals a weak trend or that the market is in a range. You will see that this is generally true. When the clouds cross or overlap, their initial point of contact signals the start of a stronger trend. The steeper the slope, the stronger the trend.
Relative Moving Average (RMA) For Loop [QuantAlgo]Introducing the Relative Moving Averages (RMA) For Loop by QuantAlgo , an innovative technical indicator that combines the smoothness of RMA with an advanced loop-based trend scoring system. Whether you're a day trader looking for high-probability entries or a medium- to long-term investor seeking trend confirmations, this indicator offers a fresh perspective and high-quality signals on market momentum!
💫 Core Architecture
At its heart, the RMA For Loop uses a unique approach to trend detection. Unlike traditional moving average systems that only look at current price relationships, this indicator employs a loop-based scoring mechanism that analyzes historical RMA relationships. Think of it as having multiple trend-confirmation checkpoints - each bar is evaluated against its predecessors to build a comprehensive trend score. This smart scoring system helps filter out market noise while catching meaningful trend reversals.
📊 Technical Foundation
The indicator combines two powerful components:
1/ Relative Moving Average (RMA): A sophisticated moving average that provides smoother price action interpretation than simple or exponential moving averages
2/ For Loop Analysis: A dynamic scoring system that evaluates how current RMA values stack up against historical levels, creating a momentum-based trend score
The magic happens when these components work together:
→ The RMA smooths out price action, reducing false signals
→ The For Loop system analyzes multiple historical points to validate trend strength
→ Crossover confirmations add an extra layer of validation
→ Visual cues provide instant feedback on trend direction and changes
📈 Key Features & Signals
The RMA For Loop provides clear, actionable signals through:
Color-coded RMA line that adapts to trend direction
Dynamic fills between price and RMA for enhanced visualization
Trend change markers (⌽) that pinpoint potential reversal points
Smart bar coloring that helps you "feel" the market's pulse
Customizable alerts for both bullish and bearish reversals
🎯 Practical Usage Tips
Here's how to get the most out of the RMA For Loop:
1/ Initial Setup:
Add the indicator to your TradingView chart by clicking on the star icon to add it to your favorites ⭐️
Start with the default RMA length of 55 for balanced sensitivity
Use the standard loop range (1-70) for comprehensive trend analysis
Adjust threshold levels based on your trading style (higher for fewer but stronger signals)
2/ Reading Signals:
Watch for trend change markers (⌽) - they indicate validated trend reversals
Pay attention to RMA line color changes - they confirm trend direction
Monitor bar colors for additional trend confirmation
Configure alerts for trend changes in both bullish and bearish directions, ensuring you never miss significant technical developments.
⚡️ Pro Tips
Fine-tune the RMA length based on your timeframe:
→ Lower values (20-40) for more responsive signals
→ Higher values (60-100) for stronger trend confirmation
Adjust threshold levels based on market volatility:
→ Increase thresholds in choppy markets
→ Standard settings work well in trending markets
Combine with volume analysis and/or other system(s) for additional confirmation
Use multiple timeframes for a complete market picture

Adaptive Fibonacci Trend Ribbon[FibonacciFlux]Adaptive Fibonacci Trend Ribbon (FibonacciFlux)
Overview
The Adaptive Fibonacci Trend Ribbon is a versatile technical analysis tool designed for traders who want to leverage the power of multiple moving averages while integrating Fibonacci numbers. This indicator provides a dynamic visual representation of market trends, enhancing decision-making processes in trading.
Key Features
1. Multi-Moving Averages
- The indicator calculates eight different moving averages based on user-defined periods, including Fibonacci numbers such as 5, 8, 13, 21, 34, 55, 89, and 144.
- Traders can choose from various moving average types, including EMA, HMA, WMA, VWMA, ALMA, SMA, RMA, and TMA , allowing for tailored analysis based on market conditions.
2. Trend Detection
- Each moving average is color-coded based on its trend direction, with green indicating an upward trend and red indicating a downward trend.
- This visual clarity helps traders quickly assess market sentiment and make informed decisions.
3. Fill Areas for Enhanced Insight
- The indicator features fill areas between the moving averages, which dynamically change color according to their relative positions.
- This provides a clear visual cue of trend strength and potential reversal points, allowing traders to identify key areas of interest.
4. Customizable Inputs
- Users can easily adjust the source data, moving average lengths, and ALMA parameters (offset and sigma) to fit their trading strategies.
- This flexibility ensures that traders can adapt the tool to various market conditions and personal preferences.
Insights and Applications
1. Fibonacci Integration
- By incorporating Fibonacci numbers into the moving average periods, this indicator allows traders to align their strategies with key levels of support and resistance.
- This can enhance the accuracy of entry and exit points, particularly in trending markets.
2. Trend Continuation and Reversal Analysis
- The adaptive nature of the moving averages provides insights into potential trend continuations or reversals.
- Traders can use the indicator to identify when to enter or exit positions based on the interaction between the moving averages.
3. Visual Clarity for Quick Decisions
- The color-coded moving averages and fill areas offer immediate visual feedback on market conditions, helping traders react swiftly to changing dynamics.
- This is especially useful in fast-moving markets where timely decisions are critical.
Conclusion
The Adaptive Fibonacci Trend Ribbon is an essential tool for traders looking to enhance their technical analysis capabilities. By combining multiple moving averages with Fibonacci integration and dynamic visual cues, this indicator offers a robust framework for understanding market trends. Its flexibility and clarity make it an invaluable asset for both novice and experienced traders alike.
Open Source Contribution
This indicator is open source, inviting contributions and improvements from the trading community. Feel free to fork, enhance, and share your insights with the world, helping to foster a collaborative environment for traders everywhere.

Pulse Oscillator [UAlgo]The "Pulse Oscillator " is a trading tool designed to capture market momentum and trend changes by combining the strengths of multiple well-known technical indicators. By integrating the RSI (Relative Strength Index), CCI (Commodity Channel Index), and Stochastic Oscillator, this indicator provides traders with a comprehensive view of market conditions, offering both trend filtering and precise buy/sell signals. The oscillator is customizable, allowing users to fine-tune its parameters to match different trading strategies and timeframes. With its built-in smoothing techniques and level adjustments, the Pulse Oscillator aims to be a reliable tool for both trend-following and counter-trend trading strategies.
🔶 Key Features
Multi-Indicator Integration: Combines RSI, CCI, and Stochastic Oscillator to create a weighted momentum oscillator.
Why Use Multi-Indicator Integration?
Script uses Multi-Indicator Integration to combine the strengths of different technical indicators—such as RSI, CCI, and Stochastic Oscillator—into a single tool. This approach helps to reduce the weaknesses of individual indicators, providing a more comprehensive and reliable analysis of market conditions. By integrating multiple indicators, we can generate more accurate signals, filter out noise, and enhance our trading decisions.
Customizable Parameters: Allows users to adjust weights, periods, and smoothing techniques, providing flexibility to adapt the indicator to various market conditions.
Trend Filtering Option: An optional trend filter is available to enhance the accuracy of buy and sell signals, reducing the risk of false signals in choppy markets.
Dynamic Levels: The indicator dynamically calculates multiple levels of support and resistance, adjusting to market conditions with customizable decay factors and offsets.
Visual Clarity: The indicator visually represents different levels and trends with color-coded plots and fills, making it easier for traders to interpret market conditions at a glance.
Alerts: Configurable alerts for buy and sell signals, as well as trend changes, enabling traders to stay informed of key market movements without constant monitoring.
🔶 Interpreting the Indicator
Buy Signal: A buy signal is generated when the Slow Line crosses under the Fast Line during an uptrend or when the trend filter is disabled. This indicates a potential bullish reversal or continuation of an upward trend.
Sell Signal: A sell signal occurs when the Slow Line crosses above the Fast Line during a downtrend or when the trend filter is disabled, signaling a potential bearish reversal or continuation of a downward trend.
Trend Change: The indicator detects trend changes when the Fast Line shifts from increasing to decreasing or vice versa, providing early warning of possible market reversals.
Dynamic Levels: The indicator calculates upper and lower levels based on the Fast Line's values. These levels can be used to identify overbought or oversold conditions and potential areas of support or resistance.
🔶 Disclaimer
Use with Caution: This indicator is provided for educational and informational purposes only and should not be considered as financial advice. Users should exercise caution and perform their own analysis before making trading decisions based on the indicator's signals.
Not Financial Advice: The information provided by this indicator does not constitute financial advice, and the creator (UAlgo) shall not be held responsible for any trading losses incurred as a result of using this indicator.
Backtesting Recommended: Traders are encouraged to backtest the indicator thoroughly on historical data before using it in live trading to assess its performance and suitability for their trading strategies.
Risk Management: Trading involves inherent risks, and users should implement proper risk management strategies, including but not limited to stop-loss orders and position sizing, to mitigate potential losses.
No Guarantees: The accuracy and reliability of the indicator's signals cannot be guaranteed, as they are based on historical price data and past performance may not be indicative of future results.

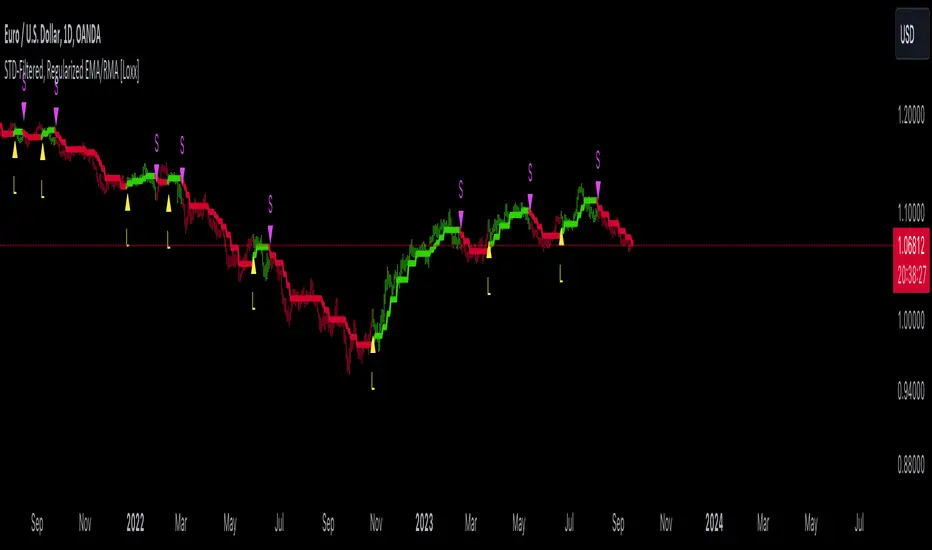
GKD-C STD-Filtered, REMA EMA/RMA [Loxx]The Giga Kaleidoscope GKD-C STD-Filtered, REMA EMA/RMA is a confirmation module included in Loxx's "Giga Kaleidoscope Modularized Trading System."
█ GKD-C STD-Filtered, REMA EMA/RMA
STD-Filtered, Regularized EMA/RMA calculates and visualizes a standard deviation (STD) filtered, regularized version of the Exponential Moving Average (EMA) or Regular Moving Average (RMA) on a trading chart.
Understanding the Regularized Moving Average
The Regularized Moving Average, as conceptualized by Chris Satchwell, offers a more responsive interpretation compared to traditional moving averages. By incorporating a smoothing mechanism using "Lambda", this approach reduces lag without compromising the data's integrity.
In the realm of technical analysis, many regard it as a preferred alternative to the standard Moving Average and Exponential Moving Average.
How Does It Stand Out from Other Moving Averages?
While analysts traditionally shorten an indicator's length or period to minimize lag, the Regularized Moving Average uses a unique approach. By embedding "Regularization" within its computation, this method introduces Lambda (often symbolized as λ-calculus). This mathematical factor tames the moving average's undue fluctuations, offering more stability through its Lambda adjustments.
Pro Tip: For those analyzing smaller intraday timeframes, consider ramping up the Lambda setting to 6.0 or even higher. When tweaking these settings, always remember to backtest and observe how it impacts signal accuracy and noise filtering.
Standard Deviation Filtering:
This filtering mechanism is designed to smoothen price data by eliminating minor fluctuations that might be considered "noise". Here's how the process works:
For every data point, the standard deviation of prices over a specified period is calculated.
This standard deviation is then multiplied by a user-defined value to determine a threshold. This threshold defines the magnitude of change required in the price for it to be considered significant.
For each price, if the absolute difference between its current and previous value is less than this threshold, the price is kept unchanged (considered insignificant and thus filtered). If the difference exceeds the threshold, the price is considered significant and remains as is.
By applying this filter, minor price variations within the threshold are disregarded, resulting in a smoother representation of the price data.
Moving Average Calculation:
The script provides an option to calculate either a regularized Exponential Moving Average (EMA) or a Regular Moving Average (RMA). Here's how these are approached:
If the EMA option is selected: A weighted formula is used where more recent prices have a higher influence on the average than older prices. This is achieved by applying a fraction that's inversely related to the chosen period. The outcome is an average that reacts more quickly to recent price changes.
If the RMA option is selected: The average is computed by giving equal weight to all prices within the chosen period.
Both these averages then undergo a regularization process. Regularization, in this context, refers to adjusting the moving average using a factor to make it potentially more sensitive or responsive to price changes.
This regularized moving average can offer a refined perspective on price trends by being more adaptive to recent changes, potentially highlighting turning points or trend continuations more effectively.
█ Giga Kaleidoscope Modularized Trading System
Core components of an NNFX algorithmic trading strategy
The NNFX algorithm is built on the principles of trend, momentum, and volatility. There are six core components in the NNFX trading algorithm:
1. Volatility - price volatility; e.g., Average True Range, True Range Double, Close-to-Close, etc.
2. Baseline - a moving average to identify price trend
3. Confirmation 1 - a technical indicator used to identify trends
4. Confirmation 2 - a technical indicator used to identify trends
5. Continuation - a technical indicator used to identify trends
6. Volatility/Volume - a technical indicator used to identify volatility/volume breakouts/breakdown
7. Exit - a technical indicator used to determine when a trend is exhausted
8. Metamorphosis - a technical indicator that produces a compound signal from the combination of other GKD indicators*
*(not part of the NNFX algorithm)
What is Volatility in the NNFX trading system?
In the NNFX (No Nonsense Forex) trading system, ATR (Average True Range) is typically used to measure the volatility of an asset. It is used as a part of the system to help determine the appropriate stop loss and take profit levels for a trade. ATR is calculated by taking the average of the true range values over a specified period.
True range is calculated as the maximum of the following values:
-Current high minus the current low
-Absolute value of the current high minus the previous close
-Absolute value of the current low minus the previous close
ATR is a dynamic indicator that changes with changes in volatility. As volatility increases, the value of ATR increases, and as volatility decreases, the value of ATR decreases. By using ATR in NNFX system, traders can adjust their stop loss and take profit levels according to the volatility of the asset being traded. This helps to ensure that the trade is given enough room to move, while also minimizing potential losses.
Other types of volatility include True Range Double (TRD), Close-to-Close, and Garman-Klass
What is a Baseline indicator?
The baseline is essentially a moving average, and is used to determine the overall direction of the market.
The baseline in the NNFX system is used to filter out trades that are not in line with the long-term trend of the market. The baseline is plotted on the chart along with other indicators, such as the Moving Average (MA), the Relative Strength Index (RSI), and the Average True Range (ATR).
Trades are only taken when the price is in the same direction as the baseline. For example, if the baseline is sloping upwards, only long trades are taken, and if the baseline is sloping downwards, only short trades are taken. This approach helps to ensure that trades are in line with the overall trend of the market, and reduces the risk of entering trades that are likely to fail.
By using a baseline in the NNFX system, traders can have a clear reference point for determining the overall trend of the market, and can make more informed trading decisions. The baseline helps to filter out noise and false signals, and ensures that trades are taken in the direction of the long-term trend.
What is a Confirmation indicator?
Confirmation indicators are technical indicators that are used to confirm the signals generated by primary indicators. Primary indicators are the core indicators used in the NNFX system, such as the Average True Range (ATR), the Moving Average (MA), and the Relative Strength Index (RSI).
The purpose of the confirmation indicators is to reduce false signals and improve the accuracy of the trading system. They are designed to confirm the signals generated by the primary indicators by providing additional information about the strength and direction of the trend.
Some examples of confirmation indicators that may be used in the NNFX system include the Bollinger Bands, the MACD (Moving Average Convergence Divergence), and the MACD Oscillator. These indicators can provide information about the volatility, momentum, and trend strength of the market, and can be used to confirm the signals generated by the primary indicators.
In the NNFX system, confirmation indicators are used in combination with primary indicators and other filters to create a trading system that is robust and reliable. By using multiple indicators to confirm trading signals, the system aims to reduce the risk of false signals and improve the overall profitability of the trades.
What is a Continuation indicator?
In the NNFX (No Nonsense Forex) trading system, a continuation indicator is a technical indicator that is used to confirm a current trend and predict that the trend is likely to continue in the same direction. A continuation indicator is typically used in conjunction with other indicators in the system, such as a baseline indicator, to provide a comprehensive trading strategy.
What is a Volatility/Volume indicator?
Volume indicators, such as the On Balance Volume (OBV), the Chaikin Money Flow (CMF), or the Volume Price Trend (VPT), are used to measure the amount of buying and selling activity in a market. They are based on the trading volume of the market, and can provide information about the strength of the trend. In the NNFX system, volume indicators are used to confirm trading signals generated by the Moving Average and the Relative Strength Index. Volatility indicators include Average Direction Index, Waddah Attar, and Volatility Ratio. In the NNFX trading system, volatility is a proxy for volume and vice versa.
By using volume indicators as confirmation tools, the NNFX trading system aims to reduce the risk of false signals and improve the overall profitability of trades. These indicators can provide additional information about the market that is not captured by the primary indicators, and can help traders to make more informed trading decisions. In addition, volume indicators can be used to identify potential changes in market trends and to confirm the strength of price movements.
What is an Exit indicator?
The exit indicator is used in conjunction with other indicators in the system, such as the Moving Average (MA), the Relative Strength Index (RSI), and the Average True Range (ATR), to provide a comprehensive trading strategy.
The exit indicator in the NNFX system can be any technical indicator that is deemed effective at identifying optimal exit points. Examples of exit indicators that are commonly used include the Parabolic SAR, the Average Directional Index (ADX), and the Chandelier Exit.
The purpose of the exit indicator is to identify when a trend is likely to reverse or when the market conditions have changed, signaling the need to exit a trade. By using an exit indicator, traders can manage their risk and prevent significant losses.
In the NNFX system, the exit indicator is used in conjunction with a stop loss and a take profit order to maximize profits and minimize losses. The stop loss order is used to limit the amount of loss that can be incurred if the trade goes against the trader, while the take profit order is used to lock in profits when the trade is moving in the trader's favor.
Overall, the use of an exit indicator in the NNFX trading system is an important component of a comprehensive trading strategy. It allows traders to manage their risk effectively and improve the profitability of their trades by exiting at the right time.
What is an Metamorphosis indicator?
The concept of a metamorphosis indicator involves the integration of two or more GKD indicators to generate a compound signal. This is achieved by evaluating the accuracy of each indicator and selecting the signal from the indicator with the highest accuracy. As an illustration, let's consider a scenario where we calculate the accuracy of 10 indicators and choose the signal from the indicator that demonstrates the highest accuracy.
The resulting output from the metamorphosis indicator can then be utilized in a GKD-BT backtest by occupying a slot that aligns with the purpose of the metamorphosis indicator. The slot can be a GKD-B, GKD-C, or GKD-E slot, depending on the specific requirements and objectives of the indicator. This allows for seamless integration and utilization of the compound signal within the GKD-BT framework.
How does Loxx's GKD (Giga Kaleidoscope Modularized Trading System) implement the NNFX algorithm outlined above?
Loxx's GKD v2.0 system has five types of modules (indicators/strategies). These modules are:
1. GKD-BT - Backtesting module (Volatility, Number 1 in the NNFX algorithm)
2. GKD-B - Baseline module (Baseline and Volatility/Volume, Numbers 1 and 2 in the NNFX algorithm)
3. GKD-C - Confirmation 1/2 and Continuation module (Confirmation 1/2 and Continuation, Numbers 3, 4, and 5 in the NNFX algorithm)
4. GKD-V - Volatility/Volume module (Confirmation 1/2, Number 6 in the NNFX algorithm)
5. GKD-E - Exit module (Exit, Number 7 in the NNFX algorithm)
6. GKD-M - Metamorphosis module (Metamorphosis, Number 8 in the NNFX algorithm, but not part of the NNFX algorithm)
(additional module types will added in future releases)
Each module interacts with every module by passing data to A backtest module wherein the various components of the GKD system are combined to create a trading signal.
That is, the Baseline indicator passes its data to Volatility/Volume. The Volatility/Volume indicator passes its values to the Confirmation 1 indicator. The Confirmation 1 indicator passes its values to the Confirmation 2 indicator. The Confirmation 2 indicator passes its values to the Continuation indicator. The Continuation indicator passes its values to the Exit indicator, and finally, the Exit indicator passes its values to the Backtest strategy.
This chaining of indicators requires that each module conform to Loxx's GKD protocol, therefore allowing for the testing of every possible combination of technical indicators that make up the six components of the NNFX algorithm.
What does the application of the GKD trading system look like?
Example trading system:
Backtest: Multi-Ticker CC Backtest
Baseline: Hull Moving Average
Volatility/Volume: Hurst Exponent
Confirmation 1: Advance Trend Pressure as shown on the chart above
Confirmation 2: uf2018
Continuation: Coppock Curve
Exit: Rex Oscillator
Metamorphosis: Baseline Optimizer
Each GKD indicator is denoted with a module identifier of either: GKD-BT, GKD-B, GKD-C, GKD-V, GKD-M, or GKD-E. This allows traders to understand to which module each indicator belongs and where each indicator fits into the GKD system.
█ Giga Kaleidoscope Modularized Trading System Signals
Standard Entry
1. GKD-C Confirmation gives signal
2. Baseline agrees
3. Price inside Goldie Locks Zone Minimum
4. Price inside Goldie Locks Zone Maximum
5. Confirmation 2 agrees
6. Volatility/Volume agrees
1-Candle Standard Entry
1a. GKD-C Confirmation gives signal
2a. Baseline agrees
3a. Price inside Goldie Locks Zone Minimum
4a. Price inside Goldie Locks Zone Maximum
Next Candle
1b. Price retraced
2b. Baseline agrees
3b. Confirmation 1 agrees
4b. Confirmation 2 agrees
5b. Volatility/Volume agrees
Baseline Entry
1. GKD-B Baseline gives signal
2. Confirmation 1 agrees
3. Price inside Goldie Locks Zone Minimum
4. Price inside Goldie Locks Zone Maximum
5. Confirmation 2 agrees
6. Volatility/Volume agrees
7. Confirmation 1 signal was less than 'Maximum Allowable PSBC Bars Back' prior
1-Candle Baseline Entry
1a. GKD-B Baseline gives signal
2a. Confirmation 1 agrees
3a. Price inside Goldie Locks Zone Minimum
4a. Price inside Goldie Locks Zone Maximum
5a. Confirmation 1 signal was less than 'Maximum Allowable PSBC Bars Back' prior
Next Candle
1b. Price retraced
2b. Baseline agrees
3b. Confirmation 1 agrees
4b. Confirmation 2 agrees
5b. Volatility/Volume agrees
Volatility/Volume Entry
1. GKD-V Volatility/Volume gives signal
2. Confirmation 1 agrees
3. Price inside Goldie Locks Zone Minimum
4. Price inside Goldie Locks Zone Maximum
5. Confirmation 2 agrees
6. Baseline agrees
7. Confirmation 1 signal was less than 7 candles prior
1-Candle Volatility/Volume Entry
1a. GKD-V Volatility/Volume gives signal
2a. Confirmation 1 agrees
3a. Price inside Goldie Locks Zone Minimum
4a. Price inside Goldie Locks Zone Maximum
5a. Confirmation 1 signal was less than 'Maximum Allowable PSVVC Bars Back' prior
Next Candle
1b. Price retraced
2b. Volatility/Volume agrees
3b. Confirmation 1 agrees
4b. Confirmation 2 agrees
5b. Baseline agrees
Confirmation 2 Entry
1. GKD-C Confirmation 2 gives signal
2. Confirmation 1 agrees
3. Price inside Goldie Locks Zone Minimum
4. Price inside Goldie Locks Zone Maximum
5. Volatility/Volume agrees
6. Baseline agrees
7. Confirmation 1 signal was less than 7 candles prior
1-Candle Confirmation 2 Entry
1a. GKD-C Confirmation 2 gives signal
2a. Confirmation 1 agrees
3a. Price inside Goldie Locks Zone Minimum
4a. Price inside Goldie Locks Zone Maximum
5a. Confirmation 1 signal was less than 'Maximum Allowable PSC2C Bars Back' prior
Next Candle
1b. Price retraced
2b. Confirmation 2 agrees
3b. Confirmation 1 agrees
4b. Volatility/Volume agrees
5b. Baseline agrees
PullBack Entry
1a. GKD-B Baseline gives signal
2a. Confirmation 1 agrees
3a. Price is beyond 1.0x Volatility of Baseline
Next Candle
1b. Price inside Goldie Locks Zone Minimum
2b. Price inside Goldie Locks Zone Maximum
3b. Confirmation 1 agrees
4b. Confirmation 2 agrees
5b. Volatility/Volume agrees
Continuation Entry
1. Standard Entry, 1-Candle Standard Entry, Baseline Entry, 1-Candle Baseline Entry, Volatility/Volume Entry, 1-Candle Volatility/Volume Entry, Confirmation 2 Entry, 1-Candle Confirmation 2 Entry, or Pullback entry triggered previously
2. Baseline hasn't crossed since entry signal trigger
4. Confirmation 1 agrees
5. Baseline agrees
6. Confirmation 2 agrees

STD-Filtered, Regularized EMA/RMA [Loxx]STD-Filtered, Regularized EMA/RMA calculates and visualizes a standard deviation (STD) filtered, regularized version of the Exponential Moving Average (EMA) or Regular Moving Average (RMA) on a trading chart.
█ Understanding the Regularized Moving Average
The Regularized Moving Average, as conceptualized by Chris Satchwell, offers a more responsive interpretation compared to traditional moving averages. By incorporating a smoothing mechanism using "Lambda", this approach reduces lag without compromising the data's integrity.
In the realm of technical analysis, many regard it as a preferred alternative to the standard Moving Average and Exponential Moving Average.
█ How Does It Stand Out from Other Moving Averages?
While analysts traditionally shorten an indicator's length or period to minimize lag, the Regularized Moving Average uses a unique approach. By embedding "Regularization" within its computation, this method introduces Lambda (often symbolized as λ-calculus). This mathematical factor tames the moving average's undue fluctuations, offering more stability through its Lambda adjustments.
Pro Tip: For those analyzing smaller intraday timeframes, consider ramping up the Lambda setting to 6.0 or even higher. When tweaking these settings, always remember to backtest and observe how it impacts signal accuracy and noise filtering.
█ Standard Deviation Filtering:
This filtering mechanism is designed to smoothen price data by eliminating minor fluctuations that might be considered "noise". Here's how the process works:
For every data point, the standard deviation of prices over a specified period is calculated.
This standard deviation is then multiplied by a user-defined value to determine a threshold. This threshold defines the magnitude of change required in the price for it to be considered significant.
For each price, if the absolute difference between its current and previous value is less than this threshold, the price is kept unchanged (considered insignificant and thus filtered). If the difference exceeds the threshold, the price is considered significant and remains as is.
By applying this filter, minor price variations within the threshold are disregarded, resulting in a smoother representation of the price data.
█ Moving Average Calculation:
The script provides an option to calculate either a regularized Exponential Moving Average (EMA) or a Regular Moving Average (RMA). Here's how these are approached:
If the EMA option is selected: A weighted formula is used where more recent prices have a higher influence on the average than older prices. This is achieved by applying a fraction that's inversely related to the chosen period. The outcome is an average that reacts more quickly to recent price changes.
If the RMA option is selected: The average is computed by giving equal weight to all prices within the chosen period.
Both these averages then undergo a regularization process. Regularization, in this context, refers to adjusting the moving average using a factor to make it potentially more sensitive or responsive to price changes.
This regularized moving average can offer a refined perspective on price trends by being more adaptive to recent changes, potentially highlighting turning points or trend continuations more effectively.
█ Extras
Signals
Alerts
Bar coloring
Moving Average Lab - by InFinitoThe Moving Average Lab allows to create any possible combination of up to 3 given MAs. It is meant to help you find the perfect MA that fits your style, strategy and market type.
This script allows to average, weight, double and triple multiple types and lengths of Moving Averages
Currently supported MA types are:
SMA
EMA
VWMA
WMA
SMMA (RMA)
HMA
LSMA
DEMA
TEMA
Features:
- Double or Triple any type of Moving Average using the same logic used for calculating DEMAs and TEMAs:
In the following example you can see a normal, double and triple 200 VWMA
- Average 2 or 3 different types and lengths of Moving Average:
In the example you can see the average between a Double LSMA and a SMA
- Weight each MA manually:
The example shows the average of an HMA and a VWMA with the HMA having a weight of 2 and the VWMA having a weight of 1
- Average up to 3 personalized MAs:
The example shows the average of an EMA + a Double WMA + a Triple SMA with a 3:2:1 weighting
- Average different Moving Averages with different length each:
The example shows the average of an 800 SMA + a 400 VWMA + a 200 EMA

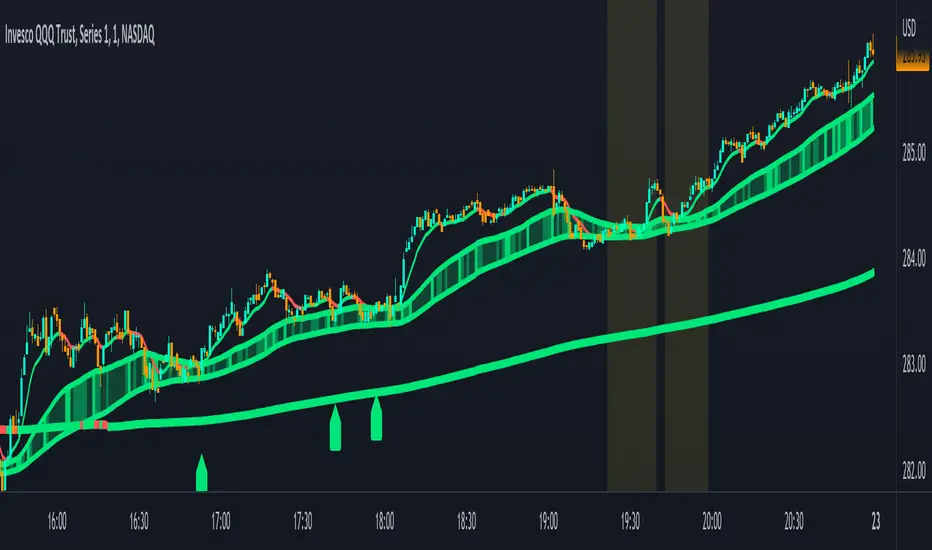
Combined Moving Averages + Squeeze & Volume Spike SignalsThis is a set of 4 combined moving averages. Each moving average is a combination of an EMA, SMA, HMA, RMA, WMA and VWMA with the same length as set in your input settings. All 6 of them are added together and then divided by 6 for an average of all of them. This is based on the theory that most traders use their own preference of moving averages, so combining them all should give us a better idea of where price should actually react since we are using the average of what most traders are using on their charts. It also smooths the moving averages out as well so you get a much easier to read moving average than any of them on their own which should help you hold positions longer and time your entries better.
The default lengths used for this indicator are as follows: 10, 50, 100 and 500. These lengths can be updated in the settings. The 10 and 500 will change colors when the individual moving average is less than or greater than its previous value. Price above or below the moving average does not affect the colors. The 50 and 100 are colored based on whether the 50 is greater/less than the 100.
The two middle length moving averages by default are the 50 and 100. This has been turned into a cloud because it is the area where price typically bounces, since tons of traders use the 50 and 100 moving averages. This should be your long/short zone when price is trending.
Each moving average can be set to use a different source such as close, open, high, low, ohlc4, etc. You can also adjust the length of each moving average. Default settings work well, but feel free to customize them to your liking. You can also change the colors of the lines in the settings.
Beware that changing the lengths of MA #2 and MA #3 will change the signals, squeezes and the cloud.
VOLUME SPIKES
The cloud will change to a brighter color when a volume spike is detected. When a major volume spike is detected, it will turn very bright colored green/red according to the direction of the cloud. This notifies you of volume spikes so you have a better idea of how strong the trend is. If the cloud is a dark green/red then that means that volume is less than or equal to the recent median volume.
SIGNALS
There are also signals that will be given when the current candle is in the cloud, the candle is going in the same direction as the cloud, the MA #2 and MA #3 is going in the same direction and a volume spike is detected. These help you identify good entries when markets are trending. Be cautious of these signals when the trend is sideways and not clearly moving in one direction. The signals can be turned on or off in the settings.
SQUEEZE
Many times when moving averages squeeze together, a big move happens shortly after. Because of this I added a yellow background color when a squeeze is detected. It looks at the median value difference of the MA #2 and MA #3 and if the current value difference is less than the median multiplied by the multiplier in the settings then it will change the background color to notify you. The default value of the multiplier is .6, meaning the squeeze signal will only show if the current value difference of the cloud is less than .6 of the median difference. The multiplier can be adjusted in the settings to suit your preferences. Lower values will only show tighter squeezes.
MARKETS
This indicator can be used on all markets including stocks, crypto, futures and forex.
TIMEFRAMES
This indicator can be used on all timeframes.
PAIRINGS
We recommend pairing this combined moving average with Trend Friend Swing Trade And Scalp Signals for extra confluence. Look for price to bounce in the cloud with good volume and a confirming signal from Trend Friend for highly probable moves.
SUPER MULTI MOVING AVERAGE [Gabbo]📈 Moving Average Indicator Update - Version 2
🔹 New Features and Improvements:
1️⃣ Enhanced MA Selection for Table Lines:
Previously, the indicator did not allow users to choose a different Moving Average type for the table lines. Now, you can select the MA type for the table.
2️⃣ New Table Text Customization Inputs:
Added inputs to choose the table text color and size for a more personalized display.
3️⃣ Improved Input Visibility and Organization:
We’ve reorganized the inputs so that the most commonly used options are now placed at the beginning for quicker and more convenient configuration.
4️⃣ Bug Fixes and Code Improvements:
Minor bugs have been fixed, and the code has been optimized for improved stability and performance. The code is now cleaner and fully functional in version 6.
5️⃣ Cometreon Public Library Integration:
To lighten the code and improve modularity, we’ve integrated the Cometreon public library. This makes the code more efficient and reduces the need to duplicate common functions.
☄️ With this update, the Moving Average indicator becomes even more versatile and user-friendly, offering a refined table interface and enhanced customization options!

Volume xRMAInspired from Volume xSMA.
Few changes from Volume xSMA
1. MA changed from SMA to RMA (better smoothness and filtering)
2. xRMA plot modified to cloumn and stepline combined (for better visibility)
3. Color pallete changed (personal liking)
Thanks for the support.
Mehrdad Banakar - Multiple RMA channelsThis indicator demonstrates 6 different steps RMA moving channels. The channels upper and lower lines show the computing RMA of candles high and candles low, respectively. You can fine the best inputs based on your strategies in different stocks and improve your win rate. Please note that, it is better to use it in higher time frames.

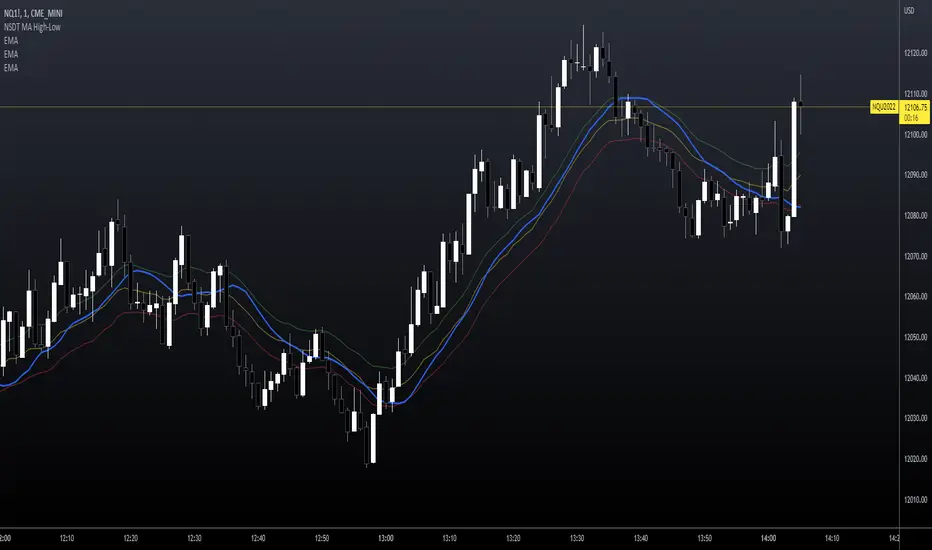
NSDT MA High-LowThis may seem like a pretty basic Moving Average indicator but I haven't seen one that changes the calculation point depending if the market is going up or down.
I've added three EMA's (length of 20) on this sample chart to demonstrate the differences. These are not included with the indicator.
Green, EMA calculated on High
Red, EMA calculated on Low
Yellow, EMA calculated on Close (default)
Blue, EMA calculated on HIGH when rising but on LOW when falling. (looks at 3 candles back to gauge direction)
* * * Note you can choose between 5 different Moving Average types
Notice how the Blue line (when going up it's calculated on the High) is catching up to the Green line (which is already calculated on the High)?
Notice how the Blue line (when going down so it's calculated on the Low) is catching up to the Red line (which is already calculated on the Low)?
This gives a faster response in the direction of the market because it switches between calculating on the High or Low based on market direction.
This script is free and open source.
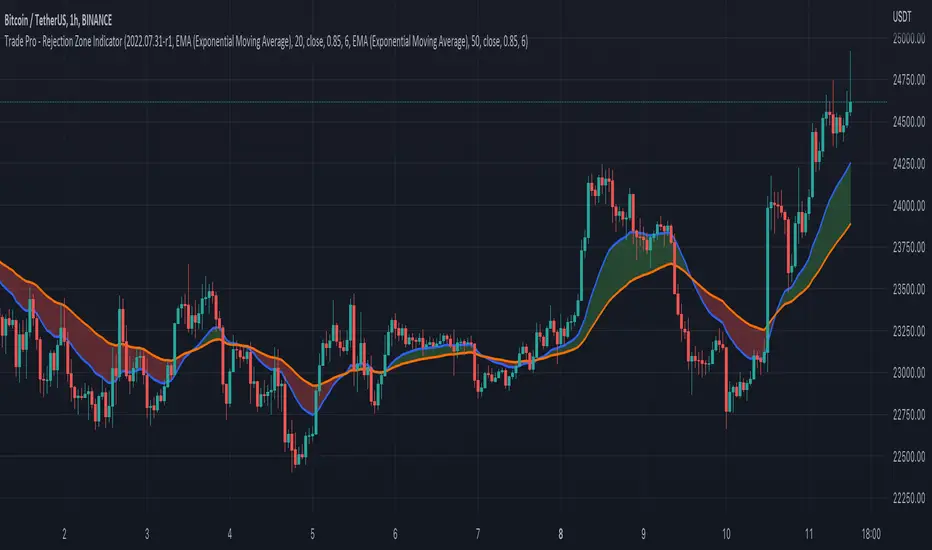
Trade Pro - Rejection Zone IndicatorThe Rejection Zone Indicator can be used to help trend following traders know when to buy dips in up trends, and when to sell pull backs in down trends.
The Rejection Zone Indicator is made up of the 20 and 50 period Exponential Moving Averages. This indicator has colored shading in between these two EMAs, which acts as a nice visual. When the 20 period Exponential Moving Average is below the 50 period Exponential Moving Average, the shaded cloud will be red, and when the 20 EMA is over the 50 EMA the cloud will be green. It is called the Rejection Zone indicator, because often in trends when price pulls back to the colored cloud, it will act as an area of support or resistance.
The suggested use of the Rejection Zone Indicator is to look for long trades when the cloud is green, and once price has pulled back into the green cloud. If the cloud is red one can look for short trading opportunity when price pulls back into the red cloud.
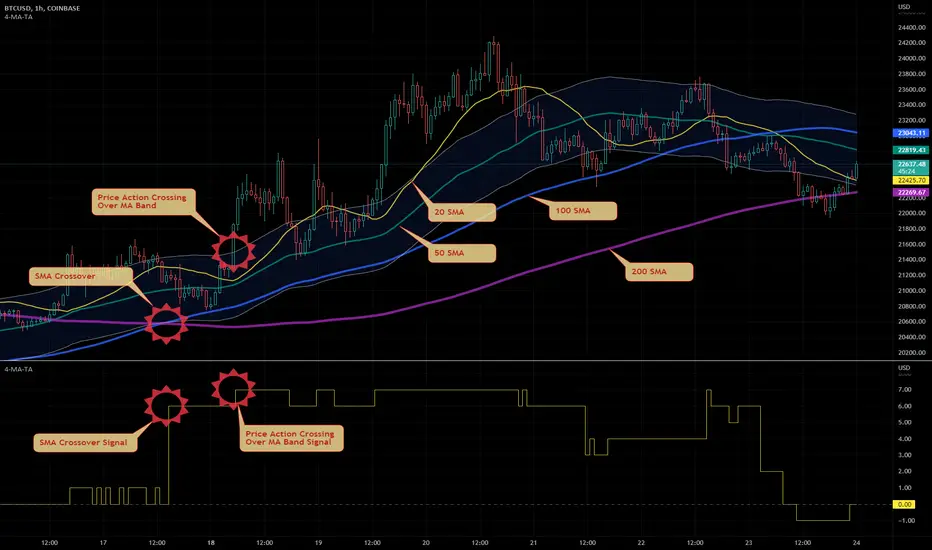
HTF 4 MA Trend Analysis by Prosum SolutionsIntroduction
This indicator will render up to four (4) moving averages on the chart in any higher timeframe and provide a "MA Bullish/Bearish Strength Signal" as a plot output that can be used to link with other indicators on the chart that use the `input.source()` function.
How is it original and useful?
The indicator allows you to use up to four (4) different moving average types of various types, each at different lengths. The moving average types that are supported are:
SMA - Simple Moving Average
EMA - Exponential Moving Average
RMA - RSI Moving Average
WMA - Weighted Moving Average
VWMA - Volume-Weighted Moving Average
SWMA - Symmetrically-Weighted Moving Average
This indicator makes use of the security() function and applies the best-practices as provided by the PineCoders' script called " `security()` revisited PineCoders " so that the indicator will not repaint when you refresh the chart or re-open it at a later date.
What does it do and how does it do it?
Using the four moving averages, each with increasing lengths, allows you to confirm bullish and bearish trends using a weighted rating system to compute a trend strength signal value. Specifically, the indicator provides a plot data series called "MA Bullish/Bullish Strength Signal" the is simply the summation of the bullish/bearish trend weight values between the four moving averages. The bullish/bearish trend weight values are determined by the position of the moving average lines relative to each other. For example, when Moving Average 1 is above Moving Average 2, this is considered a bullish trend and the weight value will be 1. The weight values can be changed to in the settings to define your own specific weights/values to rate the trend strength. The following list defines the meaning of the "MA Bullish/Bullish Strength Signal" value.
-6 = Strong bearish
-2 = Moderate bearish
2 = Moderate bullish
6 = Strong bullish
An additional option allows you to add a band around a specific moving average using a deviation percentage to further evaluate the candles being above or below the upper/lower bands. When the candle's close value is above or below the bands, you can add another weighted value to the signal result. As a result, an additional plot series called "MA Bull/Bear+Band Signal" is provided to include the moving average band weight.
Lastly, the chart example above demonstrates how you can use the indicator as an overlay to the price chart or as a separate panel above or below the price chart. The indicator can change what to plot based on an input setting called "Display Mode". When set to `Overlay`, the indicator will draw only the MA and MA Band plots. When set to `Pane`, the indicator will draw only the signal plots over a zero line to visualize the signal changes with the chart events.
Enjoy! 😊👍
EMA ON MA SETSOORY FOR MY EINGLISH
ITS NOT MY NATIVE AND IM NOT GOING TO GOOGLE TRANSLATE THIS
this is a beuaitful indicator that plot EMA that gat is calc from another ma and length for your choise so you will get an = 'ema on ma '
it can plot you more beautiful results and more smoothing results
i added golden/death cross for all ma
enjoy !
היי חברים זה בעצם אינדיקטור של ממוצע נע על ממוצע נע לנוחיכותכם
הפלט הראשי הוא EMA
הוא לוקח את החישוב שלו ממוצע אחר והאורך שתגדירו
נותן תוצאה יותר חלקה של ממוצעים נעים
הוספתי חתיוכים בין ההמוצעים
תהנו.

[_ParkF]MA_PackageThis indicator is a comprehensive set of moving averages.
All settings are handled in the input menu.
1. 6 moving averages are included.
2. You can edit the source of 6 moving averages.
3. You can change the type of each moving average line.
4. You can change the period value of each moving average line.
5. You can change the color of each moving average line.
6. You can change the thickness of each moving average line.
7. The predictive value of each moving average line will be displayed as a dot, and this value will be changed according to the type of the moving average line.
--------------------------------------------------------------------------------------------------------------------------------------------------------------------------------------------------------
이 지표는 이동평균선의 종합선물세트 입니다.
모든 설정은 input 메뉴에서 다뤄집니다.
1. 6개의 이동평균선이 포함 되어 있습니다.
2. 6개의 이동평균선의 소스를 수정할 수 있습니다.
3. 각각의 이동평균선의 타입을 변경할 수 있습니다.
4. 각각의 이동평균선의 기간값을 변경할 수 있습니다.
5. 각각의 이동평균선의 색상을 변경할 수 있습니다.
6. 각각의 이동평균선의 두께를 변경할 수 있습니다.
7. 각각의 이동평균선의 예측값이 점으로 표시될 것이고 이 값은 해당 이동평균선의 타입에 맞춰 변경됩니다.
Multi Timeframe Moving Average (ema, sma, rma, wma and hma)I use multi timeframe moving averages so that the entries on my trades are in line with the trends of all timeframes. With this script I can plot moving averages for three timeframes in one screen.
Moving averages that have been available include ema, sma, rma, wma and hma.
