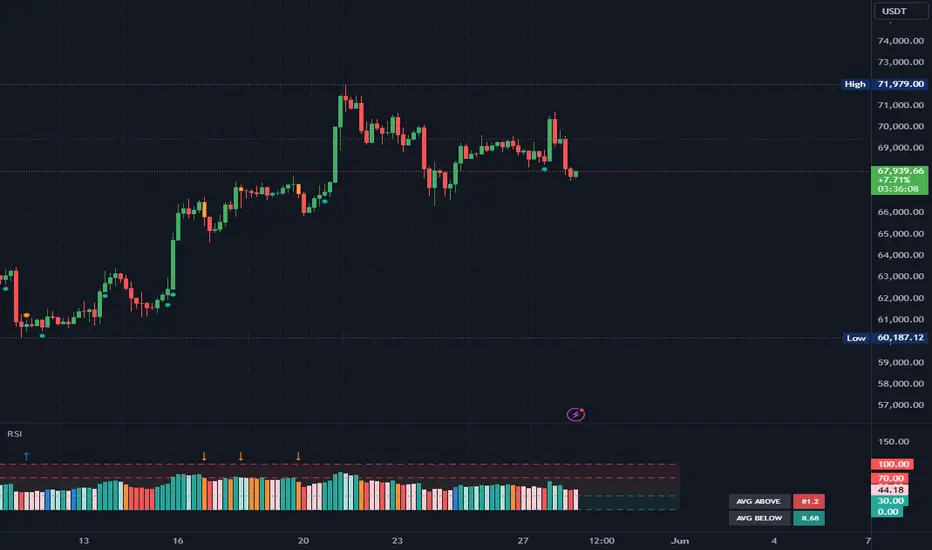
RSI Divergence and GradientThe RSI Divergence and Gradient Indicator simplifies the process of identifying the relationship between price action and the Relative Strength Index (RSI). By integrating RSI data directly into the price chart, traders no longer need to open a separate pane to monitor RSI or manually compare price action and RSI.
This indicator allows traders to easily spot overbought or oversold conditions and detect divergences between price and RSI. These signals can help identify potential reversal points and more effectively assess trend strength.
Features
RSI Divergences: The script identifies and plots bullish and bearish RSI divergences, which can signal potential reversals. Bullish divergences are indicated by an upward triangle below the price bars, while bearish divergences are indicated by a downward triangle above the price bars.
Overbought/Oversold Gradient: The script uses a color gradient to highlight overbought and oversold conditions on the chart, helping traders visualize momentum and trend strength. The gradient dynamically adjusts based on RSI values, transitioning through different colors to represent the intensity of overbought or oversold conditions.
Customizable Gradient: The gradient is customizable, allowing traders to set their own thresholds for overbought and oversold levels, and to choose the colors that best suit their trading style. This flexibility ensures the indicator can be tailored to individual preferences.
How It Works
RSI Calculation: The indicator calculates RSI using the standard 14-period length by default, but this can be adjusted to suit the trader's needs.
Divergence Detection: The script identifies divergences by comparing the highest and lowest points of the RSI with the corresponding price levels over the RSI period length. When a divergence is detected, it is plotted on the chart to indicate a potential reversal.
Gradient Coloring: The gradient coloring system changes the bar colors based on RSI levels. The color transitions from a neutral tone to specified start and end colors as RSI approaches overbought or oversold thresholds, providing a visual cue for potential overextended market conditions.
Intended Use
This indicator is particularly useful for traders who want to combine momentum analysis with divergence signals to identify potential reversal points or confirm trend strength. The visual gradient aids in quickly assessing market conditions, making it easier to spot high-probability trading opportunities.
Rsidivergence

RSI - Made EasyThis indicator is a visually improved version of RSI. It makes it much easier to see what's happening by simplifying those confusing, intersecting lines. With this, you can detect the RSI direction more clearly. All the features are also explained in the tooltips of the input fields. Some extra features are included, such as average top and bottom calculation, standard deviation and divergences.
Color legend:
Green: RSI Above MA and Rising
Light Green: RSI Above MA and Falling
Red: RSI Below MA and Falling
Light Red: RSI Below MA and Rising
Blue: RSI Crossover MA
Orange: RSI Crossunder MA
Blue Arrow: Bullish Divergence
Orange Arrow: Bearish Divergence
Triple EMA + QQE Trend Following Strategy [TradeDots]The "Triple EMA + QQE Trend Following Strategy" harnesses the power of two sophisticated technical indicators, the Triple Exponential Moving Average (TEMA) and the Qualitative Quantitative Estimation (QQE), to generate precise buy and sell signals. This strategy excels in capturing shifts in trends by identifying short-term price momentum and dynamic overbought or oversold conditions.
HOW IT WORKS
This strategy integrates two pivotal indicators:
Triple Exponential Moving Average (TEMA): TEMA enhances traditional moving averages by reducing lag and smoothing the data more effectively. It achieves this by applying the EMA formula three times onto the price, as follows:
tema(src, length) =>
ema1 = ta.ema(src, length)
ema2 = ta.ema(ema1, length)
ema3 = ta.ema(ema2, length)
tema = 3*ema1 - 3*ema2 + ema3
This computation helps to sharpen the sensitivity to price movements.
Qualitative Quantitative Estimation (QQE): The QQE indicator improves upon the standard RSI by incorporating a smoothing mechanism. It starts with the standard RSI, overlays a 5-period EMA on this RSI, and then enhances the result using a double application of a 27-period EMA. A slow trailing line is then derived by multiplying the result with a factor number. This approach establishes a more refined and less jittery trend-following signal, complementing the TEMA to enhance overall market timing during fluctuating conditions.
APPLICATION
Referenced from insights on "Trading Tact," the strategy implementation follows:
First of all, we utilize two TEMA lines: one set at a 20-period and the other at a 40-period. Then following the rules below:
40-period TEMA is rising
20-period TEMA is above 40-period TEMA
Price closes above 20-period TEMA
Today is not Monday
RSI MA crosses the Slow trailing line
This strategy does not employ an active take profit mechanism; instead, it utilizes a trailing stop loss to allow the price to reach the stop loss naturally, thereby maximizing potential profit margins.
DEFAULT SETUP
Commission: 0.01%
Initial Capital: $10,000
Equity per Trade: 80%
Users are advised to adjust and personalize this trading strategy to better match their individual trading preferences and style.
RISK DISCLAIMER
Trading entails substantial risk, and most day traders incur losses. All content, tools, scripts, articles, and education provided by TradeDots serve purely informational and educational purposes. Past performances are not definitive predictors of future results.
Reference:
Trading Tact. What Is the QQE Indicator? Retrieved from: tradingtact.com

RSI Multi Strategies With Overlay SignalsHello everyone,
In this indicator, you will find 6 different entry and exit signals based on the RSI :
Entry into overbought and oversold zones
Exit from overbought and oversold zones
Crossing the 50 level
RSI cross RSI MA below or above the 50 level
RSI cross RSI MA in the overbought or oversold zones
RSI Divergence
With the signals identified, you can create your own strategy . (If you have any suggestions, please mention them in the comments).
Beyond these signals, you can set SL (Stop Loss) and TP (Take Profit) levels to better manage your positions.
SL Methods:
Percentage: The stop loss is determined by the percentage you specify.
ATR : The stop level is determined based on the Average True Range (ATR).
TP Methods:
Percentage: The take profit is determined by the percentage you specify.
RR ( Risk Reward ): The take profit level is determined based on the distance from the stop level.
You can mix and match these options as you like.
What makes the indicator unique and effective is its ability to display the RSI in the bottom chart and the signals, SL (Stop Loss), and TP (Take Profit) levels in the overlay chart simultaneously. This feature allows you to manage your trading quickly and easily without the need for using two separate indicators.
Let's try out a few strategies together.
My entry signal: RSI Entered OS (Oversold) Zone
My exit signal: RSI Entered OB (Overbought) Zone
I'm not using a stoploss for this strategy ("Fortune favors the brave").
Let's keep ourselves safe by adding a stop loss.
I'm adding an ATR-based stop loss.
I think it's better now.
If you have any questions or suggestions about the indicator, you can contact me.
Cheers

Divergence Detector [TradingFinder] RSI + MACD + AO Oscillator 🔵 Introduction
🟣 Understanding Divergence
As mentioned, divergence occurs in technical analysis when a stock's price behaves contrary to indicators on the price chart. Divergence can signify either a reversal of the stock's trend or a continuation of the previous trend correction.
Divergences can act as reversal patterns or continuation patterns. Moreover, divergences can be utilized to identify potential support and resistance levels.
For instance, when an indicator is trending upwards and positive, but the price is declining and trending downwards, divergence occurs. Divergence in a stock indicates trader indecision in buying and selling and warns traders to reconsider their decisions regarding buying or holding the stock.
Divergence aids analysts in identifying critical price points. In indicator divergences, it serves as a potent signal in the realm of technical analysis.
🟣 Types of Divergence
1.Regular Divergence
o Positive Regular Divergence (RD+)
o Negative Regular Divergence (RD-)
2.Hidden Divergence
o Positive Hidden Divergence (HD+)
o Negative Hidden Divergence (HD-)
3.Time Divergence
Key Note : This indicator is specifically designed to identify "Regular Divergence" only. Therefore, the following explanation pertains to this type of divergence.
🔵 Regular Divergence/Convergence
Regular Divergence(Convergence) occurs due to conflicting behavior between the indicator and the price chart, typically at the end of a trend. Recognizing Regular Divergence suggests an anticipation of a trend reversal or a pattern resembling a reversal.
🟣 Positive Regular Divergence (RD+)
In contrast to negative divergence, positive Regular Divergence occurs at the end of a downtrend and between two price lows. It manifests when the price forms a new low on the price chart, but the indicator fails to recognize it.
Positive Regular Divergence indicates strong buying pressure and weak selling pressure. Following the identification of positive divergence on the chart, one can anticipate a price increase for the examined stock.
🟣 Negative Regular Divergence (RD-)
This type of Regular Divergence emerges between two price highs during an uptrend. A new high is formed on the price chart, but the indicator fails to acknowledge it. This scenario indicates negative Regular Divergence.
The likelihood of a subsequent market downturn is high. Negative divergence signifies strong selling pressure and weak buying pressure, suggesting an unfavorable future for the stock.
🔵 How to use
By utilizing the "Fractal Period" input, you can specify your desired periods for identifying divergences.
Additionally, through the "Divergence Detect Method" feature, you can choose which oscillators (MACD, RSI, or AO) to base divergence identification on.
Divergence in MACD Oscillator :
Divergence in the MACD indicator occurs when the price chart and the MACD line form a noticeable opposing pattern, meaning the price moves contrary to the MACD line. In this scenario, one expects a reversal in price direction.
Divergence in RSI Oscillator :
If divergence occurs during a downtrend on the price chart (two consecutive lows, with the second low being lower) and on the corresponding RSI point (two consecutive lows, with the second low being higher), it signifies positive Regular Divergence and implies a buying signal.
Conversely, if divergence occurs during an uptrend on the price chart (two consecutive highs, with the second high being higher) and on the corresponding RSI point (two consecutive highs, with the second high being lower), it indicates negative Regular Divergence, signaling a selling opportunity.
Divergence in AO Oscillator :
The AO indicator calculates histograms similar to the AO base. It calculates the difference between the simple moving averages of 5 and 34 periods based on the median of each bar. Then, it plots the bars based on the difference.
It then compares the histograms to detect peaks and troughs in the AO histograms and compares the identified peaks and troughs to the price. Whenever divergence is detected, it plots lines and arrows.
🔵 Table
The table contains information on the functional features of this oscillator that you can utilize. Four categories of information are presented in the table: "Exist," "Consecutive," "Divergence Quality," and "Change Phase Indicator."
Exist :
If divergence exists, you'll see "+" in this row.
Consecutive :
Divergences may occur consecutively. If same-type divergences form within short intervals, you can observe the count in this row.
Divergence Quality : Based on the number of consecutive divergences, their quality can be evaluated. If one divergence exists, its quality is considered "Normal." If two divergences exist, the quality is "Good," and if three or more divergences exist, the quality is considered "Strong."
Change Phase Indicator : If a phase change occurs between two oscillation peaks formed based on divergence, this change is identified and displayed in this row.

Heikin Ashi RSI + OTT [Erebor]Relative Strength Index (RSI)
The Relative Strength Index (RSI) is a popular momentum oscillator used in technical analysis to measure the speed and change of price movements. Developed by J. Welles Wilder, the RSI is calculated using the average gains and losses over a specified period, typically 14 days. Here's how it works:
Description and Calculation:
1. Average Gain and Average Loss Calculation:
- Calculate the average gain and average loss over the chosen period (e.g., 14 days).
- The average gain is the sum of gains divided by the period, and the average loss is the sum of losses divided by the period.
2. Relative Strength (RS) Calculation:
- The relative strength is the ratio of average gain to average loss.
The RSI oscillates between 0 and 100. Traditionally, an RSI above 70 indicates overbought conditions, suggesting a potential sell signal, while an RSI below 30 suggests oversold conditions, indicating a potential buy signal.
Pros of RSI:
- Identifying Overbought and Oversold Conditions: RSI helps traders identify potential reversal points in the market due to overbought or oversold conditions.
- Confirmation Tool: RSI can be used in conjunction with other technical indicators or chart patterns to confirm signals, enhancing the reliability of trading decisions.
- Versatility: RSI can be applied to various timeframes, from intraday to long-term charts, making it adaptable to different trading styles.
Cons of RSI:
- Whipsaws: In ranging markets, RSI can generate false signals, leading to whipsaws (rapid price movements followed by a reversal).
- Not Always Accurate: RSI may give false signals, especially in strongly trending markets where overbought or oversold conditions persist for extended periods.
- Subjectivity: Interpretation of RSI levels (e.g., 70 for overbought, 30 for oversold) is somewhat subjective and can vary depending on market conditions and individual preferences.
Checking RSIs in Different Periods:
Traders often use multiple timeframes to analyze RSI for a more comprehensive view:
- Fast RSI (e.g., 8-period): Provides more sensitive signals, suitable for short-term trading and quick decision-making.
- Slow RSI (e.g., 32-period): Offers a smoother representation of price movements, useful for identifying longer-term trends and reducing noise.
By comparing RSI readings across different periods, traders can gain insights into the momentum and strength of price movements over various timeframes, helping them make more informed trading decisions. Additionally, divergence between fast and slow RSI readings may signal potential trend reversals or continuation patterns.
Heikin Ashi Candles
Let's consider a modification to the traditional “Heikin Ashi Candles” where we introduce a new parameter: the period of calculation. The traditional HA candles are derived from the open 01, high 00 low 00, and close 00 prices of the underlying asset.
Now, let's introduce a new parameter, period, which will determine how many periods are considered in the calculation of the HA candles. This period parameter will affect the smoothing and responsiveness of the resulting candles.
In this modification, instead of considering just the current period, we're averaging or aggregating the prices over a specified number of periods . This will result in candles that reflect a longer-term trend or sentiment, depending on the chosen period value.
For example, if period is set to 1, it would essentially be the same as traditional Heikin Ashi candles. However, if period is set to a higher value, say 5, each candle will represent the average price movement over the last 5 periods, providing a smoother representation of the trend but potentially with delayed signals compared to lower period values.
Traders can adjust the period parameter based on their trading style, the timeframe they're analyzing, and the level of smoothing or responsiveness they prefer in their candlestick patterns.
Optimized Trend Tracker
The "Optimized Trend Tracker" is a proprietary trading indicator developed by TradingView user ANIL ÖZEKŞİ. It is designed to identify and track trends in financial markets efficiently. The indicator attempts to smooth out price fluctuations and provide clear signals for trend direction.
The Optimized Trend Tracker uses a combination of moving averages and adaptive filters to detect trends. It aims to reduce lag and noise typically associated with traditional moving averages, thereby providing more timely and accurate signals.
Some of the key features and applications of the OTT include:
• Trend Identification: The indicator helps traders identify the direction of the prevailing trend in a market. It distinguishes between uptrends, downtrends, and sideways consolidations.
• Entry and Exit Signals: The OTT generates buy and sell signals based on crossovers and direction changes of the trend. Traders can use these signals to time their entries and exits in the market.
• Trend Strength: It also provides insights into the strength of the trend by analyzing the slope and momentum of price movements. This information can help traders assess the conviction behind the trend and adjust their trading strategies accordingly.
• Filter Noise: By employing adaptive filters, the indicator aims to filter out market noise and false signals, thereby enhancing the reliability of trend identification.
• Customization: Traders can customize the parameters of the OTT to suit their specific trading preferences and market conditions. This flexibility allows for adaptation to different timeframes and asset classes.
Overall, the OTT can be a valuable tool for traders seeking to capitalize on trending market conditions while minimizing false signals and noise. However, like any trading indicator, it is essential to combine its signals with other forms of analysis and risk management strategies for optimal results. Additionally, traders should thoroughly back-test the indicator and practice using it in a demo environment before applying it to live trading.
The following types of moving average have been included: "SMA", "EMA", "SMMA (RMA)", "WMA", "VWMA", "HMA", "KAMA", "LSMA", "TRAMA", "VAR", "DEMA", "ZLEMA", "TSF", "WWMA". Thanks to the authors.
Thank you for your indicator “Optimized Trend Tracker”. © kivancozbilgic
Thank you for your programming language, indicators and strategies. © TradingView
Kind regards.
© Erebor_GIT

YinYang TrendTrend Analysis has always been an important aspect of Trading. There are so many important types of Trend Analysis and many times it may be difficult to identify what to use; let alone if an Indicator can/should be used in conjunction with another. For these exact reasons, we decided to make YinYang Trend. It is a Trend Analysis Toolkit which features many New and many Well Known Trend Analysis Indicators. However, everything in there is added specifically for the reason that it may work well in conjunction with the other Indicators prevalent within. You may be wondering, why bother including common Trend Analysis, why not make everything unique? Ideally, we would, however, you need to remember Trend Analysis may be one of the most common forms of charting. Therefore, many other traders may be using similar Trend Analysis either through plotting manually or within other Indicators. This all boils down to Psychology; you are trading against other traders, who may be seeing some of the similar information you are, and therefore, you may likewise want to see this information. What affects their trading decisions may affect yours as well.
Now enough about Trend Analysis, what is within this Indicator, and what does it do? Well, first let’s quickly mention all of its components, then we will, through a Tutorial, discuss each individually and finally how each comes together as a cohesive whole. This Indicator features many aspects:
Bull and Bear Signals
Take Profit Signals
Bull and Bear Zones
Information Tables displaying: (Boom Meter, Bull/Bear Strength, Yin/Yang State)
16 Cipher Signals
Extremes
Pivots
Trend Lines
Custom Bollinger Bands
Boom Meter Bar Colors
True Value Zones
Bar Strength Indexes
Volume Profile
There are many things to cover within our Tutorial so let's get started, chronologically from the list above.
Tutorial:
Bull and Bear Signals:
We’ve zoomed out quite a bit for this example to help give you a broader aspect of how these Bull and Bear signals work. When a signal appears, it is displaying that there may be a large amount of Bullish or Bearish Trend Analysis occurring. These signals will remain in their state of Bull or Bear until there is enough momentum change that they change over. There are a couple Options within the Settings that dictate when/where/why these signals appear, and this example is using their default Settings of ‘Medium’. They are, Purchase Speed and Purchase Strength. Purchase Speed refers to how much Price Movement is needed for a signal to occur and Purchase Strength refers to how many verifications are required for a signal to occur. For instance:
'High' uses 15 verifications to ensure signal strength.
'Medium' uses 10 verifications to ensure signal strength.
'Low' uses 5 verifications to ensure signal strength.
'Very Low' uses 3 verifications to ensure signal strength.
By default it is set to Medium (10 verifications). This means each verification is worth 10%. The verifications used are also relevant to the Purchase Speed; meaning they will be verified faster or slower depending on its speed setting. You may find that Faster Speeds and Lower Verifications may work better on Higher Time Frames; and Slower Speeds and Higher Verifications may work better on Lower Time Frames.
We will demonstrate a few examples as to how the Speed and Strength Settings work, and why it may be beneficial to adjust based on the Time Frame you’re on:
In this example above, we’ve kept the same Time Frame (1 Day), and scope; but we’ve changed Purchase Speed from Medium->Fast and Purchase Strength from Medium-Very Low. As you can see, it now generates quite a few more signals. The Speed and Strength settings that you use will likely be based on your trading style / strategy. Are you someone who likes to stay in trades longer or do you like to swing trade daily? Likewise, how do you go about identifying your Entry / Exit locations; do you start on the 1 Day for confirmation, then move to the 15/5 minute for your entry / exit? How you trade may determine which Speed and Strength settings work right for you. Let's jump to a lower Time Frame now so you can see how it works on the 15/5 minute.
Above is what BTC/USDT looks like on the 15 Minute Time Frame with Purchase Speed and Strength set to Medium. You may note that the signals require a certain amount of movement before they get started. This is normal with Medium and the amount of movement is generally dictated by the Time Frame. You may choose to use Medium on a Lower Time Frame as it may work well, but it may also be best to change it to a little slower.
We are still on the 15 Minute Time Frame here, however we simply changed Purchase Speed from Medium->Slow. As you can see, lots of the signals have been removed. Now signals may ‘hold their ground’ for much longer. It is important to adjust your Purchase Speed and Strength Settings to your Time Frame and personalized trading style accordingly.
Above we have now jumped down to the 5 Minute Time Frame. Our Purchase Speed is Slow and our Purchase Strength is Medium. We can see it looks pretty good, although there is some signal clustering going on in the middle there. If we change our Settings, we may be able to get rid of that.
We have changed our Purchase Speed from Slow->Snail (Slowest it can go) and Purchase Strength from Medium->Very Low (Lowest it can go). Changing it from Slow-Snail helped get rid of the signal clustering. You may be wondering why we lowered the Strength from Medium->Very Low, rather than going from Medium->High. This is a use case scenario and one you’ll need to decide for yourself, but we noticed when we changed the Speed from Slow->Snail that the signal clustering was gone, so then we checked both High and Very Low for Strengths to see which produced the best looking signal locations.
Please remember, you don’t have to use it the exact way we’ve displayed in this Tutorial. It is meant to be used to suit your Trading Style and Strategy. This is why we allow you to modify these settings, rather than just automating the change based on Time Frames. You’ll likely need to play around with it, as you’ll notice different settings may work better on certain pairs and Time Frames than others.
Take Profit Signals:
We’ve reset our Purchase Settings, everything is on defaults right now at Medium. We’ve enabled Take Profit signals. As you can see there are both Take Profit signals for the Bulls and the Bears. These signals are not meant to be used within automation. In fact, none of this indicator is. These signals are meant to show there has been a strong change in momentum, to such an extent that the signal may switch from its current (Bull or Bear) and now may be a good time to Take Profit. Your Take Profit Settings likewise has a Speed and Strength, and you can set them differently than your Purchase Settings. This is in case you want to Take Profit in a different manner than your Purchase Signals. For instance:
In the example above we’ve kept Purchase Strength and Speed at Medium but we changed our Take Profit Speed from Medium->Snail and our Take Profit Strength from medium->Very Low. This greatly reduces the amount of Take Profit signals, and in some cases, none are even produced. This form of Take Profit may act more as a Trailing Take Profit that if it’s not hit, nothing appears.
In this example we have changed our Purchase Speed from Medium->Fast, our Purchase Strength from Medium->Very Low. We’ve also changed our Take Profit Speed from Snail->Medium and kept our Take Profit Strength on Very Low. Now we may get our signals quicker and likewise our Take Profit may be more rare. There are many different ways you can set up your Purchase and Take Profit Settings to fit your Trading Style / Strategy.
Bull and Bear Zones:
We have disabled our Take Profit locations so that you can see the Bull and Bear Zones. These zones change color when the Signals switch. They may represent some strong Support and Resistance locations, but more importantly may be useful for visualizing changes in momentum and consolidation. These zones allow you to see various Moving Averages; and when they start to ‘fold’ (cross) each other you may see changes in momentum. Whereas, when they’re fully stretched out and moving all in the same direction, it can provide insight that the current rally may be strong. There is also the case where they look like they’re ‘twisted’ together. This happens when all of the Moving Averages are very close together and may be a sign of Consolidation. We will go over a few examples of each of these scenarios so you can understand what we’re referring to.
In this example above, there are a few different things happening. First we have the yellow circle, where the final and slowest Moving Average (MA) crossed over and now all of the MA’s that form the zone are Bullish. You can see this in the white circle where there are no MA’s that are crossing each other. Lastly, within the blue circle, we can see how some of the faster MA’s are crossing under each other. This is a bullish momentum change. The Faster moving MA’s will always be the first ones to cross before the Slower ones do. There is a color scheme in place here to represent the Speed of the MA within the Zone. Light blue is the fastest moving Bull color -> Light Green and finally -> Dark Green. Yellow is the fastest moving Bear color -> Orange and finally -> Red / Dark Red within the Zone.
Next we will review a couple different examples of what Consolidation looks like and why it is very important to look out for. Consolidation is when Most, if not All of the MA’s are very tightly ‘twisted’ together. There is very little spacing between almost all of the MA’s in the example above; highlighted by the white circle. Consolidation is important as it may indicate a strong price movement in either direction will occur soon. When the price is consolidating it means it has had very little upwards or downwards movement recently. When this happens for long enough, MA’s may all get very similar in value. This may cause high volatility as the price tries to break out of Consolidation. Let's look at another example.
Above we have two more examples of what Consolidation looks like and how high Volatility may occur after the Consolidation is broken. Please note, not all Consolidation will create high Volatility but it is something you may want to look out for.
Information Tables displaying: (Boom Meter, Bull/Bear Strength, Yin/Yang State):
Information tables are a very important way of displaying information. It contains 3 crucial pieces of information:
Boom Meter
Bull/Bear Strength
Yin/Yang State
Boom Meter is a meter that goes from 0-100% and displays whether the current price is Dumping (0 - 29%), Consolidating (30 - 70%) or Pumping (71 - 100%). The Boom Meter is meant to be a Gauge to how the price is currently fairing. It is composed of ~50 different calculations that all vary different weights to calculate its %. Many of the calculations it uses are likewise used in other things, such as the Bull/Bear Strength, Bull/Bear Zone MA cross’, Yin/Yang State, Market Cipher Signals, RSI, Volume and a few others. The Boom Meter, although not meant to be used solely to make purchase decisions, may give you a good idea of current market conditions considering how many different things it evaluates.
Bull/Bear Strength is relevant to your Purchase Speed and Strength. It displays which state it is currently in, and the % it is within that state. When a % hits 0, is when the state changes. When states change, they always start at 100% initially and will go down at the rate of Purchase Strength (how many verifications are needed). For instance, if your Purchase Strength is set to ‘Medium’ it will move 10% per verification +/-, if it is set to High, it will move 6.67% per verification +/-. Bull/Bear Strength is a good indicator of how well that current state is fairing. For instance if you started a Long when the state changed to Bull and now it is currently at Bull with 20% left, that may be a good indication it is time to get out (obviously refer to other data as well, but it may be a good way to know that the state is 20% away from transitioning to Bear).
Yin/Yang State is the strongest MA cross within our Indicator. It is unique in the sense that it is slow to change, but not so much that it moves slowly. It isn’t as simple as say a Golden/Death Cross (50/200), but it crosses more often and may hold similar weight as it. Yin stands for Negative (Bearish) and Yang stands for Positive (Bullish). The price will always be in either a state of Yin or Yang, and just because it is in one, doesn’t mean the price can’t/won’t move in the opposite direction; it simply means the price may be favoring the state it is in.
16 Cipher Signals:
Cipher Signals are key visuals of MA cross’ that may represent price movement and momentum. It would be too confusing and hard to decipher these MA’s as lines on a chart, and therefore we decided to use signals in the form of symbols instead. There are 12 Standard and 4 Predictive/Confirming Cipher signals. The Standard Cipher signals are composed of 6 Bullish and 6 Bearish (they all have opposites that balance each other out). There can never be 2 of the same signal in a row, as the Bull and Bear cancel each other out and it's always in a state of one or the other. When all 6 Bullish or Bearish signals appear in a row, very closely together, without any of the opposing signals it may represent a strong momentum movement is about to occur.
If you refer to the example above, you’ll see that the 6 Bullish Cipher signals appeared exactly as mentioned above. Shortly after the Green Circle appeared, there was a large spike in price movement in favor of the Bulls. Cipher signals don’t need to appear in a cluster exactly like the white circle in this photo for momentum to occur, but when it does, it may represent volatility more than if it is broken up with opposing signals or spaced out over a longer time span.
Above is an example of the opposite, where all 6 Bearish Cipher signals appeared together without being broken by a Bullish Cipher signal or being too far spaced out. As you can see, even though past it there was a few Bullish signals, they were quickly reversed back to Bearish before a large price movement occurred in favor of the Bears.
In the example above we’ve changed Cipher signals to Predictive and Confirming. Support Crosses (Green +) and Blood Diamonds (Red ♦) are the normal Cipher Signals that appear within the Standard Set. They are the first Cipher Signal that appears and are the most common ones as well. However, just because they are the first, that doesn’t mean they aren’t a powerful Cipher signal. For this reason, there are Predictive and Confirming Cipher signals for these. The Predictive do just that, they appear slightly sooner (if not the same bar) as the regular and the Confirming appear later (1+ bars usually). There will be times that the Predictive appears, but it doesn’t resort to the Regular appearing, or the Regular appears and the Confirming doesn’t. This is normal behavior and also the purpose of them. They are meant to be an indication of IF they may appear soon and IF the regular was indeed a valid signal.
Extremes:
Extremes are MA’s that have a very large length. They are useful for seeing Cross’ and Support and Resistance over a long period of time. However, because they are so long and slow moving, they might not always be relevant. It’s usually advised to turn them on, see if any are close to the current price point, and if they aren’t to turn them off. The main reason being is they stretch out the chart too much if they’re too far away and they also may not be relevant at that point.
When they are close to the price however, they may act as strong Support and Resistance locations as circled in the example above.
Pivots:
Pivots are used to help identify key Support and Resistance locations. They adjust on their own in an attempt to keep their locations as relevant as possible and likewise will adjust when the price pushes their current bounds. They may be useful for seeing when the Price is currently testing their level as this may represent Overbought or Oversold. Keep in mind, just because the price is testing their levels doesn’t mean it will correct; sometimes with high volatility or geopolitical news, movement may continue even if it is exhibiting Overbought or Oversold traits. Pivots may also be useful for seeing how far the price may correct to, giving you a benchmark for potential Take Profit and Stop Loss locations.
Trend Lines:
Trend Lines may be useful for identifying Support and Resistance locations on the Vertical. Trend Lines may form many different patterns, such as Pennants, Channels, Flags and Wedges. These formations may help predict and drive the price in specific directions. Many traders draw or use Indicators to help create Trend Lines to visualize where these formations will be and they may be very useful alone even for identifying possible Support and Resistance locations.
If you refer to the previous example, and now to this example, you’ll notice that the Trend Line that supported it in 2023 was actually created in June 2020 (yellow circle). Trend Lines may be crucial for identifying Support and Resistance locations on the Vertical that may withhold over time.
Custom Bollinger Bands:
Bollinger Bands are used to help see Movement vs Consolidation Zones (When it's wide vs narrow). It's also very useful for seeing where the correction areas may be. Price may bounce between top and bottom of the Bollinger Bands, unless in a pump or dump. The Boom Meter will show you whether it is currently: Dumping, Consolidation or Pumping. If combined with Boom Meter Bar Colors it may be a good indication if it will break the Bollinger Band (go outside of it). The Middle Line of the Bollinger Band (White Line) may be a very strong support / resistance location. If the price closes above or below it, it may be a good indication of the trend changing (it may indicate one of the first stages to a pump or dump). The color of the Bollinger Bands change based on if it is within a Bull or Bear Zone.
What makes this Bollinger Band special is not only that it uses a custom multiplier, but it also incorporates volume to help add weight to the calculation.
Boom Meter Bar Colors:
Boom Meter Bar Colors are a way to see potential Overbought and Oversold locations on a per bar basis. There are 6 different colors within the Boom Meter bar colors. You have:
Overbought and Very Bullish = Dark Green
Overbought and Slightly Bullish = Light Green
Overbought and Slight Bearish = Light Red
Oversold and Very Bearish = Dark Red
Oversold and Slightly Bearish = Orange
Oversold and Slightly Bullish = Light Purple
When there is no Boom Meter Bar Color prevalent there won’t be a color change within the bar at all.
Just because there is a Boom Meter Bar Color change doesn’t mean you should act on it purchase or sell wise, but it may be an indication as to how that bar is fairing in an Overbought / Oversold perspective. Boom Meter Bar Colors are mainly based on RSI but do take in other factors like price movement to determine if it is Overbought or Oversold. When it comes to Boom Meter Bar Color, you should take it as it is, in the sense that it may be useful for seeing how Individual bars are fairing, but also note that there may be things such as:
When there is Very Overbought (Dark Green) or Very Oversold (Dark Red), during massive pump or dumps, it will maintain this color. However, once it has lost ‘some’ momentum it will likely lose this color.
When there has been a massive Pump or Dump, and there is likewise a light purple or light red, this may mean there is a correction or consolidation incoming.
True Value Zones:
True Value zones are our custom way of displaying something that is similar to a Bollinger Band that can likewise twist like an MA cross. The main purpose of it is to display where the price may reside within. Much like a Bollinger Band it has its High and Low within its zone to specify this location. Since it has the ability to cross over and under, it has the ability to specify what it thinks may be a Bullish or Bearish zone. This zone uses its upper level to display what may be a Resistance location and its lower level to display what may be a Support location. These Support and Resistance locations are based on Momentum and will move with the price in an attempt to stay relevant.
You may use these True Values zones as a gauge of if the price is Overbought or Oversold. When the price faces high volatility and moves outside of the True Value Zones, it may face consolidation or likewise a correction to bring it back within these zones. These zones may act as a guideline towards where the price is currently valued at and may belong within.
Bar Strength Indexes:
Bar Strength Indexes are our way of ranking each bar in correlation to the last few. It is based on a few things but is highly influenced on Open/Close/High/Low, Volume and how the price has moved recently. They may attempt to ‘rate’ each bar and how Bullish/Bearish each of these bars are. The Green number under the bar is its Bullish % and the Red number above the bar is its Bearish %. These %’s will always equal 100% when combined together. Bar Strength Indexes may be useful for seeing when either Bullish or Bearish momentum is picking up or when there may be a reversal / consolidation.
These Bar Strength Indexes may allow you to decipher different states. If you refer to the example above, you may notice how based on how the numbers are changing, you may see when it has entered / exited Bullish, Bearish and Consolidation. Likewise, if you refer to the current bar (yellow circle), you can see that the Bullish % has dropped from 93 to 49; this may be signifying that the Bullish movement is losing momentum. You may use these changes in Bar Indexes as a guide to when to enter / end trades.
Volume Profile:
Volume Profile has been something that has been within TradingView for quite some time. It is a very useful way of seeing at what Horizontal Price there has been the most volume. This may be very useful for seeing not only Support and Resistance locations based on Volume, but also seeing where the majority of Limit Orders are placed. Limit Orders are where traders decide they want to either Buy / Sell but have the order placed so the trade won’t happen until the price reaches a certain amount. Either through many orders from many traders, or a single order from a ‘Whale’ (trader with a lot of capital); you may see Support and Resistance at specific Price Points that have large Volume.
Many Volume Profile Indicators feature a breakdown of all the different locations of volume, along with a Point Of Control (POC) line to designate where the most Volume has been. To try and reduce clutter within our already very saturated Toolkit Indicator, we’ve decided to strip our Volume Profile to only display this POC line. This may allow you to see where the crucial Volume Support and Resistance is without all of the clutter.
You may be wondering, well how important is this Volume Profile POC line and how do I go about using it? Aside from it being a gauge towards where Support and Resistance may be within Volume, it may also be useful for identifying good Long/Short locations. If you think of the line as a ‘Battle’ between the Bulls and Bears, they’re both fighting over that line. The Bears are wanting to break through it downwards, and the Bulls are wanting to break through it upwards. When one side has temporarily won this battle, this means they may have more Capital to push the price in their direction. For instance, if both the Bulls and the Bears are fighting over this POC price, that means the Bears think that price is a good spot to sell; however, the Bulls also deem that price to be a good point to buy. If the Bulls were to win this battle, that means the Bears either canceled their orders to reevaluate, or all of their orders have been completed from the Bulls buying them all. What may happen after that is, if the Bulls were able to purchase all of these Limit Sell Orders, then they may still have more Capital left to continue to pressure the price upwards. The same may be true for if the Bears were to win this ‘Battle’.
How to use YinYang Trend as a cohesive whole:
Hopefully you’ve read and understand how each aspect of this Indicator works on its own, as knowing how/what they each do is important to understanding how it is used as a cohesive whole. Due to the fact that this Toolkit of an Indicator displays so much data, you may find it easier to use and understand when you’re zoomed in a little, somewhat like we are in this example above.
If we refer to the example above, you may like us, deduce a few things:
1. The current price may be VERY Overbought. This may be seen by a few different things:
The Boom Meter Bar Colors have been exhibiting a Dark Green color for 6 bars in a row.
The price has continuously been moving the High (red) Pivot Upwards.
Our Boom Meter displays ‘Pumping’ at 100%.
The price broke through a Downward Trend Line that was created in February of 2022 at 45,000 like it was nothing.
The Bar Strength Index hit a Bullish value of 93%.
The Price broke out of the Bollinger Bands and continues to test its upper levels.
The Low is much greater than our fastest moving MA that creates the Purchase Zones.
The Price is vastly outside of the True Value Zone.
The Bar Strength Index of our current bar is 50% bullish, which is a massive decrease from the previous bar of 93%. This may indicate that a correction is coming soon.
2. Since we’ve identified the current price may be VERY Overbought, next we need to identify if/when/to where it may correct to:
We’ve created a new example here to display potential correction areas. There are a few places it has the ability to correct to / within:
The downward Trend Line (red) below the current bar sitting currently at 32,750. This downward Trend Line is at the same price point as the Fastest MA of our Purchase Zone which may provide some decent Support there.
Between two crucial Pivot heights, within a zone of 30,000 to 31,815. This zone has the second fastest MA from the Purchase Zone right near the middle of it at 31,200 which may act as a Support within the Zone. Likewise there is the Bollinger Band Basis which is also resting at 30,000 which may provide a strong Support location here.
If 30,000 fails there may be a correction all the way to the bottom of our True Value Zone and the top of one of our Extremes at 27,850.
If 27,850 fails it may correct all the way to the bottom of our Purchase Zone / lowest of our Extremes at 27,350.
If all of the above fails, it may test our Volume Profile POC of 26,430. If this POC fails, the trend may switch to Bearish and continue further down to lower levels of Support.
The price can always correct more than the prices mentioned above, but considering overall this Indicator is favoring the Bulls, we will tailor this analysis in Favor of the Bullish Momentum maintaining even during this correction. For these reasons, we think the price may correct between the 30,000 and 31,815 zone before continuing upwards and maintaining this Bullish Momentum.
Please note, these correction estimates are just that, they’re estimates. Aside from the fact that the price is very overbought right now and our Bar Strength Index may be declining (bar hasn’t closed yet); the Boom Meter Strength remains at 100%, meaning there may not be much Bearish momentum changes happening yet. We just want to show you how an Preemptive analysis may be done before there are even Bearish Cipher Signals appearing.
Using this Indicator, you may be able to decipher Entry and Exits. In the previous example, we went over how you may use it to see where a correction (Exit / Take Profit) may be and how far this correction may go. In this example above we will be discussing how to identify Entry locations. We will be discussing a Bullish Buy entry but the same rules apply for a Bearish Sell Entry just the opposite with the Cipher Signals.
If you refer to where we circled in white, this is where the Purchase Zones faced Consolidation. When the Purchase Zones all get tight and close together like that, this may represent Volatility and Momentum in either direction may occur soon.
This was then followed by all 6 of the Standard Cipher Signals closely in succession to each other. This means the Momentum may be favoring the Bulls. If this was likewise all 6 of the Bearish Cipher Signals closely in succession, than the momentum change would favor the Bears.
If you were looking for an entry, and you saw Consolidation with the Purchase Zones and then shortly after you saw the Green Circle and Blue Flag (they can swap order); this may now be a good Entry location.
We will conclude this Tutorial here. Hopefully this has taught you how this Trend Analysis Toolkit may help you locate multiple different types of important Support and Resistance locations; as well as possible Entry and Exit locations.
Settings:
1. Bull/Bear Zones:
1.1. Purchase Speed (Bull/Bear Signals and Take Profit Signals):
Speed determines how much price movement is needed for a signal to occur.
'Sonic' uses the extremities to try and get you the best entry and exit points, but is so quick, its speed may reduce accuracy.
'Fast' may attempt to capitalize on price movements to help you get SOME or attempt to lose LITTLE quickly.
'Medium' may attempt to get you the most optimal entry and exit locations, but may miss extremities.
'Slow' may stay in trades until it is clear that momentum has changed.
'Snail' may stay in trades even if momentum has changed. Snail may only change when the price has moved significantly (This may result in BIG gains, but potentially also BIG losses).
1.2. Purchase Strength (Bull/Bear Signals and Take Profit Signals):
Strength ensures a certain amount of verifications required for signals to happen. The more verifications the more accurate that signal is, but it may also change entry and exit points, and you may miss out on some of the extremities. It is highly advised to find the best combination between Speed and Strength for the TimeFrame and Pair you are trading in, as all pairs and TimeFrames move differently.
'High' uses 15 verifications to ensure signal strength.
'Medium' uses 10 verifications to ensure signal strength.
'Low' uses 5 verifications to ensure signal strength.
'Very Low' uses 3 verifications to ensure signal strength.
2. Cipher Signals:
Cipher Signals are very strong EMA and SMA crosses, which may drastically help visualize movement and help you to predict where the price will go. All Symbols have counter opposites that cancel each other out (YinYang). Here is a list, in order of general appearance and strength:
White Cross / Diamond (Predictive): The initial indicator showing trend movement.
Green Cross / Diamond (Regular): Confirms the Predictive and may add a fair bit of strength to trend movement.
Blue Cross / Diamond (Confirming): Confirms the Regular, showing the trend might have some decent momentum now.
Green / Red X: Gives momentum to the current trend direction, possibly confirming the Confirming Cross/Diamond.
Blue / Orange Triangle: may confirm the X, Possible pump / dump of decent size may be coming soon.
Green / Red Circle: EITHER confirms the Triangle and may mean big pump / dump is potentially coming, OR it just hit its peak and signifies a potential reversal correction. PAY ATTENTION!
Green / Red Flag: Oddball that helps confirm trend movements on the short term.
Blue / Yellow Flag: Oddball that helps confirm trend movements on the medium term (Yin / Yang is the long term Oddball).
3. Bull/Bear Signals:
Bear and Bull signals are where the momentum has changed enough based on your Purchase Speed and Strength. They generally represent strong price movement in the direction of the signal, and may be more reliable on higher TimeFrames. Please don’t use JUST these signals for analysis, they are only meant to be a fraction of the important data you are using to make your technical analysis.
4. Take Profit Signals:
Take Profit signals are guidelines that momentum has started to change back and now may be a good time to take profit. Your Take Profit signals are based on your Take Profit Speed and Strength and may be adjusted to fit your trading style.
5. Information Tables:
Information tables display very important data and help to declutter the screen as they are much less intrusive compared to labels. Our Information tables display: Boom Meter, Purchase Strength of Bull/Bear Zones and Yin/Yang State.
Boom Meter: Uses over 50 different calculations to determine if the pair is currently 'Dumping' (0-29%), 'Consolidating' (30-70%), or 'Pumping' (71-100%).
Bull / Bear Strength: Shows the strength of the current Bull / Bear signal from 0-100% (Signals start at 100% and change when they hit 0%). The % it moves up or down is based on your 'Purchase Strength'.
Yin / Yang state: Is one of the strongest EMA/SMA crosses (long term Oddball) within this Indicator and may be a great indication of which way the price is moving. Do keep in mind if the price is consolidating when changing state, it may have the highest chance of switching back also. Once momentum kicks in and there is price movement the state may be confirmed. Refer to other Cipher Symbols, Extremes, Trend, BOLL, Boom %, Bull / Bear % and Bar colors when Bull / Bear Zones are consolidating and Yin / Yang State changes as this is a very strong indecision zone.
6. Bull / Bear Zones:
Our Bull / Bear zones are composed of 8 very important EMA lengths that may act as not only Support and Resistance, but they help to potentially display consolidation and momentum change. You can tell when they are getting tight and close together it may represent consolidation and when they start to flip over on each other it may represent a change in momentum.
7. MA Extremes:
Our MA Extremes may be 3 of the most important long term moving averages. They don’t always play a role in trades as sometimes they’re way off from the price (cause they’re extreme lengths), but when they are around price or they cross under or over each other, it may represent large changes in price are about to occur. They may be very useful for seeing strong resistance / support locations based on price averages. Extremes may transition from a Support to a Resistance based on its position above or below them and how many times the price has either bounced up off them (Supporting) or Bounced back down after hitting them (Resistance).
8. Pivots:
Pivots may be a very important indicator of support and resistance for horizontal price movement. Pivots may represent the current strongest Support and Resistance. When the Pivot changes, it means a new strong Support or Resistance has been created. Sometimes you'll notice the price constantly pushes the pivot during a massive Pump or Dump. This is normal, and may indicate high levels of volatility. This generally also happens when the price is outside of the Bollinger Bands and is also Over or Undervalued. The price usually consolidates for a while after something like this happens before more drastic movement may occur.
9. Trend Lines:
Trend lines may be one of the best indicators of support and resistance for diagonal price movement. When a Trend Line fails to hold it may be a strong indication of a dump. Keep a close eye to where Upward and Downward Trend Lines meet. Trend lines can create different trading formations known as Pennants, Flags and Wedges. Please familiarize yourself with these formations So you know what to look for.
10. Bollinger Bands (BOLL):
Bollinger Bands may be very useful, and ours have been customized so they may be even more accurate by using a modified calculation that also incorporates volume.
Bollinger Bands may be used to see Movement vs Consolidation Zones (When it’s wide vs narrow). It also may be very useful for seeing where the correction areas are likely to be. Price may bounce between top and bottom of the BOLL, unless perhaps in a pump or dump. The Boom Meter may show you whether it is currently: Dumping, Consolidation or Pumping, along with Boom Meter Bar Colors, may be a good indication if it will break the BOLL. The Middle Line of the BOLL (White Line) may be a very strong support / resistance line. If the price closes above or below it, it may be a good indication of the trend changing (it may be one of the first stages to a pump or dump).
11. Boom Meter Bar Colors:
Boom Meter bar colors may be very useful for seeing when the bar is Overbought or Underbought. There are 6 different types of boom meter bar colors, they are:
Dark Green: RSI may be very Overbought and price going UP (May be in a big pump. NOTICE, chance of small dump correction if Cherry Red bar appears).
Light Green: RSI may be slightly Overbought and price going UP (chance of small pump).
Light Purple: RSI may be very Underbought and price going UP (May have chance of small correction).
Dark Red: RSI may be very Underbought and price going DOWN (May be in a big dump. NOTICE, chance of small pump correction if Light Purple bar appears).
Light Orange: RSI may be slightly Underbought and price going DOWN (chance of small dump).
Cherry Red: RSI may be very Overbought and price going DOWN (Chance of small correction).
12. True Value Zone:
True Value Zones display zones that represent ranges to show what the price may truly belong within. They may be very useful for knowing if the Price is currently not valued correctly, which generally means a correction may happen soon. True Value Zones can swap from Bullish to Bearish and are represented by Red for Bearish and Green for Bullish. For example, if the price is ABOVE and OUTSIDE of the True Value Zone, this means it may be very overvalued and might correct to go back inside the True Value Zone. This correction may be done by either dumping in price back into the zone, or consolidating horizontally back into it over a longer period of time. Vice Versa is also true if it is BELOW and OUTSIDE of the True Value Zone.
13. Bar Strength Index:
Bar Strength Index may display how Bullish/Bearish the current bar is. The strength is important to help see if a pump may be losing momentum or vice versa if a dump may correct. Keep in mind, the Bar Strength Index does a small 'refresh' to account for new bars. It may help to keep the Index more accurate.
14. Volume Profile:
Volume Profiles may be important to know where the Horizontal Support/Resistance is in Price base on Volume. Our Volume Profile may identify the point where the most volume has occurred within the most relevant timeframe. Volume Profiles are helpful at identifying where Whales have their orders placed. The reason why they are so helpful at identifying whales is when the volume is profiled to a specific area, there may likely be lots of Limit Buy and/or Sells around there. Limit Buys may act as Support and Limit Sells may act as Resistance. It may be very useful to know where these lie within the price, similar to looking at Order Book Data for Whale locations.
If you have any questions, comments, ideas or concerns please don't hesitate to contact us.
HAPPY TRADING!

YD_Divergence_RSI+CMFThe ‘YD_Divergence_RSI+CMF’ indicator can find divergence using RSI (Relative Strength Index) and CMF (Chaikin Money Flow) indicators.
📌 Key functions
1. Search pivot high and pivot low points in a certain length of price.
2. Connect pivot high to pivot high , pivot low to pivot low , forming two standards for divergence in result.
The marker then plots only the higher high, lower low lines.
(higher low and lower high in prices are referred to hidden divergence, which are not considered in this indicator)
3. Compare the two standards with RSI and CMF indicators, send an alert if there is a divergence. As a result, the indicator will find four combination of divergence.
A. Higher high price / Lower RSI (Bearish RSI Divergence)
B. Lower low price / Higher RSI (Bullish RSI Divergence)
C. Higher high price / Lower CMF (Bearish CMF Divergence)
D. Lower low price / Higher CMF (Bullish CMF Divergence)
📌 Details
Developing the indicators, we put a lot of effort in making a customizable and user-friendly interface.
#1. Pivot Setting
Users can set the length to find the pivot high / pivot low in ‘Pivot Settings – Pivot Length.’
Increased pivot Length takes more candles to interpret the chart but reduce false signals since the it uses only the most certain pivot high / pivot low values. Obviously, decreased pivot length will act the opposite.
Users can choose whether to use ‘High/Low’ or ‘Close’ in ‘Pivot Reference’ to set the swing point of prices.
Users can also choose whether to display the pivot high / pivot low marker on the chart.
#2 RSI & CMF Settings
Users can adjust the length of RSI & CMF separately. (The default values are set to 14 and 20 each.)
#3 Label Setting
Users can adjust the text displayed on the chart label. (The default values is set to ‘Bullish / Bearish’, ‘RSI/CMF’, ‘Divergence’.)
Users can reduce the length of text label or simply turn the label off. Just click the ‘Bull/Bear’ or ‘None’ button. ‘Divergence’ works the same.
Users can decide whether to display the ‘Divergence Line and Label’, set custom settings for the label and line. (color, thickness, style, etc)
📌 Alert
Alert are provided as a combination of the chart's symbol and the set label text. For example,
‘BINANCE:BTCUSDT.P, Bullish RSI Divergence’
====================================================
"YD_Divergence_RSI+CMF" 지표 는 RSI와 CMF 지표를 이용해서 Divergence 를 찾아낼 수 있습니다.
📌 주요 기능
1. 정해진 가격 움직임 안에서 pivot high와 pivot low 포인트 를 찾아냅니다.
2. Pivot high로만 이어진 라인과, Pivot low로만 이어진 두 라인을 작도한 뒤 divergence의 기준으로 삼습니다.
이 지표에서는 normal divergence만 사용하기 때문에 차트에 higher high와 lower low만 표기 합니다.
(higher low와 lower high는 hidden divergence로 정의되며, 이 지표에서는 다루지 않습니다.
3. 두 기준선과 RSI, CMF 지표를 각각 비교하고, 결과적으로 4개의 조합을 구할 수 있습니다.
A. Higher high price / Lower RSI (Bearish RSI Divergence)
B. Lower low price / Higher RSI (Bullish RSI Divergence)
C. Higher high price / Lower CMF (Bearish CMF Divergence)
D. Lower low price / Higher CMF (Bullish CMF Divergence)
📌 세부 사항
지표를 개발하며 사용자들이 원하는 방향으로 지표를 설정할 수 있게 작업에 많은 공을 들였습니다. 굉장히 다양한 옵션을 선택할 수 있으며, 원하는 방식으로 지표를 사용할 수 있습니다.
#1 Pivot Setting
Pivot setting에서는 Pivot Length를 변경할 수 있습니다.
Pivot Length를 늘릴 경우, 보다 확실한 Swing High와 Swing Low만을 사용하게 되므로, False signal이 줄어들 수 있습니다. 하지만 Swing High/ Low를 판정하는 데에 더 긴 시간이 걸리게 되므로, Signal이 다소 늦게 발생하는 단점이 생기게 됩니다.
Pivot Length를 줄일 경우, 반대로 Swing High/Low의 판정이 더 빨리 일어나기 때문에, Signal을 거래에 이용하기는 좋을 수 있습니다. 다만, Swing High와 Low가 훨씬 더 잦은 빈도로 발생하기 때문에 False Signal을 줄 가능성이 높아집니다.
Pivot Reference에서는 가격의 Swing Point를 설정함에 있어, High/Low(고가/저가)를 이용할 지 Close (종가)를 이용할 지 선택할 수 있습니다.
Pivot High/Low Marker를 선택할 경우 Pivot High/ Low에 Marker가 찍히게 됩니다.
#2 RSI와 CMF Setting
RSI와 CMF Setting에서는 RSI와 CMF의 길이를 각각 설정할 수 있습니다. 기본값은 14와 20으로 설정되어 있습니다.
#3 Label Setting
Label Setting에서는 Label에 표시되는 글자를 선택할 수 있습니다.
기본값은 "Bullish / Bearish", "RSI/CMF", "Divergence"로 선택되어 있으며, 너무 길다고 느껴질 경우 "Bull/Bear" 혹은 "None"을 클릭하여 길이를 줄일 수 있습니다. 마찬가지로 Divergence의 경우도 생략이 가능합니다.
하단에서는 Divergence Line과 Label을 켜고 끌 수 있으며, 선의 색깔, 굵기, 종류, 그리고 Label의 색깔, 크기, 종류를 선택할 수 있습니다. Label의 Text 색 역시 변경이 가능합니다.
📌 얼러트
얼러트는 자신이 설정한 차트의 심볼과 Label의 문구의 조합으로 제공되며 예를 들면 다음과 같습니다.
"BINANCE:BTCUSDT.P, Bullish RSI Divergence"

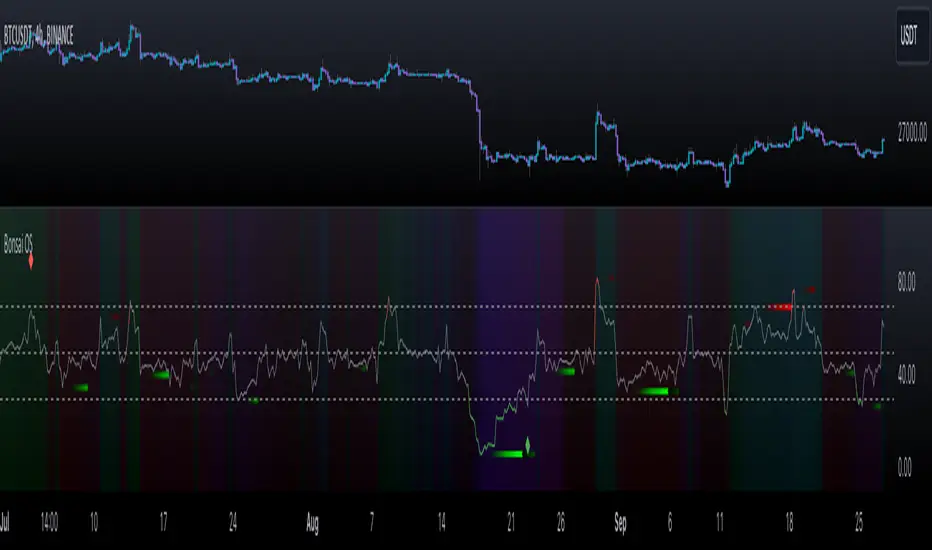
Bonsai OS (Oscillators)Bonsai OS combines four oscillators (RSI, CCI, Stochastic, MACD) in one interface. Features divergence detection, color-intensity, and insights into divergences. Assists traders in spotting potential pivot points.
═════════════════════════════════════════════════════════════════════════
🌳 Bonsai OS 🌳 Advanced Oscillator Suite
📘 Overview
Bonsai OS is a tool tailored for traders focusing on reversal strategies and those keen on identifying market divergences. Combining multiple oscillators into one unified interface, it aids traders in pinpointing potential pivot reversal points.
📌 Algorithm Logic
• Multi-Oscillator Integration: Bonsai OS calculates and integrates the values from four standard oscillators: RSI, CCI, Stochastic, and MACD. Each oscillator's value is derived from its respective mathematical formula, analyzing historical data points.
• Divergence Detection: The tool runs a series of comparisons between price action and oscillator values. When discrepancies (divergences) are observed, they are highlighted, suggesting potential market reversals.
• Price Strength Visualization: A gradient background that is determined by an average of the oscillator values in relation to their historical norms, thereby providing a visual cue about the current price strength, whether it is strong or weak.
• Alerts: Users can set up notifications based on specific divergence insights. Once set criteria are met, alerts are triggered.
🎯 Purpose
• For Professionals: Bonsai OS offers integrated oscillator readings, allowing a more in-depth market analysis.
• For Beginners: Simplified readings and visual cues make it easier for newcomers to understand oscillator indicators and market conditions.
🛠 Distinctive Elements
• Oscillator Fusion: Bonsai OS goes beyond just grouping oscillators. It looks for matching divergences across them, aiming to find stronger signals for market reversals.
• Divergence Indicators: Bonsai OS identifies divergence patterns between price trends and oscillator readings, highlighting their intensity with color variations.
• Insight into Failed Divergences: Recognizing not all divergences lead to reversals, Bonsai OS provides markers for potential false signals, helping traders exercise caution and fine-tune their strategies.
Getting Bullish/Bearish and Divergences
📊 Features
• Data Source Customization: Users have the flexibility to choose between default data inputs or adjust to their preferred price points (like High & Low).
• Combined Divergence Signals: Beyond individual oscillator divergences, Bonsai OS identifies instances when several oscillators indicate divergence at the same time.
• Adaptable Outputs: Outputs like 'Bullish Divergence ▲', 'Getting Bullish ▲', 'Getting Bearish ▼' and 'Bearish Divergence ▼' are plotted as non-displayable 1 or 0 for seamless integration into other custom indicators, ensuring a harmonious integration.
Here's an example of a custom indicator that can be used for inputting data from external sources:
//@version=5
indicator("My Script Template", overlay = true)
group_name = "External Source"
external = input.source(title = "Source", defval = close, inline = "external", group = group_name)
val = input.int(title = ">", defval = 0, inline = "external", group = group_name)
// Your logic follows here...
Bonsai OS as External Source
🎛 How To Use Bonsai OS
1. Select the desired oscillator.
2. Monitor the color changes for market condition insights.
3. Look out for divergence markers to anticipate potential market shifts.
4. If required, set up alerts for real-time updates.
Indicator Settings Menu
📜 Feedback & Continual Development
We welcome your feedback. It's essential for the continuous improvement of Bonsai OS and to better serve the TradingView community.
❗️ Disclaimer
Trading involves risks. Bonsai OS aims to provide an analytical tool to support traders, but it's essential to complement its insights with other research. Always seek advice from financial professionals and trade responsibly.
Bollinger RSI BandsIndicator Description:
The "Bollinger RSI Bands" is an advanced technical analysis tool designed to empower traders with comprehensive insights into market trends, reversals, and overbought/oversold conditions. This multifaceted indicator combines the unique features of candle coloration and Bollinger Bands with the Relative Strength Index (RSI), making it an indispensable tool for traders seeking to optimize their trading strategies.
Purpose:
The primary purpose of the "Bollinger RSI Bands" indicator is to provide traders with a holistic view of market dynamics by offering the following key functionalities:
Candle Coloration: The indicator's signature candle colors - green for bullish and red for bearish - serve as a visual representation of the prevailing market trend, enabling traders to quickly identify and confirm market direction.
RSI-Based Moving Average: A smoothed RSI-based moving average is plotted, facilitating the detection of trend changes and potential reversal points with greater clarity.
RSI Bands: Upper and lower RSI bands, set at 70 and 30, respectively, help traders pinpoint overbought and oversold conditions, aiding in timely entry and exit decisions.
Bollinger Bands: In addition to RSI bands, Bollinger Bands are overlaid on the RSI-based moving average, offering insights into price volatility and highlighting potential breakout opportunities.
How to Use:
To maximize the utility of the "Bollinger RSI Bands" indicator, traders can follow these essential steps:
Candle Color Confirmation: Assess the color of the candles. Green candles signify a bullish trend, while red candles indicate a bearish trend, providing a clear and intuitive visual confirmation of market direction.
Overbought and Oversold Identification: Monitor price levels relative to the upper RSI band (70) for potential overbought signals and below the lower RSI band (30) for potential oversold signals, allowing for timely adjustments to trading positions.
Trend Reversal Recognition: Observe changes in the direction of the RSI-based moving average. A transition from bearish to bullish, or vice versa, can serve as a valuable signal for potential trend reversals.
Volatility and Breakout Opportunities: Keep a watchful eye on the Bollinger Bands. Expanding bands signify increased price volatility, often signaling forthcoming breakout opportunities.
Why Use It:
The "Bollinger RSI Bands" indicator offers traders several compelling reasons to incorporate it into their trading strategies:
Clear Trend Confirmation: The indicator's distinct candle colors provide traders with immediate confirmation of the current trend direction, simplifying trend-following strategies.
Precise Entry and Exit Points: By identifying overbought and oversold conditions, traders can make more precise entries and exits, optimizing their risk-reward ratios.
Timely Trend Reversal Signals: Recognizing shifts in the RSI-based moving average direction allows traders to anticipate potential trend reversals and adapt their strategies accordingly.
Volatility Insights: Bollinger Bands offer valuable insights into price volatility, aiding in the identification of potential breakout opportunities.
User-Friendly and Versatile: Despite its advanced features, the indicator remains user-friendly and versatile, catering to traders of all experience levels.
In summary, the "Bollinger RSI Bands" indicator is an indispensable tool for traders seeking a comprehensive view of market dynamics. With its unique combination of candle coloration and Bollinger Bands, it empowers traders to make more informed and strategic trading decisions, ultimately enhancing their trading outcomes.
Note: Always utilize this indicator in conjunction with other technical and fundamental analysis tools and exercise prudence in your trading decisions. Past performance is not indicative of future results.

Volume Based RSI with ADXThe RSI indicator is a powerful tool that utilizes both volume and time to determine market trends. When there is a low volume of trades in a short period of time, but the trading activity is high, it is considered bullish or bearish. In the case of a bullish trend, the RSI indicator will display a green color, while a bearish trend will be represented by a red color. If there is no trading activity, the indicator will display a gray color. Additionally, if the ADX level meets the threshold level, the indicator will display a blue color. However, if the ADX level does not meet the threshold level, the indicator will revert back to displaying a gray color.

RSI + Divergences + Alerts [MisterMoTA]The indicator RSI + Divergences + Alerts by MisterMoTA is an RSI indicator that fills the RSI and RSI moving average with 4 different colors (growing up, falling up, falling down and rising down colors), users can customize colors from dashboard , also can be disabled the fill if the user want a standard RSI.
The dafault value of RSI is 14 and value of the moving average is 50 ( a dynamic 50 rsi line is better for trend identification than a standard 50 line) and users can change the values from indicator settings.
For detecting the divergences displayed in the indicator, I integrated in our script the default Divergences indicator from Tradingview, users can display, hide and change colors for regular and hidden divergences.
RSI indicator display also trend conditions for RSI and RSI MA, the RSI MA angle is calculated using ATR value, the slope of the RSI Noving Average can help to identify trend conditions too.
The script comes with 12 different alerts, if need different alerts please let me know in the comments and will update the script with your request:
Alert for Regular Bullish Divergence
Alert for Regular Bearish Divergence
Alert for Hidden Bullish Divergence
Alert for Hidden Bearish Divergence
Alert for RSI Overbought
Alert for RSI Extreme Overbought
"Alert for RSI Oversold
Alert for RSI Extreme Oversold
Alert for RSI Crossing Above RSI MA
Alert for RSI Crossing Bellow RSI MA
Alert for RSI Crossing Above 50
Alert for RSI Crossing Bellow 50
Please follow me for other script like this one.
Kind regards,
MisterMoTA

RSI with Close & Tail DivergencesRSI divergence is a cornerstone signal for both stock and cryptocurrency traders, renowned for its reliability.
The basis for measuring divergence can vary:
Historically, it's been determined by the candlestick's closing price.
However, a contemporary approach uses the tail values, specifically the high and low prices, of the candlestick.
Depending on the criteria selected, the resultant signals can be markedly different.
Our innovative indicator offers:
Divergence tracking based on the closing price of the candlestick.
Divergence tracking considering the candlestick's peak and trough values.
A unique convergence of both types of divergence signals.
With this tool, traders are empowered to make informed decisions, anchored in precise divergence cues.
This indicator boasts the following capabilities:
Displays divergence based on closing price, highs/lows, as well as a unique combined criterion.
Highlights pivot points.
Denotes divergence spots on the RSI chart with lines.
Offers a background color representation instead of labels.

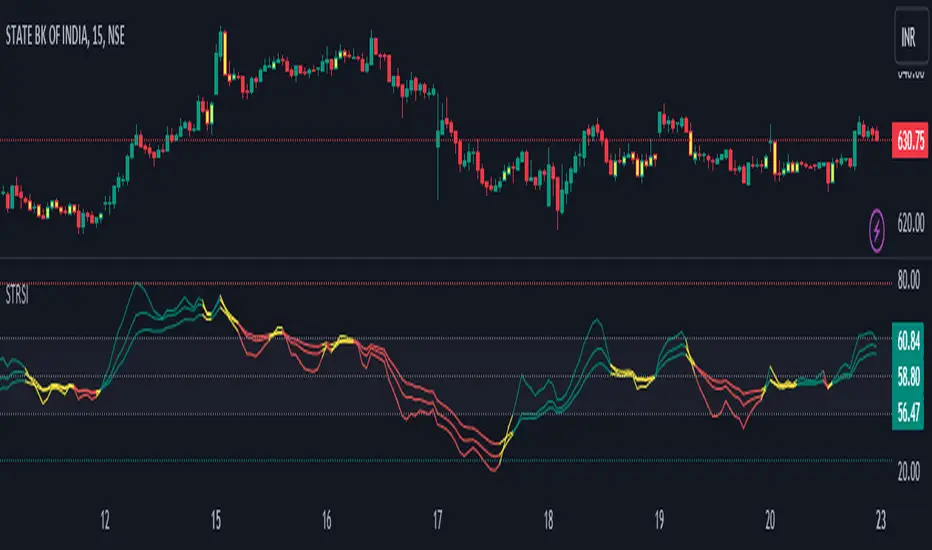
Double Relative Strength Index (Double RSI)# Double Relative Strength Index (Double RSI) Indicator
The Double Relative Strength Index (Double RSI) is a custom trading indicator for the TradingView platform. It provides traders with two Relative Strength Index (RSI) bands, a fast RSI, and a slow RSI, which can be helpful in identifying potential entry and exit points in the market.
## Features
- **Uses 2 RSI Bands:** The indicator displays two RSI lines on the chart, providing insights into the short-term and long-term strength of the asset's price movement.
- **Fast and Slow RSI:** The fast RSI uses a shorter length, while the slow RSI uses a longer length, allowing traders to observe different time frames of price momentum.
- **Smoothing:** To reduce noise and improve the readability of the RSI lines, the indicator offers multiple smoothing options such as RMA, SMA, EMA, WMA, and HMA.
- **Crossover and Crossunder Signals:** The indicator identifies potential trading signals when the fast RSI crosses above or below the slow RSI. These events are visually highlighted on the chart with color-coded candlesticks.
- **RSI Bands:** The indicator also includes colored bands that represent different RSI levels, such as 80%, 75%, 60%, 50%, 45%, 25%, and 20%. These bands help visualize the RSI's current position relative to overbought and oversold conditions.
## How to Use
1. Add the "Double RSI" indicator to your TradingView chart.
2. Customize the input parameters according to your preferences, such as the lengths of the fast and slow RSIs and the smoothing method.
3. The indicator will display two RSI lines on the chart, each with its own color.
4. Look for crossover events where the fast RSI line crosses above the slow RSI line, indicating a potential bullish signal.
5. Watch for crossunder events where the fast RSI line crosses below the slow RSI line, indicating a potential bearish signal.
6. The colored bands represent different RSI levels. When the RSI is in the overbought (high) or oversold (low) regions, it may suggest a potential reversal in price direction.
## Disclaimer
Please remember that the Double RSI indicator is provided for informational purposes only and should not be considered as financial advice or a standalone trading strategy. Always perform your own research, use additional tools and indicators, and consider risk management techniques before making any trading decisions.
**Note:** This code is subject to the terms of the Mozilla Public License 2.0. For more details, refer to the (mozilla.org).
RSI Supreme Multi-Method [MyTradingCoder]Introducing the "RSI Supreme Multi-Method" indicator, a powerful tool that combines the Relative Strength Index (RSI) with selectable manipulation methods to identify overbought and oversold conditions in the market, along with the ability to detect divergences for enhanced trading insights.
The indicator features four distinct manipulation methods for the RSI, each providing valuable insights into market conditions:
1. Standard RSI Method: The indicator uses the traditional RSI calculation to identify overbought and oversold areas.
2. Volatility Weighted RSI Method: This method applies a volatility formula to the RSI calculation, allowing for a more responsive indication of market conditions during periods of heightened volatility. Users can adjust the length of the volatility formula to fine-tune this method.
3. Smoothed RSI Method: The smoothed RSI method utilizes a smoothing algorithm to reduce noise in the RSI values, presenting a clearer representation of overbought and oversold conditions. The length of the smoothing can be adjusted to match your trading preferences.
4. Session Weighted RSI Method: With this innovative method, users can specify multipliers for different time sessions throughout the day to manipulate the base RSI. Each session can be customized with start and end times, enabling or disabling specific sessions, and specifying the multiplier for each session. This feature allows traders to adapt the RSI to different market sessions dynamically.
Additionally, the "RSI Supreme Multi-Method" indicator draws divergences on the oscillator, providing an extra layer of analysis for traders. Divergences occur when the direction of the RSI differs from the direction of the price movement, potentially signaling trend reversals.
Key Settings:
RSI Length: Adjust the length of the base RSI before applying any manipulation.
RSI Source: Determine the data source for the base RSI calculation.
Overbought Value: Set the RSI value at which overbought conditions are indicated.
Oversold Value: Set the RSI value at which oversold conditions are indicated.
RSI Type: Choose from four options: Standard, Smoothed, Volatility Manipulated, or Session Manipulated.
Volatility Manipulated Settings: Adjust the length of the volatility formula (applicable to Volatility Manipulated method).
Smoothed Settings: Adjust the length of the smoothing (applicable to Smoothed method).
Session Manipulated Settings: Customize six different time sessions with start and end times, enable or disable specific sessions, and specify multipliers for each session.
Divergence Color: Adjust the color of the drawn divergences to suit your chart's aesthetics.
Divergence Tuning: Fine-tune the sensitivity of the divergence detection for more accurate signals.
The "RSI Supreme Multi-Method" indicator is a versatile and comprehensive tool that can be used to identify overbought and oversold areas, as well as to spot potential trend reversals through divergences. However, like all technical analysis tools, it should be used in conjunction with other indicators and analysis methods to make well-informed trading decisions.
Enhance your trading insights with the "RSI Supreme Multi-Method" indicator and gain an edge in identifying critical market conditions and divergences with precision.

Wilder's RSI + DivergencesWilder's RSI + Divergences
Description:
The Wilder's RSI + Divergences study is a powerful tool for traders using the TradingView platform. This custom Pine Script study combines Wilder's Relative Strength Index (RSI) with the identification of regular and hidden divergences, providing valuable insights into potential market reversals and trend changes. This comprehensive study includes the calculation of the RSI using Wilder's smoothing method, the plotting of the RSI and its Exponential Moving Average (EMA), and the detection of divergences based on pivot points.
Key Features:
Wilder's RSI Calculation: The study accurately calculates the RSI using J. Welles Wilder Jr.'s well-known smoothing method, providing a reliable measure of the asset's price strength or weakness.
Regular Divergence Identification: The study automatically detects regular bullish and bearish divergences. Regular bullish divergences occur when the RSI forms a lower low while the price forms a higher low. Regular bearish divergences occur when the RSI forms a higher high while the price forms a lower high. These divergences can indicate potential trend reversals or trend continuation possibilities.
Hidden Divergence Identification: The study also identifies hidden bullish and bearish divergences. Hidden bullish divergences occur when the RSI forms a higher low while the price forms a lower low. Hidden bearish divergences occur when the RSI forms a lower high while the price forms a higher high. Hidden divergences often signal the continuation of an existing trend.
Customizable Parameters: The study allows users to customize various parameters, including the length of RSI calculation, the length of the RSI's EMA, the lookback periods for identifying pivot points, and the range for considering pivot points. Users can adjust these parameters to suit their trading strategies and preferences.
Visual Representation: The study plots the RSI, its EMA, and the identified regular and hidden divergences directly on the chart. This visual representation provides traders with a clear and intuitive understanding of potential trading opportunities.
Protecting the Source Code:
The source code for this study is protected to ensure its originality and maintain the integrity of the algorithm. By safeguarding the code, it prevents unauthorized distribution or modification, preserving the study's uniqueness and value. This protection ensures that the study remains exclusive to the TradingView platform, enhancing the user experience and maintaining the trust of traders who rely on this tool for their analysis and decision-making.
Instructions for Use:
Add the Wilder's RSI + Divergences study to your chart.
Customize the study parameters, such as RSI length, EMA length, lookback periods, and range, to align with your trading preferences.
Analyze the chart to identify regular and hidden divergences in the RSI. Regular bullish and bearish divergences indicate potential trend reversals, while hidden divergences suggest trend continuation possibilities.
Adjust your trading strategy or make informed decisions based on the identified divergences and the overall market context.
Note: This study is designed to be a valuable tool in your technical analysis process. It is essential to combine it with other indicators, price action analysis, and risk management techniques for comprehensive trading decisions.
By utilizing the Wilder's RSI + Divergences study, traders can gain deeper insights into market dynamics, identify potential trading opportunities, and make more informed trading decisions.

RSI Divergence Screener by zdmreThis screener tracks the following for up to 20 assets:
-All selected tickers will be screened in same timeframes (as in the chart).
-Values in table indicate that how many days passed after the last Bullish or Bearish of RSI Divergence.
For example, when BTCUSDT appears Bullish-Days Ago (15) , Bitcoin has switched to a Bullish Divergence signal 15 days ago.
Thanks to @QuantNomad and @MUQWISHI for building the base for this screener.
*Use it at your own risk
Note:
Screener shows the information about the RSI Divergence Scanner by zdmre with default settings.
Based indicator:

RSI MTF [Market Yogi]The Multi-Time Frame RSI with Money Flow Index and Average is a powerful trading indicator designed to help traders identify overbought and oversold conditions across multiple time frames. It combines the Relative Strength Index (RSI) with the Money Flow Index (MFI) and provides an average value for better accuracy.
The Relative Strength Index (RSI) is a popular momentum oscillator that measures the speed and change of price movements. It oscillates between 0 and 100 and is used to identify overbought and oversold conditions in an asset. By incorporating the RSI across multiple time frames, this indicator offers a broader perspective on market sentiment.
In addition to the RSI, this indicator also includes the Money Flow Index (MFI). The MFI is a volume-based oscillator that measures the inflow and outflow of money into an asset. It takes into account both price and volume, providing insights into the strength and direction of buying and selling pressure.
By combining the RSI and MFI across multiple time frames, traders gain a comprehensive understanding of market dynamics. The indicator allows for comparing the RSI and MFI values across different time frames, enabling traders to identify divergences and potential trend reversals.
Furthermore, this indicator provides an average value of the multi-time frame RSI, offering a consolidated signal that helps filter out noise and enhance the accuracy of trading decisions.
Key Features:
1. Multi-Time Frame RSI: Combines the RSI across different time frames to provide a comprehensive view of market sentiment.
2. Money Flow Index (MFI): Incorporates the MFI to gauge buying and selling pressure based on both price and volume.
3. Average Calculation: Computes the average value of the multi-time frame RSI to generate a consolidated trading signal.
4. Divergence Detection: Enables traders to spot divergences between the RSI and MFI values, indicating potential trend reversals.
5. Overbought and Oversold Levels: Highlights overbought and oversold levels on the RSI, aiding in timing entry and exit points.
The Multi-Time Frame RSI with Money Flow Index and Average is a versatile tool that can be applied to various trading strategies, including trend following, swing trading, and mean reversion. Traders can adjust the time frame settings to suit their preferences and trading style.
Note: It's important to use this indicator in conjunction with other technical analysis tools and indicators to validate signals and make informed trading decisions.

RSI Divergences on price chart - Open Source CodeHello Traders,
I have some exciting news to share with you all! Recently, I came across an incredible RSI divergences indicator developed by Socrate_FR. This indicator, in my opinion has an exceptional accuracy in detecting RSI divergences. However, during my exploration of other indicators in the TradingView library that display signals on the price chart, I found that many of them were often unreliable and missed out on important divergences.One such example is the Prices / RSI Divergences Detector by vtllr. Although vtllr did an amazing job with the indicator, I noticed that it didn't capture several relevant divergences accurately.
This observation inspired me to enhance the most accurate RSI divergences indicator available by showcasing the signals directly on the price chart. By doing so, I aimed to address the issue of unreliable and missed divergences in other price chart indicators. With this enhanced version, you can now effortlessly identify and track RSI regular divergences on the price chart itself:
-Regular bullish divergence occurs when the price forms lower lows while the RSI indicator forms higher lows. It suggests a potential bullish reversal (green line plot)
-Regular bearish divergence occurs when the price forms higher highs while the RSI indicator forms lower highs. It suggests a potential bearish reversal (red line plot)
Another key mofication:
This Indicator introduces a simpler approach compared to the original Socrate indicator. While Socrate differentiated divergences into eight types for both bullish and bearish scenarios, our enhanced version focuses on two distinct categories: small and big divergences. This decision was made to provide a clearer and more user-friendly experience. By condensing the divergence types into two groups, traders can easily identify and analyze the significance of the divergences without getting overwhelmed by excessive variations. The small divergences represent relatively minor divergences, while the big divergences indicate stronger and more significant signals.
-Small divergences represent relatively minor divergences (plotshape small circle)
-Big divergences indicate stronger signals (plotshape big circle)
I firmly believe that this enhanced RSI Divergences Indicator will be an invaluable tool for traders who rely on RSI analysis in their trading strategies. It combines the accuracy of Socrate_FR's original indicator with the enhanced visibility of signals on the price chart, ensuring you never miss any important divergences.
If you're interested in trying out this enhanced version of the indicator, please feel free to access the open-source code. If you want to visit and try the original version of the code visit Socrate_FR profile.
www.tradingview.com
Keep attention!
It is important to note that no trading indicator or strategy is foolproof, and there is always a risk of losses in trading. While this indicator may provide useful information for making conclusions, it should not be used as the sole basis for making trading decisions. Traders should always use proper risk management techniques and consider multiple factors when making trading decisions.
Support us:)
If you find this new indicator helpful in your trading analysis, I would greatly appreciate your support! Please consider to follow, giving it a like, leaving feedback, or sharing it with your trading network. Your engagement will not only help me improve this tool but will also help other traders discover it and benefit from its features. Thank you for your support!

Buy/Sell singal with RSI, MA, RSI DIV1. Overview
I'll explain a strategy that uses the simple but powerful technical analysis techniques RSI, MA, VOLUME, and RSI Divergence to identify Buy/Sell signals. This strategy utilizes Pine Script of TradingView.
Our strategy is based on four fundamental components.
- RSI (Relative Strength Index)
- MA (Moving Averages)
- Volume
- RSI Divergence
By using these four techniques together, we can find potential buy/sell signals.
2. Code Interpretation
To understand the TradingView code we used, let's examine each section one by one.
- RSI Calculation: RSI is a technical indicator that measures the relative strength of a price and is often used to identify overbought or oversold conditions. In our code, we calculate the RSI over a given period.
- Moving Averages: This code calculates short-term and long-term moving averages. Moving averages represent the average price over a specific period and are used to identify long-term price trends. Their intersections are considered potential buy/sell signals.
- RSI Divergence: RSI divergence represents a mismatch between the price trend and the RSI trend. It occurs when the price makes a new high or low, but the RSI does not. This indicates a weakening of the price trend and is considered a powerful signal of trend change.
- Volume Calculation: When the volume of transactions occurring during a specific period is x times more than the average volume, it is considered a signal of trend change.
- Buy/Sell Signals: Each technical indicator generates buy or sell signals. These signals are marked as labels on the chart. In our strategy, buy/sell signals are generated when the RSI exits overbought or oversold zones, when the moving averages cross, and when RSI divergence occurs.
3. Signal Detection
3.1 Buy/Sell Signals Using RSI
The RSI indicator has a value between 0 and 100, with values over 70 generally considered the overbought zone and those under 30 as the oversold zone.
A buy signal is generated when the RSI rises from the oversold zone.
Conversely, a sell signal is generated when the RSI falls from the overbought zone.
3.2 Detecting Buy/Sell Signals Through Moving Average Crosses
Moving averages help identify price trends.
A buy signal is generated when the short-term moving average crosses the long-term moving average upward.
Conversely, a sell signal is generated when the short-term moving average crosses the long-term moving average downward.
The color of each bar can be changed according to each signal.
3.3 Detecting Signals When Volume is X Times Higher Than Average
When the volume is x times higher than average, a marker is placed above each bar.
A green marker is displayed when the buy volume is high.
A red marker is displayed when the sell volume is high.
4. Conclusion
This technical analysis strategy is very simple but effective. Using RSI, moving averages, volume, and RSI divergence, you can find effective buy/sell signals.
By leveraging Pine Script in TradingView, you can easily apply this strategy and find signals in real-time.
Always remember that risk management is important in trading. This strategy may not be effective in all market conditions, so always use appropriate risk management strategies alongside it.
----------------------------------------------------------------------------------------------------------------------------------------------------------------------------------------------------------------------------------------------------------------------------------------------
1. 개요
간단하지만 강력한 기술적 분석 전략인 RSI, MA, VOLUME, RSI Divergence를 사용한 Buy/Sell 신호 표시 전략에 대해 설명드리겠습니다.
이 전략은 트레이딩뷰의 Pine Script를 활용합니다.
우리의 전략은 다음 네 가지 기본 구성 요소에 기반합니다.
- RSI (Relative Strength Index)
- MA (Moving Averages)
- 거래량
- RSI Divergence
이 네 가지 기법을 함께 사용하여 잠재적인 매수/매도 신호를 찾아냅니다.
2. 코드 해석
우리가 사용한 트레이딩뷰 코드를 이해하기 위해 각 섹션을 하나씩 살펴보겠습니다.
RSI 계산: RSI는 가격의 상대적 강도를 측정하는 기술적 지표로, 과매수 또는 과매도 조건을 식별하는 데 자주 사용됩니다. 우리의 코드에서는 주어진 기간 동안의 RSI를 계산합니다.
이동평균: 이 코드에서는 단기 이동평균과 장기 이동평균을 계산합니다. 이동평균은 특정 기간 동안의 가격 평균을 나타내며, 가격의 장기적인 트렌드를 식별하는 데 사용됩니다. 이들의 교차점은 잠재적인 매수/매도 신호로 간주됩니다.
RSI Divergence: RSI 다이버전스는 가격 추세와 RSI 추세 사이의 불일치를 나타냅니다. 가격이 새로운 고점 또는 저점을 만들면서 RSI가 그렇지 않을 때 발생합니다. 이것은 가격 트렌드의 약화를 나타내며 강력한 트렌드 변화 신호로 간주됩니다.
VOLUME 계산 : 특정 구간동안의 평균 거래량보다 x배 이상 거래량이 많이 발생하였을때 트렌드 변화 신호로 간주됩니다.
매수/매도 신호: 각 기술적 지표는 매수 또는 매도 신호를 생성합니다. 이러한 신호는 차트에 라벨로 표시됩니다. 우리의 전략에서는 RSI가 과매도 또는 과매수 영역을 벗어날 때, 이동평균이 교차할 때, 그리고 RSI 다이버전스가 발생할 때 매수/매도 신호를 생성합니다.
3. 신호 감지
3.1 RSI를 활용한 매수/매도 신호
RSI 지표는 0에서 100 사이의 값을 가지며, 일반적으로 70 이상은 과매수 영역, 30 이하는 과매도 영역으로 간주됩니다.
과매도 영역에서 RSI가 상승하면 매수 신호가 생성됩니다.
반대로, 과매수 영역에서 RSI가 하락하면 매도 신호가 생성됩니다.
3.2 이동평균 교차로 매수/매도 신호 감지
이동평균은 가격의 트렌드를 식별하는 데 도움이 됩니다.
단기 이동평균이 장기 이동평균을 상승으로 교차하면 매수 신호가 생성됩니다.
반대로, 단기 이동평균이 장기 이동평균을 하락으로 교차하면 매도 신호가 생성됩니다.
각 신호에 따라 해당 봉의 색깔도 변경할 수 있습니다.
3.3 평균 거래량보다 x배 이상 거래량이 발생했을 때 신호 감지
평균 거래량보다 x배 이상 거래량이 발생했을 때 각 봉 위에 표시가 됩니다.
매수 거래량이 많을 경우 초록색으로 표시가 됩니다.
매도 거래량이 많을 경우 빨간색으로 표시가 됩니다.
* 모든 기준이 되는 수치와 색상은 설정에서 개인의 취향에 맞게 설정 가능합니다.
4. 결론
이 기술적 분석 전략은 매우 간단하지만 효과적입니다. RSI, 이동평균, 거래량, RSI 다이버전스를 사용하여 효과적인 매수/매도 신호를 찾을 수 있습니다.
트레이딩뷰의 Pine Script를 활용하여 이 전략을 쉽게 적용하고, 실시간으로 신호를 찾아낼 수 있습니다.
항상 거래에 있어서는 리스크 관리가 중요하다는 점을 명심하십시오. 이 전략이 모든 시장 상황에 효과적이지는 않을 수 있으므로, 항상 적절한 리스크 관리 전략을 함께 사용해야 합니다.
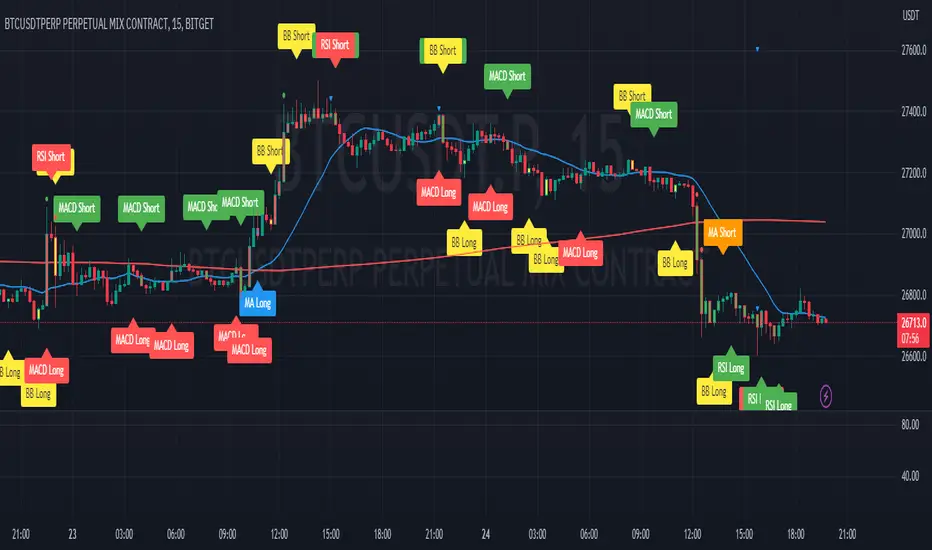
Sakura 2The oscillator uses an adaptive moving average as input to another RSI oscillator and is designed to provide a way to minimize the impact of corrections on the output of the oscillator without significant lag.
An additional trigger line is present in order to provide entry points from intersections between the oscillator and the trigger line.
I'll be working on the code to add and describe the privileges and the best settings
Settings
=Lengthy : period of the oscillator
=Power : controls the sensitivity of the oscillator to retracements, with higher values minimizing the sensitivity to retracements.
=Src : source input of the indicator
The indicator also includes the following graphical settings:
=Gradient : Determines the color mode to use for the gradient, options include "Red To Green", "Red To Blue" and "None", with "None" displaying no gradient.
=Color fill : Determines whether to fill the area between the oscillator and the trigger line or not, by default "On".
=Circles : Determines whether to show circles highlighting the crosses between the oscillator and the trigger line.
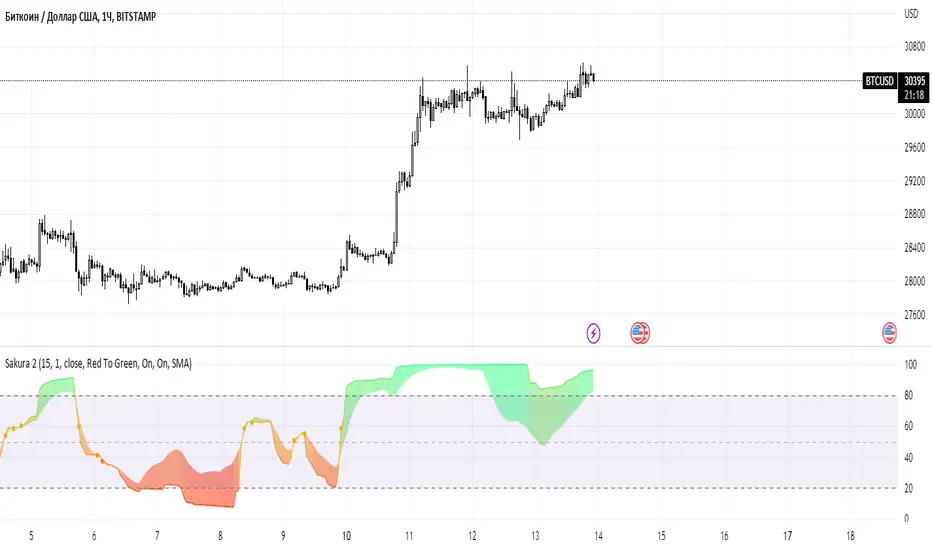
Divergence for Many [Dimkud - v5]Strategy is based on "Divergence for Many Indicators v4 ST" strategy by CannyTolany01
which is based on "Divergence for Many Indicator" indicator by LonesomeTheBlue
This strategy is searching for divergences on 18 indicators which you can select and optimise one by one.
Additionally you can connect any other External Indicator value. (just add this indicator the the chart and select option in settings)
To the original indicator/strategy I have added 9 additional indicators:
( Money Flow Index, Williams_Vix, Stochastic RSI , SMI Ergodic Oscillator, Volume Weighted MACD , Bull Bear Power, Balance of Power , Relative Volatility Index , Logistic Settings).
Converted strategy to v5 of Pine Script.
Added Static SL/TP in percents (%).
Added filters to filter enters:
1. Volume Weighted MACD - Multi-TimeFrame Filter
(It checks for histogram to falling or rising for a set periods of bars)
2. Money Flow Index - Multi-TimeFrame Filter
(It checks if MFI Oscillator is in the set diapason.
Also It checks if MFI is falling or rising for a set periods of bars )
3. ATR filter
(check changes in fast ATR to slow ATR )
Strategy shows good backtest results on many crypto tokens on 45m - 1h periods. (with parameters optimisation for every indicator)
To find best parameters - you can enable indicators one-by one, and optimise best parameters for each of them.
Then enable all indicators with successful results.
Optimise SL/TP.
Then try to enable and optimise filters (channels etc.)
The better is to optimise parameters separately for Short and Long trading. And run two separate bots (in settings enable only Long or only Short.)
Updates:
- Added visualisation for open trades (SL/TP)
- Added Volatility filter by ATR with many options for tests.
- Fixed some small bugs.
- Added second RSI filter (you can use two RSIs with different TF or settings)
- Updated ATR volatility and MFI filter. Removed non-effective options
- Added CCI filter
- Added option to Enable/Disable visualisation of TP/SL on chart
- Fixed one small quick bug. ("ATR filter short" was not working)
- Added Super Trend filter
- Added Momentum filter
- Added Volume Filter
- All "request.security" MultiTimeFrame calls changed to 100% non-repait function "f_security()"

RSIOMA with Volume Index ConfirmationThis indicator is called "RSIOMA with Volume Index Confirmation". It is a technical analysis tool that plots buy and sell signals on a chart based on the Relative Strength Index (RSI) and the Negative Volume Index (NVI) and Positive Volume Index (PVI) indicators.
The indicator has the following input parameters:
- RSI Length: determines the number of periods used to calculate the RSI. Default value is 14.
- Overbought Level: determines the RSI level at which a security is considered overbought. Default value is 70.
- Oversold Level: determines the RSI level at which a security is considered oversold. Default value is 30.
- NVI Length: determines the number of periods used to calculate the Negative Volume Index. Default value is 255.
- PVI Length: determines the number of periods used to calculate the Positive Volume Index. Default value is 255.
The indicator calculates the RSI using the RSI Length input parameter and the close price of the security. It also calculates the NVI and PVI by looping through the volume data and the close price data of the security over the specified periods.
The indicator then uses the RSI, NVI, and PVI to determine buy and sell signals. A bearish divergence signal is generated when the RSI from one period ago is greater than the Overbought Level, the current RSI is less than the Overbought Level, and the close price from one period ago is greater than the current close price. A bullish divergence signal is generated when the RSI from one period ago is less than the Oversold Level, the current RSI is greater than the Oversold Level, and the close price from one period ago is less than the current close price. A sell signal is generated when a bearish divergence signal occurs and the current NVI is less than the previous NVI value. A buy signal is generated when a bullish divergence signal occurs and the current PVI is greater than the previous PVI value.
The indicator plots the buy and sell signals on the chart as green and red triangles, respectively. The "overlay=true" parameter in the indicator function indicates that the signals are plotted on top of the security's price chart.
