Swiss Knife [MERT]Introduction
The Swiss Knife indicator is a comprehensive trading tool designed to provide a multi-dimensional analysis of the market. By integrating a wide array of technical indicators across multiple timeframes, it offers traders a holistic view of market sentiment, momentum, and potential reversal points. This indicator is particularly useful for traders looking to combine trend analysis, momentum indicators, volume data, and price action into a single, easy-to-read format.
---
Key Features
Multi-Timeframe Analysis : Evaluates indicators on Daily , 4-Hour , 1-Hour , and 15-Minute timeframes.
Comprehensive Indicator Suite : Incorporates MACD , Awesome Oscillator (AO) , Parabolic SAR , SuperTrend , DPO , RSI , Stochastic Oscillator , Bollinger Bands , Ichimoku Cloud , Chande Momentum Oscillator (CMO) , Donchian Channels , ADX , volume-based momentum indicators, Fractals , and divergence detection.
Market Sentiment Scoring : Aggregates signals from multiple indicators to provide an overall sentiment score.
Visual Aids : Displays EMA lines, trendlines, divergence signals, and a sentiment table directly on the chart.
Super Trend Reversal Signals : Identifies potential market reversal points by assessing the momentum of automated trading bots.
---
Explanation of Each Indicator
Moving Average Convergence Divergence (MACD)
- Purpose : Measures the relationship between two moving averages of price.
- Interpretation : A positive histogram suggests bullish momentum; a negative histogram indicates bearish momentum.
Awesome Oscillator (AO)
- Purpose : Gauges market momentum by comparing recent market movements to historic ones.
- Interpretation : Above zero indicates bullish momentum; below zero indicates bearish momentum.
Parabolic SAR (SAR)
- Purpose : Identifies potential reversal points in price direction.
- Interpretation : Dots below price suggest an uptrend; dots above price suggest a downtrend.
SuperTrend
- Purpose : Determines the prevailing market trend.
- Interpretation : Provides buy or sell signals based on price movements relative to the SuperTrend line.
Detrended Price Oscillator (DPO)
- Purpose : Removes trend from price to identify cycles.
- Interpretation : Values above zero suggest price is above the moving average; values below zero indicate it is below.
Relative Strength Index (RSI)
- Purpose : Measures the speed and change of price movements.
- Interpretation : Values above 50 indicate bullish momentum; values below 50 indicate bearish momentum.
Stochastic Oscillator
- Purpose : Compares a particular closing price to a range of its prices over a certain period.
- Interpretation : Values above 50 indicate bullish conditions; values below 50 indicate bearish conditions.
Bollinger Bands (BB)
- Purpose : Measures market volatility and provides relative price levels.
- Interpretation : Price above the middle band suggests bullishness; below the middle band suggests bearishness.
Ichimoku Cloud
- Purpose : Provides support and resistance levels, trend direction, and momentum.
- Interpretation : Bullish signals when price is above the cloud; bearish signals when price is below the cloud.
Chande Momentum Oscillator (CMO)
- Purpose : Measures momentum on both up and down days.
- Interpretation : Values above 50 indicate strong upward momentum; values below -50 indicate strong downward momentum.
Donchian Channels
- Purpose : Identifies volatility and potential breakouts.
- Interpretation : Price above the upper band suggests bullish breakout; below the lower band suggests bearish breakout.
Average Directional Index (ADX)
- Purpose : Measures the strength of a trend.
- Interpretation : DI+ above DI- indicates bullish trend; DI- above DI+ indicates bearish trend.
Volume Momentum Indicators (VolMom, CumVolMom, POCMom)
- Purpose : Analyze volume to assess buying and selling pressure.
- Interpretation : Positive values suggest bullish volume momentum; negative values indicate bearish volume momentum.
Fractals
- Purpose : Identify potential reversal points in the market.
- Interpretation : Up fractals may indicate a future downtrend; down fractals may indicate a future uptrend.
Divergence Detection
- Purpose : Identifies divergences between price and various indicators (RSI, MACD, Stochastic, OBV, MFI, A/D Line).
- Interpretation : Bullish divergences suggest potential upward reversal; bearish divergences suggest potential downward reversal.
- Note : This functionality utilizes the library from Divergence Indicator .
---
Coloring Scheme
Background Color
- Purpose : Reflects the overall market sentiment by combining sentiment scores from all indicators across different timeframes.
- Interpretation :
- Green Shades : Indicate bullish market sentiment.
- Red Shades : Indicate bearish market sentiment.
- Intensity : The strength of the color corresponds to the strength of the sentiment score.
Sentiment Table
- Purpose : Displays the status of each indicator across different timeframes.
- Interpretation :
- Green Cell : The indicator suggests a bullish signal.
- Red Cell : The indicator suggests a bearish signal.
- Percentage Score : Indicates the overall bullish or bearish sentiment on that timeframe.
Exponential Moving Averages (EMAs)
- Purpose : Provide dynamic support and resistance levels.
- Colors :
- EMA 10 : Lime
- EMA 20 : Yellow
- EMA 50 : Orange
- EMA 100 : Red
- EMA 200 : Purple
Trendlines
- Purpose : Visual representation of support and resistance levels based on pivot points.
- Interpretation :
- Upward Trendlines : Colored green , indicating support levels.
- Downward Trendlines : Colored red , indicating resistance levels.
- Note : Trendlines are drawn using the library from Simple Trendlines .
---
Utility of Market Sentiment
The indicator aggregates signals from multiple technical indicators across various timeframes to compute an overall market sentiment score . This comprehensive approach helps traders understand the prevailing market conditions by:
Confirming Trends : Multiple indicators pointing in the same direction can confirm the strength of a trend.
Identifying Reversals : Divergences and fractals can signal potential turning points.
Timeframe Alignment : Aligning signals across different timeframes can enhance the probability of successful trades.
---
Divergences
Divergence occurs when the price of an asset moves in the opposite direction of a technical indicator, suggesting a potential reversal.
- Bullish Divergence : Price makes a lower low, but the indicator makes a higher low.
- Bearish Divergence : Price makes a higher high, but the indicator makes a lower high.
The indicator detects divergences for:
RSI
MACD
Stochastic Oscillator
On-Balance Volume (OBV)
Money Flow Index (MFI)
Accumulation/Distribution Line (A/D Line)
By identifying these divergences, traders can spot early signs of trend reversals and adjust their strategies accordingly.
---
Trendlines
Trendlines are essential tools for identifying support and resistance levels. The indicator automatically draws trendlines based on pivot points:
- Upward Trendlines (Support) : Connect higher lows, indicating an uptrend.
- Downward Trendlines (Resistance) : Connect lower highs, indicating a downtrend.
These trendlines help traders visualize the trend direction and potential breakout or reversal points.
---
Super Trend Reversals (ST Reversal)
The core idea behind the Super Trend Reversals indicator is to assess the momentum of automated trading bots (often referred to as 'Supertrend bots') that enter the market during critical turning points. Specifically, the indicator is tuned to identify when the market is nearing bottoms or peaks, just before it shifts direction based on the triggered Supertrend signals. This approach helps traders:
Engage Early : Enter the market as reversal momentum builds up.
Optimize Entries and Exits : Enter under favorable conditions and exit before momentum wanes.
By capturing these reversal points, traders can enhance their trading performance.
---
Conclusion
The Swiss Knife indicator serves as a versatile tool that combines multiple technical analysis methods into a single, comprehensive indicator. By assessing various aspects of the market—including trend direction, momentum, volume, and price action—it provides traders with valuable insights to make informed trading decisions.
---
Citations
- Divergence Detection Library : Divergence Indicator by DevLucem
- Trendline Drawing Library : Simple Trendlines by HoanGhetti
---
Note : This indicator is intended for informational purposes and should be used in conjunction with other analysis techniques. Always perform due diligence before making trading decisions.
---
在腳本中搜尋"非ST、非创业板、非科创板主板股票的筹码分布数据"

Momentum with ATR and Volatility [ST]Momentum with ATR and Volatility
Description in English:
This indicator combines price momentum with market volatility to identify entry and exit points in trades.
It utilizes the difference in closing prices (momentum) and the Average True Range (ATR) to measure volatility. Buy and sell signals are generated based on the combination of these two components.
Detailed Explanation:
Configuration:
Momentum Length: This input defines the period for calculating the momentum, which is the difference between the closing prices. The default value is 10.
ATR Length: This input defines the period for calculating the Average True Range (ATR), which measures market volatility. The default value is 14.
ATR Threshold: This input defines the threshold multiplier for the ATR to generate buy and sell signals. The default value is 3.5.
Momentum Calculation:
Momentum is calculated as the difference between the current closing price and the closing price momentum_length periods ago.
ATR Calculation:
The ATR is calculated based on the specified length and is used to measure market volatility.
Buy and Sell Signals:
Buy Signal: Generated when momentum is positive, the current close is higher than the previous close, and momentum is greater than ATR * threshold.
Sell Signal: Generated when momentum is negative, the current close is lower than the previous close, and momentum is less than -ATR * threshold.
Plotting:
Buy signals are plotted as green triangles below the bars.
Sell signals are plotted as red triangles above the bars.
Momentum and ATR thresholds are plotted in a separate panel below the main chart.
Momentum is plotted as a blue line.
The ATR threshold lines are plotted as solid orange lines.
Indicator Benefits:
Momentum Measurement: Helps traders gauge the momentum of price movements.
Volatility Measurement: Utilizes ATR to measure market volatility, providing a more comprehensive analysis.
Visual Cues: Provides clear visual signals for buy and sell points, aiding in making informed trading decisions.
Justification of Component Combination:
Combining momentum with ATR provides a more robust measure of potential entry and exit points by considering both price movement and market volatility.
How Components Work Together:
The script calculates momentum and ATR for the specified periods.
It generates buy and sell signals based on the conditions of momentum and ATR.
The signals and values are plotted on the chart to provide a visual representation, helping traders identify potential trading opportunities.
Título: Indicador de Momentum com ATR e Volatilidade
Descrição em Português:
Este indicador combina o momentum do preço com a volatilidade do mercado para identificar pontos de entrada e saída em operações.
Utiliza a diferença entre os preços de fechamento (momentum) e o Average True Range (ATR) para medir a volatilidade. Sinais de compra e venda são gerados com base na combinação desses dois componentes.
Explicação Detalhada:
Configuração:
Comprimento do Momentum: Este parâmetro define o período para calcular o momentum, que é a diferença entre os preços de fechamento. O valor padrão é 10.
Comprimento do ATR: Este parâmetro define o período para calcular o Average True Range (ATR), que mede a volatilidade do mercado. O valor padrão é 14.
Limite do ATR: Este parâmetro define o multiplicador de limite para o ATR para gerar sinais de compra e venda. O valor padrão é 3.5.
Cálculo do Momentum:
O momentum é calculado como a diferença entre o preço de fechamento atual e o preço de fechamento momentum_length períodos atrás.
Cálculo do ATR:
O ATR é calculado com base no comprimento especificado e é usado para medir a volatilidade do mercado.
Sinais de Compra e Venda:
Sinal de Compra: Gerado quando o momentum é positivo, o fechamento atual é maior que o fechamento anterior, e o momentum é maior que ATR * threshold.
Sinal de Venda: Gerado quando o momentum é negativo, o fechamento atual é menor que o fechamento anterior, e o momentum é menor que -ATR * threshold.
Plotagem:
Sinais de compra são plotados como triângulos verdes abaixo das barras.
Sinais de venda são plotados como triângulos vermelhos acima das barras.
O momentum e os limites do ATR são plotados em um painel separado abaixo do gráfico principal.
O momentum é plotado como uma linha azul.
As linhas de limite do ATR são plotadas como linhas laranjas sólidas.
Benefícios do Indicador:
Medição do Momentum: Ajuda os traders a avaliar o momentum dos movimentos de preços.
Medição da Volatilidade: Utiliza o ATR para medir a volatilidade do mercado, proporcionando uma análise mais abrangente.
Sinais Visuais: Fornece sinais visuais claros para pontos de compra e venda, auxiliando na tomada de decisões informadas.
Justificação da Combinação de Componentes:
Combinar o momentum com o ATR fornece uma medida mais robusta de potenciais pontos de entrada e saída ao considerar tanto o movimento dos preços quanto a volatilidade do mercado.
Como os Componentes Funcionam Juntos:
O script calcula o momentum e o ATR para os períodos especificados.
Gera sinais de compra e venda com base nas condições de momentum e ATR.
Os sinais e valores são plotados no gráfico para fornecer uma representação visual, ajudando os traders a identificar oportunidades de negociação potenciais.

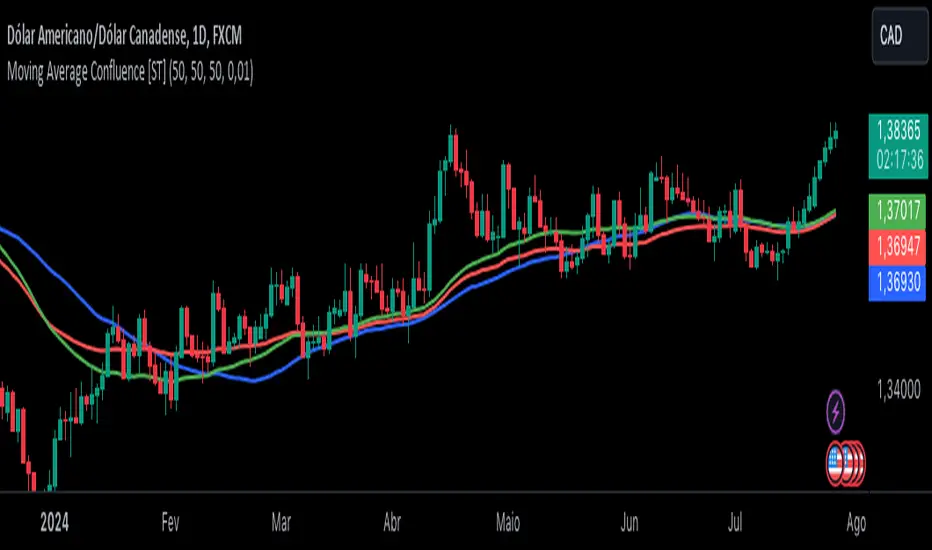
Moving Average Confluence [ST]Moving Average Confluence
Description in English:
This indicator uses multiple moving averages (SMA, EMA, WMA) with different periods to identify confluence points that can indicate support or resistance zones.
Detailed Explanation:
Configuration:
SMA Length: This input defines the period for the Simple Moving Average (SMA). The default value is 50.
EMA Length: This input defines the period for the Exponential Moving Average (EMA). The default value is 50.
WMA Length: This input defines the period for the Weighted Moving Average (WMA). The default value is 50.
Confluence Threshold: This input defines the maximum allowable difference between the moving averages to consider them in confluence. The default value is 0.01.
Calculation of Moving Averages:
SMA: Calculated as the simple arithmetic mean of the closing prices over the specified period.
EMA: Calculated by giving more weight to recent prices.
WMA: Calculated by weighting the closing prices based on their age.
Identification of Confluence:
Confluence is identified when the differences between SMA, EMA, and WMA are all within the specified threshold. This can indicate potential support or resistance zones.
Plotting:
The SMA, EMA, and WMA are plotted with different colors for easy identification.
Confluence points are marked with yellow labels on the chart.
Indicator Benefits:
Support and Resistance Identification: Helps traders identify potential support and resistance zones through the confluence of different moving averages.
Visual Cues: Provides clear visual signals for confluence points, aiding in making informed trading decisions.
Customizable Parameters: Allows traders to adjust the periods of the moving averages and the confluence threshold to suit different trading strategies and market conditions.
Justification of Component Combination:
Combining multiple types of moving averages (SMA, EMA, WMA) provides a comprehensive view of market trends. Identifying confluence points where these averages are close together can indicate strong support or resistance levels.
How Components Work Together:
The script calculates the SMA, EMA, and WMA for the specified periods.
It then checks if the differences between these moving averages are within the specified threshold.
When a confluence is detected, it is marked on the chart with a yellow label, providing a clear visual signal to the trader.
Título: Confluência de Médias Móveis
Descrição em Português:
Este indicador utiliza várias médias móveis (SMA, EMA, WMA) com diferentes períodos para identificar pontos de confluência que podem indicar zonas de suporte ou resistência.
Explicação Detalhada:
Configuração:
Comprimento da SMA: Este parâmetro define o período para a Média Móvel Simples (SMA). O valor padrão é 50.
Comprimento da EMA: Este parâmetro define o período para a Média Móvel Exponencial (EMA). O valor padrão é 50.
Comprimento da WMA: Este parâmetro define o período para a Média Móvel Ponderada (WMA). O valor padrão é 50.
Limite de Confluência: Este parâmetro define a diferença máxima permitida entre as médias móveis para considerá-las em confluência. O valor padrão é 0.01.
Cálculo das Médias Móveis:
SMA: Calculada como a média aritmética simples dos preços de fechamento ao longo do período especificado.
EMA: Calculada atribuindo mais peso aos preços mais recentes.
WMA: Calculada ponderando os preços de fechamento com base em sua idade.
Identificação de Confluência:
A confluência é identificada quando as diferenças entre SMA, EMA e WMA estão todas dentro do limite especificado. Isso pode indicar potenciais zonas de suporte ou resistência.
Plotagem:
A SMA, EMA e WMA são plotadas com cores diferentes para fácil identificação.
Pontos de confluência são marcados com etiquetas amarelas no gráfico.
Benefícios do Indicador:
Identificação de Suporte e Resistência: Ajuda os traders a identificar potenciais zonas de suporte e resistência através da confluência de diferentes médias móveis.
Sinais Visuais Claros: Fornece sinais visuais claros para pontos de confluência, auxiliando na tomada de decisões informadas.
Parâmetros Personalizáveis: Permite que os traders ajustem os períodos das médias móveis e o limite de confluência para se adequar a diferentes estratégias de negociação e condições de mercado.
Justificação da Combinação de Componentes:
Combinar vários tipos de médias móveis (SMA, EMA, WMA) fornece uma visão abrangente das tendências do mercado. Identificar pontos de confluência onde essas médias estão próximas pode indicar níveis fortes de suporte ou resistência.
Como os Componentes Funcionam Juntos:
O script calcula a SMA, EMA e WMA para os períodos especificados.
Em seguida, verifica se as diferenças entre essas médias móveis estão dentro do limite especificado.
Quando uma confluência é detectada, ela é marcada no gráfico com uma etiqueta amarela, fornecendo um sinal visual claro para o trader.
Trend Strength with Volatility and Volume [ST]Trend Strength with Volatility and Volume
Description in English:
This indicator combines market volatility and trading volume to measure the current trend strength. It helps identify when the trend is gaining or losing momentum.
Detailed Explanation:
Configuration:
Length: This input defines the period over which the moving average is calculated. The default value is 14.
MA Type: This input allows you to choose between a Simple Moving Average (SMA) and an Exponential Moving Average (EMA).
Volatility Length: This input defines the period over which the ATR (Average True Range) is calculated. The default value is 14.
Volume Length: This input defines the period over which the moving average of volume is calculated. The default value is 14.
Trend Strength Calculation:
Moving Average (MA): The script calculates the moving average of the closing price based on the selected type (SMA or EMA) and period.
Volatility (ATR): The ATR is used to measure market volatility over the specified period.
Volume MA: The script calculates the moving average of the trading volume based on the selected type (SMA or EMA) and period.
Trend Strength: The trend strength is calculated as the difference between the closing price and the moving average, divided by the volatility, and multiplied by the volume normalized by its moving average.
Plotting:
The trend strength is plotted as a line chart. Positive values indicate a strong upward trend, while negative values indicate a strong downward trend.
A horizontal line is added at the zero level to help identify the neutral point.
Indicator Benefits:
Trend Identification: Helps traders identify the strength of the current trend by combining price, volatility, and volume.
Visual Cues: Provides clear visual signals for trend strength, aiding in making informed trading decisions.
Customizable Parameters: Allows traders to adjust the length of the moving averages, ATR, and volume to suit different trading strategies and market conditions.
Justification of Component Combination:
Combining price, volatility, and volume provides a comprehensive measure of trend strength. This combination enhances the trader's ability to make informed decisions based on multiple market factors.
How Components Work Together:
The script calculates the moving average of the closing price and trading volume.
It measures market volatility using the ATR.
The trend strength is calculated by combining these components, providing a robust measure of the current trend's strength.
Título: Força da Tendência com Volatilidade e Volume
Descrição em Português:
Este indicador combina a volatilidade do mercado, medida pelo ATR (Average True Range), e o volume de negociações para medir a força da tendência atual. Ele ajuda a identificar quando a tendência está ganhando ou perdendo força.
Explicação Detalhada:
Configuração:
Comprimento: Este parâmetro define o período para o cálculo da média móvel. O valor padrão é 14.
Tipo de MA: Este parâmetro permite escolher entre uma Média Móvel Simples (SMA) e uma Média Móvel Exponencial (EMA).
Comprimento da Volatilidade: Este parâmetro define o período para o cálculo do ATR (Average True Range). O valor padrão é 14.
Comprimento do Volume: Este parâmetro define o período para o cálculo da média móvel do volume. O valor padrão é 14.
Cálculo da Força da Tendência:
Média Móvel (MA): O indicador calcula a média móvel do preço de fechamento com base no tipo selecionado (SMA ou EMA) e período.
Volatilidade (ATR): O ATR é usado para medir a volatilidade do mercado ao longo do período especificado.
Média Móvel do Volume: O indicador calcula a média móvel do volume de negociação com base no tipo selecionado (SMA ou EMA) e período.
Força da Tendência: A força da tendência é calculada como a diferença entre o preço de fechamento e a média móvel, dividida pela volatilidade e multiplicada pelo volume normalizado pela sua média móvel.
Plotagem:
A força da tendência é plotada como um gráfico de linhas. Valores positivos indicam uma forte tendência de alta, enquanto valores negativos indicam uma forte tendência de baixa.
Uma linha horizontal é adicionada no nível zero para ajudar a identificar o ponto neutro.
Benefícios do Indicador:
Identificação de Tendências: Este indicador ajuda os traders a identificar a força da tendência atual, combinando preço, volatilidade e volume.
Sinais Visuais Claros: Fornece sinais visuais claros para a força da tendência, facilitando a tomada de decisões informadas.
Parâmetros Personalizáveis: Os traders podem ajustar o comprimento das médias móveis, ATR e volume para se adequar a diferentes estratégias de negociação e condições de mercado.
Justificação da Combinação de Componentes:
A combinação de preço, volatilidade e volume fornece uma medida abrangente da força da tendência.
Isso melhora a capacidade dos traders de tomar decisões informadas com base em múltiplos fatores do mercado.
Como os Componentes Funcionam Juntos:
O indicador calcula a média móvel do preço de fechamento e do volume de negociação.
Mede a volatilidade do mercado usando o ATR.
A força da tendência é calculada combinando esses componentes, fornecendo uma medida robusta da força da tendência atual.

Double Top, Double Bottom & Head and Shoulders Patterns [ST]Double Top, Double Bottom & Head and Shoulders Patterns
Description in English:
This indicator identifies double top, double bottom, head and shoulders, and inverse head and shoulders patterns on a 4-hour timeframe. It marks the pivot points with circles and outlines the structures with lines, providing clear visual signals of these important reversal patterns.
The colors are customizable for each pattern type.
Detailed Explanation:
Configuration:
Pivot Length: This input defines the period over which pivot points are calculated. The default value is 10.
Circle Color: This input sets the color of the circles that mark the identified double top and double bottom patterns. The default color is blue.
Line Color: This input sets the color of the lines that circle the identified structures of double top and double bottom patterns. The default color is red.
Head and Shoulders Color: This input sets the color of the circles and lines that mark the head and shoulders patterns. The default color is orange.
Inverse Head and Shoulders Color: This input sets the color of the circles and lines that mark the inverse head and shoulders patterns. The default color is purple.
Pattern Identification:
Pivot High and Low: The script uses the pivothigh and pivotlow functions to identify local maxima and minima, essential for detecting the patterns.
Double Top: Identified when there are two pivot highs within the pivot length, and the second high is equal to the first. This pattern typically indicates a potential reversal from an uptrend to a downtrend.
Double Bottom: Identified when there are two pivot lows within the pivot length, and the second low is equal to the first. This pattern typically indicates a potential reversal from a downtrend to an uptrend.
Head and Shoulders: Identified when there is a higher pivot high (head) between two lower pivot highs (shoulders), indicating a potential reversal from an uptrend to a downtrend.
Inverse Head and Shoulders: Identified when there is a lower pivot low (head) between two higher pivot lows (shoulders), indicating a potential reversal from a downtrend to an uptrend.
Drawing Circles and Lines:
Double Top: Marked with blue circles and red lines.
Double Bottom: Marked with blue circles and red lines.
Head and Shoulders: Marked with orange circles and lines.
Inverse Head and Shoulders: Marked with purple circles and lines.
Indicator Benefits:
Pattern Identification: Helps traders identify key reversal patterns (double top, double bottom, head and shoulders, and inverse head and shoulders) on the 4-hour timeframe.
Visual Cues: Provides clear visual signals for these patterns, aiding in making informed trading decisions.
Customizable Parameters: Allows traders to adjust the pivot length, circle color, line color, head and shoulders color, and inverse head and shoulders color to suit different trading strategies and market conditions.
Justification of Component Combination:
Combining pivot point identification with pattern recognition provides a robust method for detecting significant reversal patterns. The visual cues enhance the trader's ability to quickly spot these patterns on the chart.
How Components Work Together:
The script first identifies pivot points based on the specified pivot length.
It then checks for the presence of double top, double bottom, head and shoulders, and inverse head and shoulders patterns using these pivot points.
When a pattern is identified, it is marked with a circle on the chart, and lines are drawn around the structure to provide a clear visual indication of the pattern's presence.
Título: Padrões de Morro Duplo, Fundo Duplo e Ombro-Cabeça-Ombro
Descrição em Português:
Este indicador identifica padrões de morro duplo, fundo duplo, ombro-cabeça-ombro e ombro-cabeça-ombro invertido no gráfico de 4 horas.
Ele marca os pontos de pivô com círculos e contorna as estruturas com linhas, fornecendo sinais visuais claros desses importantes padrões de reversão. As cores são personalizáveis para cada tipo de padrão.
Explicação Detalhada:
Configuração:
Comprimento do Pivô: Este input define o período sobre o qual os pontos de pivô são calculados. O valor padrão é 10.
Cor do Círculo: Este input define a cor dos círculos que marcam os padrões identificados de morro duplo e fundo duplo. A cor padrão é azul.
Cor da Linha: Este input define a cor das linhas que contornam as estruturas identificadas de morro duplo e fundo duplo. A cor padrão é vermelha.
Cor de Ombro-Cabeça-Ombro: Este input define a cor dos círculos e linhas que marcam os padrões de ombro-cabeça-ombro. A cor padrão é laranja.
Cor de Ombro-Cabeça-Ombro Invertido: Este input define a cor dos círculos e linhas que marcam os padrões de ombro-cabeça-ombro invertido. A cor padrão é lilás.
Identificação de Padrões:
Pivô Alto e Baixo: O script usa as funções pivothigh e pivotlow para identificar máximas e mínimas locais, essenciais para detectar os padrões.
Morro Duplo: Identificado quando há duas máximas de pivô dentro do comprimento do pivô, e a segunda máxima é igual à primeira. Este padrão geralmente indica uma reversão potencial de uma tendência de alta para uma tendência de baixa.
Fundo Duplo: Identificado quando há duas mínimas de pivô dentro do comprimento do pivô, e a segunda mínima é igual à primeira. Este padrão geralmente indica uma reversão potencial de uma tendência de baixa para uma tendência de alta.
Ombro-Cabeça-Ombro: Identificado quando há uma máxima de pivô mais alta (cabeça) entre duas máximas de pivô mais baixas (ombros), indicando uma reversão potencial de uma tendência de alta para uma tendência de baixa.
Ombro-Cabeça-Ombro Invertido: Identificado quando há uma mínima de pivô mais baixa (cabeça) entre duas mínimas de pivô mais altas (ombros), indicando uma reversão potencial de uma tendência de baixa para uma tendência de alta.
Desenho de Círculos e Linhas:
Morro Duplo: Marcado com círculos azuis e linhas vermelhas.
Fundo Duplo: Marcado com círculos azuis e linhas vermelhas.
Ombro-Cabeça-Ombro: Marcado com círculos e linhas laranjas.
Ombro-Cabeça-Ombro Invertido: Marcado com círculos e linhas lilás.
Benefícios do Indicador:
Identificação de Padrões: Ajuda os traders a identificar padrões-chave de reversão (morro duplo, fundo duplo, ombro-cabeça-ombro e ombro-cabeça-ombro invertido) no gráfico de 4 horas.
Sinais Visuais: Fornece sinais visuais claros para esses padrões, auxiliando na tomada de decisões informadas.
Parâmetros Personalizáveis: Permite que os traders ajustem o comprimento do pivô, a cor do círculo, a cor da linha, a cor de ombro-cabeça-ombro e a cor de ombro-cabeça-ombro invertido para se adequar a diferentes estratégias de negociação e condições de mercado.
Justificação da Combinação de Componentes:
Combinar a identificação de pontos de pivô com o reconhecimento de padrões fornece um método robusto para detectar padrões de reversão significativos. Os sinais visuais melhoram a capacidade do trader de identificar rapidamente esses padrões no gráfico.
Como os Componentes Funcionam Juntos:
O script primeiro identifica os pontos de pivô com base no comprimento do pivô especificado.
Em seguida, verifica a presença de padrões de morro duplo, fundo duplo, ombro-cabeça-ombro e ombro-cabeça-ombro invertido usando esses pontos de pivô.
Quando um padrão é identificado, ele é marcado com um círculo no gráfico, e linhas são desenhadas ao redor da estrutura para fornecer uma indicação visual clara da presença do padrão.

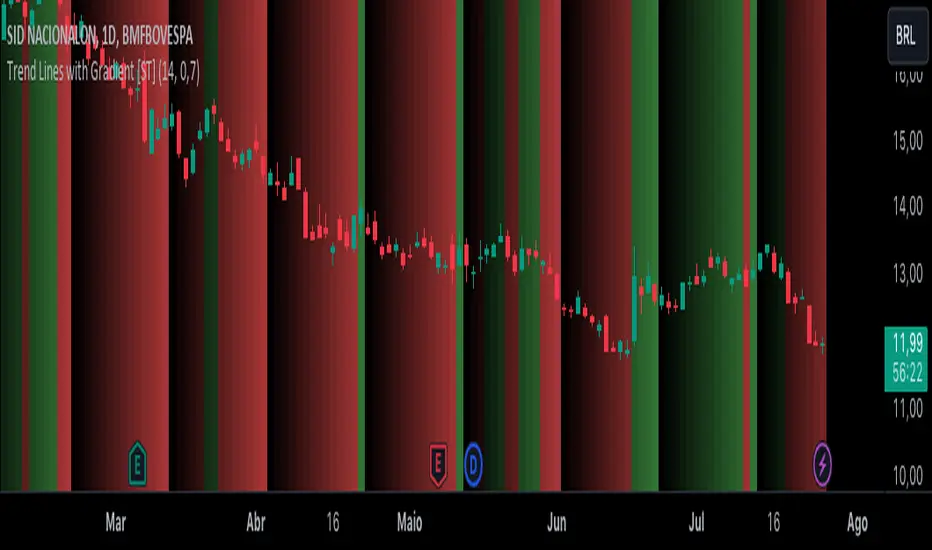
Trend Lines with Gradient [ST]Trend Lines with Gradient
Description in English:
This indicator identifies trend lines and applies a gradient coloring to visualize the strength of the trend over time.
The color is stronger at the beginning of the trend and weaker at the end, helping traders to visually assess the trend's development.
Detailed Explanation:
Configuration:
Length for Trend Calculation: This input defines the period over which the trend is calculated. The default value is 14. This means the script will look at the past 14 bars to determine the trend.
Uptrend Color: This input sets the base color for uptrend lines and gradient. The default color is green.
Downtrend Color: This input sets the base color for downtrend lines and gradient. The default color is red.
Color Strength: This input defines the strength of the color gradient. A higher value means a stronger gradient effect from the start to the end of the trend.
Trend Calculation:
The script calculates a simple moving average (SMA) over the defined length to identify trends.
Uptrend: Identified when the current close is above the SMA.
Downtrend: Identified when the current close is below the SMA.
Gradient Coloring:
The script uses a function to calculate the gradient color based on the position within the trend. The color is stronger at the beginning of the trend and becomes weaker towards the end.
Alpha Value: The transparency of the color is adjusted based on the position within the trend, creating a gradient effect.
Drawing Trend Lines:
Uptrend Lines: When an uptrend is identified, the script draws trend lines connecting the lows of the bars within the trend length, applying the gradient color.
Downtrend Lines: When a downtrend is identified, the script draws trend lines connecting the highs of the bars within the trend length, applying the gradient color.
These lines provide a visual representation of the trend strength over time.
Background Coloring:
The script also colors the background of the chart based on the trend, applying the gradient effect to further enhance visual cues for traders.
Indicator Benefits:
Visual Trend Identification: Helps traders quickly identify the direction and strength of trends using gradient coloring.
Enhanced Analysis: The gradient effect provides insights into the development of the trend, showing where it started strong and where it might be weakening.
Customizable Parameters: Allows traders to adjust the length for trend calculation and the strength of the gradient to suit different trading strategies and market conditions.
Justification of Component Combination:
Combining trend lines with gradient coloring provides a comprehensive visual tool for assessing trend strength and direction. The gradient effect enhances the trader's ability to see how trends develop over time.
How Components Work Together:
The script first calculates the SMA to identify trends.
It then draws trend lines connecting lows (for uptrends) and highs (for downtrends) with a gradient color.
The background color is also adjusted based on the trend direction, creating a unified visual tool for trend analysis.
Título: Linhas de Tendência com Gradiente
Descrição em Português:
Este indicador identifica linhas de tendência e aplica uma coloração em gradiente para visualizar a força da tendência ao longo do tempo. A cor é mais forte no início da tendência e mais fraca no final, ajudando os traders a avaliar visualmente o desenvolvimento da tendência.
Explicação Detalhada:
Configuração:
Comprimento para Cálculo da Tendência: Este input define o período sobre o qual a tendência é calculada. O valor padrão é 14. Isso significa que o script analisará os últimos 14 candles para determinar a tendência.
Cor da Tendência de Alta: Este input define a cor base para as linhas de tendência de alta e gradiente. A cor padrão é verde.
Cor da Tendência de Baixa: Este input define a cor base para as linhas de tendência de baixa e gradiente. A cor padrão é vermelha.
Força da Cor: Este input define a intensidade do efeito gradiente. Um valor mais alto significa um efeito de gradiente mais forte do início ao fim da tendência.
Cálculo da Tendência:
O script calcula uma média móvel simples (SMA) ao longo do comprimento definido para identificar as tendências.
Tendência de Alta: Identificada quando o fechamento atual está acima da SMA.
Tendência de Baixa: Identificada quando o fechamento atual está abaixo da SMA.
Coloração em Gradiente:
O script usa uma função para calcular a cor gradiente com base na posição dentro da tendência. A cor é mais forte no início da tendência e se torna mais fraca em direção ao final.
Valor Alpha: A transparência da cor é ajustada com base na posição dentro da tendência, criando um efeito de gradiente.
Desenho de Linhas de Tendência:
Linhas de Tendência de Alta: Quando uma tendência de alta é identificada, o script desenha linhas de tendência conectando as mínimas dos candles dentro do comprimento da tendência, aplicando a cor gradiente.
Linhas de Tendência de Baixa: Quando uma tendência de baixa é identificada, o script desenha linhas de tendência conectando as máximas dos candles dentro do comprimento da tendência, aplicando a cor gradiente.
Essas linhas fornecem uma representação visual da força da tendência ao longo do tempo.
Coloração de Fundo:
O script também colore o fundo do gráfico com base na tendência, aplicando o efeito gradiente para melhorar ainda mais as dicas visuais para os traders.
Benefícios do Indicador:
Identificação Visual de Tendências: Ajuda os traders a identificar rapidamente a direção e a força das tendências usando a coloração em gradiente.
Análise Aprimorada: O efeito gradiente fornece insights sobre o desenvolvimento da tendência, mostrando onde ela começou forte e onde pode estar enfraquecendo.
Parâmetros Personalizáveis: Permite que os traders ajustem o comprimento para cálculo da tendência e a intensidade do gradiente para se adequar a diferentes estratégias de negociação e condições de mercado.
Justificação da Combinação de Componentes:
Combinar linhas de tendência com coloração em gradiente fornece uma ferramenta visual abrangente para avaliar a força e a direção das tendências. O efeito gradiente melhora a capacidade do trader de ver como as tendências se desenvolvem ao longo do tempo.
Como os Componentes Funcionam Juntos:
O script primeiro calcula a SMA para identificar as tendências.
Em seguida, desenha linhas de tendência conectando mínimas (para tendências de alta) e máximas (para tendências de baixa) com uma cor gradiente.
A cor de fundo também é ajustada com base na direção da tendência, criando uma ferramenta visual unificada para análise de tendências.
Daily Liquidity Peaks and Troughs [ST]Daily Liquidity Peaks and Troughs
Description in English:
This indicator identifies peaks and troughs of highest liquidity on a daily timeframe by analyzing volume data. It helps traders visualize key points of high buying or selling pressure, which could indicate potential reversal or continuation areas.
Detailed Explanation:
Configuration:
Lookback Length: This input defines the period over which the highest high and lowest low are calculated. The default value is 14. This means the script will look at the past 14 bars to determine if the current high or low is a pivot point.
Volume Threshold Multiplier: This input defines the multiplier for the average volume. For example, a multiplier of 1.5 means the volume needs to be 1.5 times the average volume to be considered a significant peak or trough.
Peak Color: This input sets the color for liquidity peaks. The default color is red.
Trough Color: This input sets the color for liquidity troughs. The default color is green.
Volume Calculation:
Average Volume: The script calculates the simple moving average (SMA) of the volume over the lookback period. This helps to identify periods of significantly higher volume.
Volume Threshold: The threshold is determined by multiplying the average volume by the volume threshold multiplier. Only volumes exceeding this threshold are considered significant.
Identifying Peaks and Troughs:
Liquidity Peak: A peak is identified when the current high is the highest high over the lookback period and the current volume exceeds the volume threshold. This indicates a potential area of strong selling pressure.
Liquidity Trough: A trough is identified when the current low is the lowest low over the lookback period and the current volume exceeds the volume threshold. This indicates a potential area of strong buying pressure.
These peaks and troughs are marked on the chart with labels and shapes for easy visualization.
Plotting Peaks and Troughs:
Labels: The script uses labels to mark peaks and troughs on the chart. Peaks are marked with a red label and troughs with a green label.
Shapes: The script plots triangles above peaks and below troughs to highlight these areas visually.
Indicator Benefits:
Liquidity Identification: Helps traders identify key areas of high liquidity, indicating strong buying or selling pressure.
Visual Cues: Provides clear visual signals for potential reversal or continuation points, aiding in making informed trading decisions.
Customizable Parameters: Allows traders to adjust the lookback length and volume threshold to suit different trading strategies and market conditions.
Justification of Component Combination:
Peaks and Troughs Identification: Combining pivot points with volume analysis provides a robust method to identify significant liquidity areas. This helps in detecting potential market reversals or continuations.
Volume Analysis: Utilizing average volume and volume threshold ensures that only significant volume spikes are considered, enhancing the accuracy of identified peaks and troughs.
How Components Work Together:
The script first calculates the average volume over the specified lookback period.
It then checks each bar to see if it qualifies as a liquidity peak or trough based on the highest high, lowest low, and volume threshold.
When a peak or trough is identified, it is marked on the chart with a label and a shape, providing clear visual cues for traders.
Título: Picos e Fundos de Liquidez Diários
Descrição em Português:
Este indicador identifica picos e fundos de maior liquidez no gráfico diário, analisando os dados de volume. Ele ajuda os traders a visualizar pontos-chave de alta pressão de compra ou venda, o que pode indicar áreas potenciais de reversão ou continuação.
Explicação Detalhada:
Configuração:
Comprimento de Retrocesso: Este input define o período sobre o qual a máxima e mínima são calculadas. O valor padrão é 14. Isso significa que o script analisará os últimos 14 candles para determinar se a máxima ou mínima atual é um ponto de pivô.
Multiplicador de Limite de Volume: Este input define o multiplicador para o volume médio. Por exemplo, um multiplicador de 1.5 significa que o volume precisa ser 1.5 vezes o volume médio para ser considerado um pico ou fundo significativo.
Cor do Pico: Este input define a cor para os picos de liquidez. A cor padrão é vermelha.
Cor do Fundo: Este input define a cor para os fundos de liquidez. A cor padrão é verde.
Cálculo do Volume:
Volume Médio: O script calcula a média móvel simples (SMA) do volume ao longo do período de retrocesso. Isso ajuda a identificar períodos de volume significativamente mais alto.
Limite de Volume: O limite é determinado multiplicando o volume médio pelo multiplicador de limite de volume. Apenas volumes que excedem esse limite são considerados significativos.
Identificação de Picos e Fundos:
Pico de Liquidez: Um pico é identificado quando a máxima atual é a máxima mais alta no período de retrocesso e o volume atual excede o limite de volume. Isso indica uma potencial área de forte pressão de venda.
Fundo de Liquidez: Um fundo é identificado quando a mínima atual é a mínima mais baixa no período de retrocesso e o volume atual excede o limite de volume. Isso indica uma potencial área de forte pressão de compra.
Esses picos e fundos são marcados no gráfico com etiquetas e formas para fácil visualização.
Plotagem de Picos e Fundos:
Etiquetas: O script usa etiquetas para marcar picos e fundos no gráfico. Os picos são marcados com uma etiqueta vermelha e os fundos com uma etiqueta verde.
Formas: O script plota triângulos acima dos picos e abaixo dos fundos para destacar essas áreas visualmente.
Benefícios do Indicador:
Identificação de Liquidez: Ajuda os traders a identificar áreas-chave de alta liquidez, indicando forte pressão de compra ou venda.
Cues Visuais: Fornece sinais visuais claros para pontos potenciais de reversão ou continuação, auxiliando na tomada de decisões informadas.
Parâmetros Personalizáveis: Permite que os traders ajustem o comprimento de retrocesso e o limite de volume para se adequar a diferentes estratégias de negociação e condições de mercado.
Justificação da Combinação de Componentes:
Identificação de Picos e Fundos: A combinação de pontos de pivô com análise de volume fornece um método robusto para identificar áreas significativas de liquidez. Isso ajuda na detecção de potenciais reversões ou continuações de mercado.
Análise de Volume: Utilizar o volume médio e o limite de volume garante que apenas picos de volume significativos sejam considerados, aumentando a precisão dos picos e fundos identificados.
Como os Componentes Funcionam Juntos:
O script primeiro calcula o volume médio ao longo do período especificado de retrocesso.
Em seguida, verifica cada barra para ver se ela se qualifica como um pico ou fundo de liquidez com base

Enhanced Trend Arrows with Moving Average [ST]Enhanced Trend Arrows with Moving Average
Description in English:
This indicator is designed to identify market trends using a moving average and displays arrows after three consecutive closes above or below the moving average. It helps traders visualize confirmed trends and make informed decisions.
Detailed Explanation:
Configuration:
Length: Defines the period over which the moving average is calculated. The default value is 14.
MA Type: Allows choosing between a Simple Moving Average (SMA) and an Exponential Moving Average (EMA).
Uptrend Color: Sets the color of the arrows indicating an uptrend. The default color is green.
Downtrend Color: Sets the color of the arrows indicating a downtrend. The default color is red.
Moving Average Calculation:
The moving average (MA) is calculated based on the selected type (SMA or EMA) and period. The SMA is the simple arithmetic mean of the closing prices over the specified period, while the EMA gives more weight to recent prices.
Trend Identification:
The script detects when the price crosses above (crossover) or below (crossunder) the moving average.
When a crossover occurs (price moves above the MA), it indicates a potential uptrend, and the trend variable is set to 1.
When a crossunder occurs (price moves below the MA), it indicates a potential downtrend, and the trend variable is set to -1.
The script tracks the closing price at the crossover or crossunder point using the trendPrice variable.
It also counts consecutive bars above or below the moving average to confirm the trend, using above_count for uptrend and below_count for downtrend.
Arrow Display:
The script displays an up arrow ("▲") after three consecutive closes above the moving average, indicating a confirmed uptrend.
Similarly, it displays a down arrow ("▼") after three consecutive closes below the moving average, indicating a confirmed downtrend.
The arrows are displayed at the trendPrice level to clearly indicate the point at which the trend was confirmed.
Indicator Benefits:
Trend Identification: Helps traders identify market trends using moving averages, which are widely used in technical analysis.
Visual Cues: The arrows provide clear visual signals for confirmed trends, making it easier for traders to make informed decisions.
New Features and Enhancements:
This script has been enhanced to provide more accurate trend identification by ensuring arrows are only displayed after three consecutive closes above or below the moving average.
The color customization options for uptrend and downtrend arrows have been added for better visualization.
Improved description and explanations to make the functionality and usage of the indicator clearer.

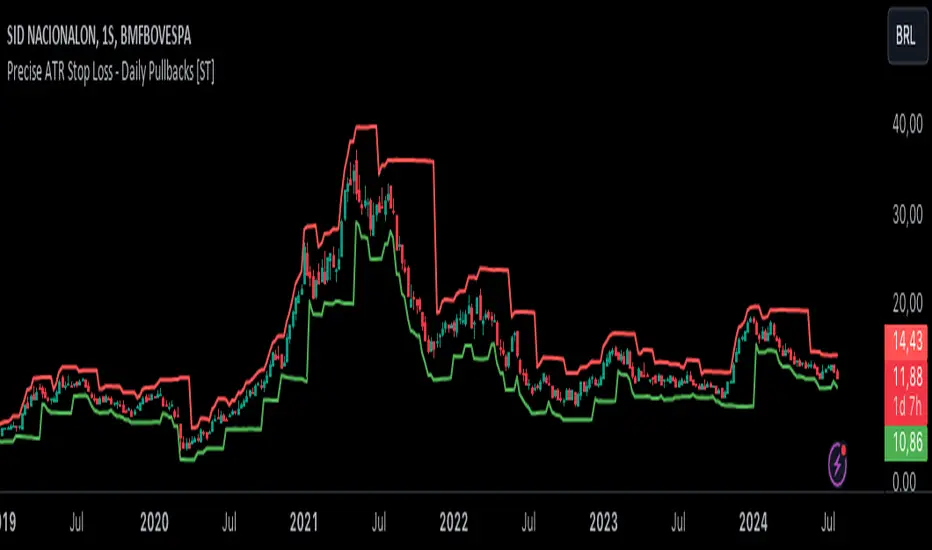
Precise ATR Stop Loss - Daily Pullbacks [ST]Precise ATR Stop Loss - Daily Pullbacks
This indicator uses ATR (Average True Range) combined with the identification of pullback lows and highs on daily charts to calculate more precise stop loss levels.
How it works:
Identification of Pullbacks:
Pullback Lows: Identifies significant low points on daily charts that can serve as support.
Pullback Highs: Identifies significant high points on daily charts that can serve as resistance.
ATR (Average True Range):
Measures market volatility and is used to adjust stop loss levels according to market conditions.
Dynamic Stop Loss:
Stop Loss for Uptrend:
When a pullback low is identified on a daily chart, the stop loss is set slightly below this point, adjusted by the ATR.
This level is shown by a green line on the chart.
Stop Loss for Downtrend:
When a pullback high is identified on a daily chart, the stop loss is set slightly above this point, adjusted by the ATR.
This level is shown by a red line on the chart.
Indicator Benefits:
Improved Precision: Uses significant pullback points on daily charts to set stops more accurately.
Dynamic Stop Loss:
Automatically adjusts stop loss levels according to market volatility, providing more effective risk management.
Título: Precise ATR Stop Loss - Daily Pullbacks
Descrição em Português:
Este indicador utiliza o ATR (Average True Range) combinado com a identificação de fundos e topos de pullback em gráficos diários para calcular níveis de stop loss mais precisos.
Como funciona:
Identificação de Pullbacks:
Fundos de Pullback: Identifica pontos de mínima significativos em gráficos diários que podem servir como suporte.
Topos de Pullback: Identifica pontos de máxima significativos em gráficos diários que podem servir como resistência.
ATR (Average True Range):
Mede a volatilidade do mercado e é utilizado para ajustar os níveis de stop loss de acordo com as condições do mercado.
Stop Loss Dinâmico:
Stop Loss para Tendência de Alta: Quando um fundo de pullback é identificado em um gráfico diário, o stop loss é colocado um pouco abaixo desse ponto, ajustado pelo ATR. Este nível é mostrado por uma linha verde no gráfico.
Stop Loss para Tendência de Baixa: Quando um topo de pullback é identificado em um gráfico diário, o stop loss é colocado um pouco acima desse ponto, ajustado pelo ATR. Este nível é mostrado por uma linha vermelha no gráfico.
Benefícios do Indicador:
Precisão Melhorada: Utiliza pontos de pullback significativos em gráficos diários para posicionar stops de forma mais precisa.
Stop Loss Dinâmico: Ajusta automaticamente os níveis de stop loss de acordo com a volatilidade do mercado, proporcionando uma gestão de risco mais eficaz.
GM-8 and ADX Strategy with Second EMADescription:
This TradingView script implements a trading strategy based on the Moving Average (GM-8), the Average Directional Index (ADX), and the second Exponential Moving Average (EMA). The strategy utilizes these indicators to identify potential buy and sell signals on the chart.
Indicators:
GM-8 (Moving Average 8): This indicator calculates the average price of the last 8 periods and is used to identify trends.
ADX (Average Directional Index): The ADX measures the strength of a trend and is used to determine whether the market is moving in a particular direction or not.
Second EMA (Exponential Moving Average): This is an additional EMA line with a period of 59, which is used to provide additional confirmation signals for the trend.
Trading Conditions:
Buy Condition: A buy signal is generated when the closing price is above the GM-8 and the second EMA, and the ADX value is above the specified threshold.
Sell Condition: A sell signal is generated when the closing price is below the GM-8 and the second EMA, and the ADX value is above the specified threshold.
Trading Logic:
If a buy condition is met, a long position is opened with a user-defined lot size.
If a sell condition is met, a short position is opened with the same user-defined lot size.
Positions are closed when the opposite conditions are met.
User Parameters:
Users can adjust the periods for the GM-8, the second EMA, and the ADX, as well as the threshold for the ADX and the lot size according to their preferences.
Note:
This script has been developed for use on a $100,000 account with FTMO, therefore the account size is set to $100,000. Please ensure that the strategy parameters and settings meet the requirements of your trading strategy and carefully review the results before committing real capital.
--------------------------------------------------------------------------------------------------------------
Beschreibung:
Dieses TradingView-Skript implementiert eine Handelsstrategie, die auf dem gleitenden Mittelwert (GM-8), dem Average Directional Index (ADX) und der zweiten exponentiellen gleitenden Durchschnittslinie (EMA) basiert. Die Strategie verwendet diese Indikatoren, um potenzielle Kauf- und Verkaufssignale auf dem Chart zu identifizieren.
Indikatoren:
GM-8 (Gleitender Mittelwert 8): Dieser Indikator berechnet den Durchschnittspreis der letzten 8 Perioden und wird verwendet, um Trends zu identifizieren.
ADX (Average Directional Index): Der ADX misst die Stärke eines Trends und wird verwendet, um festzustellen, ob sich der Markt in eine bestimmte Richtung bewegt oder nicht.
Zweite EMA (Exponential Moving Average): Dies ist eine zusätzliche EMA-Linie mit einer Periode von 59, die verwendet wird, um zusätzliche Bestätigungssignale für den Trend zu liefern.
Handelsbedingungen:
Kaufbedingung: Es wird ein Kaufsignal generiert, wenn der Schlusskurs über dem GM-8 und der zweiten EMA liegt und der ADX-Wert über dem angegebenen Schwellenwert liegt.
Verkaufsbedingung: Es wird ein Verkaufssignal generiert, wenn der Schlusskurs unter dem GM-8 und der zweiten EMA liegt und der ADX-Wert über dem angegebenen Schwellenwert liegt.
Handelslogik:
Wenn eine Kaufbedingung erfüllt ist, wird eine Long-Position mit einer benutzerdefinierten Losgröße eröffnet.
Wenn eine Verkaufsbedingung erfüllt ist, wird eine Short-Position mit derselben benutzerdefinierten Losgröße eröffnet.
Positionen werden geschlossen, wenn die Gegenbedingungen erfüllt sind.
Benutzerparameter:
Benutzer können die Perioden für den GM-8, die zweite EMA und den ADX sowie den Schwellenwert für den ADX und die Losgröße nach ihren eigenen Präferenzen anpassen.
Hinweis:
Dieses Skript wurde für die Verwendung auf einem $100.000-Konto bei FTMO entwickelt, daher ist die Kontogröße auf $100.000 festgelegt. Bitte stellen Sie sicher, dass die Strategieparameter und -einstellungen den Anforderungen Ihrer Handelsstrategie entsprechen und dass Sie die Ergebnisse sorgfältig überprüfen, bevor Sie echtes Kapital einsetzen.

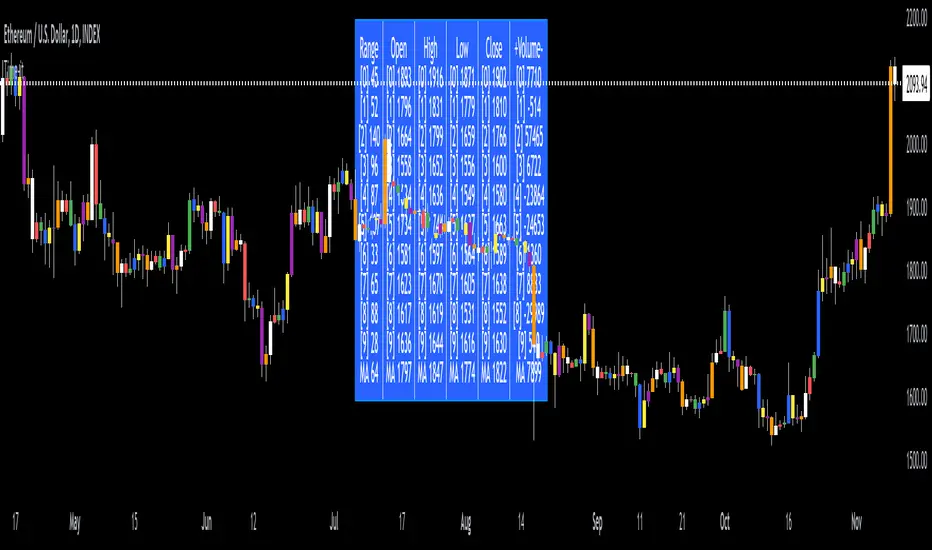
Time-itTime-it = Time based indicator
The Time-it indicator parses data by the day of week. Every tradeable instrument has its own personality. Some are more volatile on Mondays, and some are more bullish / bearish on Fridays or any day in between. The key metrics Time-it parses is range, open, high, low, close and +volume-.
The Time-it parsed data is printed in a table format. The table, position, size & color and text color & size can be changed to your preference. Each column parsed data is the last 10 which is numbered 0-9 which refers to the number of the selected day bars ago. For example: if Monday is chosen, 0 is the last closed Monday bar and 9 is the last closed Monday 9 Monday bars ago.
Range = measures the range between high and low for the day.
Open = is the opening price for the day.
High = is the high price for the day.
Low = is the low price for the day.
Close = is the closing price for the day.
+volume- = is the positive or negative volume for the day.
Default settings:
*Represents a how to use tooltip*
Source = ohlc4
* The source used for MA
MA length = 20
* The moving average used
Day bar color on / off
* checked on / unchecked off
Monday = blue
Tuesday = yellow
Wednesday = purple
Thursday = orange
Friday = white
Saturday = red
Sunday = green
Day M, T, W, TH, F, ST, SN.
* Parsed data for the day of week tables
Table, position, size & color:
Top, middle, bottom, left, center, right
* Table position on the chart.
Frame width & border width = 1
Text color and text size
Border color and frame color
Decimal place = 0
* example: use 0 for a round number, use 4 for Forex
*** The Time-it indicator uses parts and/or pieces of code from "Tradingview Up/Down Volume" and "Tradingview Financials on Chart".
Supertrend x4 w/ Cloud FillSuperTrend is one of the most common ATR based trailing stop indicators.
The average true range (ATR) plays an important role in 'Supertrend' as the indicator uses ATR to calculate its value. The ATR indicator signals the degree of price volatility. In this version you can change the ATR calculation method from the settings. Default method is RMA, when the alternative method is SMA.
The indicator is easy to use and gives an accurate reading about an ongoing trend. It is constructed with two parameters, namely period and multiplier.
The implementation of 4 supertrends and cloud fills allows for a better overall picture of the higher and lower timeframe trend one is trading a particular security in.
The default values used while constructing a supertrend indicator is 10 for average true range or trading period.
The key aspect what differentiates this indicator is the Multiplier. The multiplier is based on how much bigger of a range you want to capture. In our case by default, it starts with 2.636 and 3.336 for Set 1 & Set 2 respectively giving a narrow band range or Short Term (ST) timeframe visual. On the other hand, the multipliers for Set 3 & Set 4 goes up to 9.736 and 8.536 for the multiplier respectively giving a large band range or Long Term (LT) timeframe visual.
A ‘Supertrend’ indicator can be used on equities, futures or forex, or even crypto markets and also on minutes, hourly, daily, and weekly charts as well, but generally, it fails in a sideways-moving market. That's why with this implementation it enables one to stay out of the market if they choose to do so when the market is ranging.
This Supertrend indicator is modelled around trends and areas of interest versus buy and sell signals. Therefore, to better understand this indicator, one must calibrate it to one's need first, which means day trader (shorter timeframe) vs swing trader (longer time frame), and then understand how it can be utilized to improve your entries, exits, risk and position sizing.
Example:
In this chart shown above using SPX500:OANDA, 15R Time Frame, we can see that there is at any give time 1 to 4 clouds/bands of Supertrends. These four are called Set 1, Set 2, Set 3 and Set 4 in the indicator. Set's 1 & 2 are considered short term, whereas Set's 3 & 4 are considered long term. The term short and long are subjective based on one's trading style. For instance, if a person is a 1min chart trader, which would be short term, to get an idea of the trend you would have to look at a longer time frame like a 5min for instance. Similarly, in this cases the timeframes = Multiplier value that you set.
Optional Ideas:
+ Apply some basic EMA/SMA indicator script of your choice for easier understanding of the trend or to allow smooth transition to using this indicator.
+ Split the chart into two vertical layouts and applying this same script coupled with xdecow's 2 WWV candle painting script on both the layouts. Now you can use the left side of the chart to show all bearish move candles only (make the bullish candles transparent) and do the opposite for the right side of the chart. This way you enhance focus to just stick to one side at a given time.
Credits:
This indicator is a derivative of the fine work done originally by KivancOzbilgic
Here is the source to his original indicator: ).
Disclaimer:
This indicator and tip is for educational and entertainment purposes only. This not does constitute to financial advice of any sort.

AI SuperTrend - Strategy [presentTrading]
█ Introduction and How it is Different
The AI Supertrend Strategy is a unique hybrid approach that employs both traditional technical indicators and machine learning techniques. Unlike standard strategies that rely solely on traditional indicators or mathematical models, this strategy integrates the power of k-Nearest Neighbors (KNN), a machine learning algorithm, with the tried-and-true SuperTrend indicator. This blend aims to provide traders with more accurate, responsive, and context-aware trading signals.
*The KNN part is mainly referred from @Zeiierman.
BTCUSD 8hr performance
ETHUSD 8hr performance
█ Strategy, How it Works: Detailed Explanation
SuperTrend Calculation
Volume-Weighted Moving Average (VWMA): A VWMA of the close price is calculated based on the user-defined length (len). This serves as the central line around which the upper and lower bands are calculated.
Average True Range (ATR): ATR is calculated over a period defined by len. It measures the market's volatility.
Upper and Lower Bands: The upper band is calculated as VWMA + (factor * ATR) and the lower band as VWMA - (factor * ATR). The factor is a user-defined multiplier that decides how wide the bands should be.
KNN Algorithm
Data Collection: An array (data) is populated with recent n SuperTrend values. Corresponding labels (labels) are determined by whether the weighted moving average price (price) is greater than the weighted moving average of the SuperTrend (sT).
Distance Calculation: The absolute distance between each data point and the current SuperTrend value is calculated.
Sorting & Weighting: The distances are sorted in ascending order, and the closest k points are selected. Each point is weighted by the inverse of its distance to the current point.
Classification: A weighted sum of the labels of the k closest points is calculated. If the sum is closer to 1, the trend is predicted as bullish; if closer to 0, bearish.
Signal Generation
Start of Trend: A new bullish trend (Start_TrendUp) is considered to have started if the current trend color is bullish and the previous was not bullish. Similarly for bearish trends (Start_TrendDn).
Trend Continuation: A bullish trend (TrendUp) is considered to be continuing if the direction is negative and the KNN prediction is 1. Similarly for bearish trends (TrendDn).
Trading Logic
Long Condition: If Start_TrendUp or TrendUp is true, a long position is entered.
Short Condition: If Start_TrendDn or TrendDn is true, a short position is entered.
Exit Condition: Dynamic trailing stops are used for exits. If the trend does not continue as indicated by the KNN prediction and SuperTrend direction, an exit signal is generated.
The synergy between SuperTrend and KNN aims to filter out noise and produce more reliable trading signals. While SuperTrend provides a broad sense of the market direction, KNN refines this by predicting short-term price movements, leading to a more nuanced trading strategy.
Local picture
█ Trade Direction
The strategy allows traders to choose between taking only long positions, only short positions, or both. This is particularly useful for adapting to different market conditions.
█ Usage
ToolTips: Explains what each parameter does and how to adjust them.
Inputs: Customize values like the number of neighbors in KNN, ATR multiplier, and moving average type.
Plotting: Visual cues on the chart to indicate bullish or bearish trends.
Order Execution: Based on the generated signals, the strategy will execute buy/sell orders.
█ Default Settings
The default settings are selected to provide a balanced approach, but they can be modified for different trading styles and asset classes.
Initial Capital: $10,000
Default Quantity Type: 10% of equity
Commission: 0.1%
Slippage: 1
Currency: USD
By combining both machine learning and traditional technical analysis, this strategy offers a sophisticated and adaptive trading solution.

Divergence for Many [Dimkud - v5]Strategy is based on "Divergence for Many Indicators v4 ST" strategy by CannyTolany01
which is based on "Divergence for Many Indicator" indicator by LonesomeTheBlue
This strategy is searching for divergences on 18 indicators which you can select and optimise one by one.
Additionally you can connect any other External Indicator value. (just add this indicator the the chart and select option in settings)
To the original indicator/strategy I have added 9 additional indicators:
( Money Flow Index, Williams_Vix, Stochastic RSI , SMI Ergodic Oscillator, Volume Weighted MACD , Bull Bear Power, Balance of Power , Relative Volatility Index , Logistic Settings).
Converted strategy to v5 of Pine Script.
Added Static SL/TP in percents (%).
Added filters to filter enters:
1. Volume Weighted MACD - Multi-TimeFrame Filter
(It checks for histogram to falling or rising for a set periods of bars)
2. Money Flow Index - Multi-TimeFrame Filter
(It checks if MFI Oscillator is in the set diapason.
Also It checks if MFI is falling or rising for a set periods of bars )
3. ATR filter
(check changes in fast ATR to slow ATR )
Strategy shows good backtest results on many crypto tokens on 45m - 1h periods. (with parameters optimisation for every indicator)
To find best parameters - you can enable indicators one-by one, and optimise best parameters for each of them.
Then enable all indicators with successful results.
Optimise SL/TP.
Then try to enable and optimise filters (channels etc.)
The better is to optimise parameters separately for Short and Long trading. And run two separate bots (in settings enable only Long or only Short.)
Updates:
- Added visualisation for open trades (SL/TP)
- Added Volatility filter by ATR with many options for tests.
- Fixed some small bugs.
- Added second RSI filter (you can use two RSIs with different TF or settings)
- Updated ATR volatility and MFI filter. Removed non-effective options
- Added CCI filter
- Added option to Enable/Disable visualisation of TP/SL on chart
- Fixed one small quick bug. ("ATR filter short" was not working)
- Added Super Trend filter
- Added Momentum filter
- Added Volume Filter
- All "request.security" MultiTimeFrame calls changed to 100% non-repait function "f_security()"

VF-ST-EMA-CPRVolatility and Fibonacci table helps to identify support and resistance for the day/week. Similarly, the CPR (Central Pivot Range) table helps to identify the support and resistance for the day/week. Additionally use SUpertrend and EMA to identify trends.
Disclaimer:
This indicator is for educational or study purposes. There is no recommendation to buy or sell any scrip here. Take your own risks and rewards and you are only
responsible for any outcome after using this indicator.

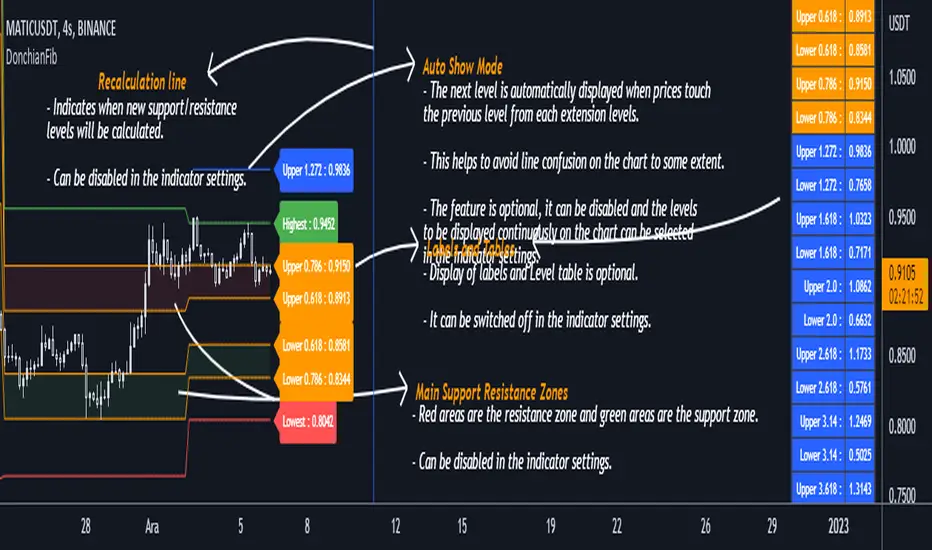
DonchianFib[Akcay]How does it work?
- The indicator detects the highest and lowest price level in the last x periods every time prices advance by x periods.
- From these values, retracement (0.618, 0.786) and expansion levels (1.272, 1.618, 2, 2.618, 3.14, 3.618, 4.236) are obtained.
- Since the symmetrical counterpart of the retracement levels is used, there are two of each of the 0.618 and 0.786 lines, for a total of four.
How can it be used?
- It can be used for step buying.
- It can be used for step selling.
- Can be used to set a profit target.
- Can be used to set a stop target.
- This indicator can be used in the same way as Pivot levels can be used. You can think of this indicator like the Pivot Points Standard indicator, where you set the period more flexibly.
Which indicators can it be combined with?
- I don't think there are any limitations, but I think it is compatible with trend detection indicators, trend detection with DonchianFib, and stepped buy/sell with limit orders.
- If you want to enter a position with mismatch signals, you can wait for the DonchianFib levels to break.
- Its use is limited by your imagination :)
Where does the name come from?
- As the name suggests, Donchian Channels. I was inspired by Donchian Channels when developing the indicator. Donchian channels show the highs and lows of prices over the last x number of periods. DonchianFib does this once for every x periods and uses the fibonacci levels to create upper and intermediate levels.
Note : I don't know if such an indicator has been done before or not. If it has been done, I haven't seen it in tradingview.
Çalışma mantığı nedir ?
- Gösterge, fiyatlar her x periyot kadar ilerlediğinde son x periyot içerisindeki en yüksek ve en düşük fiyat seviyesini tespit eder.
- Bu değerler üzerinden geri çekilme (0.618, 0.786) ve genişleme seviyeleri (1.272, 1.618, 2, 2.618, 3.14, 3.618, 4.236) elde edilir.
- Geri çekilme seviyelerinin simetrik karşılığı kullanıldığından 0.618 ve 0.786 çizgilerinden her birinden iki adet olmak üzere toplamda dört adet bulunur.
Nasıl kullanılabilir ?
- Kademeli alım yapmak için kullanılabilir.
- Kademeli satım yapmak için kullanılabilir.
- Kâr hedefi belirlemek için kullanılabilir.
- Stop hedefi belirlemek için kullanılabilir.
- Pivot seviyelerinden nasıl faydalanılıyorsa bu göstergeden de aynı şekilde faydalanılabilir. Bu göstergeyi, periyodunu kendinizin daha esnek bir şekilde belirlediğiniz Pivot Noktalar Standartı göstergesi gibi düşünebilirsiniz.
Hangi göstergelerle kombine edilebilir ?
- Bunun için herhangi sınırlama yapmak doğru değil ancak trend tespit etmeye çalışan göstergelerle uyumlu olduğunu düşünüyorum. Bu göstergeler ile trend tespiti yapıp DonchianFib ile alım/satım yerleri belirlenebilir ve limit emirleri ile kademeli alım/satım yapılabilir.
- Uyuşmazlık sinyalleri ile pozisyona girilmek isteniliyorsa DonchianFib seviyelerinin kırılması beklenebilir.
- Kullanımı sizin hayal gücünüz ile sınırlıdır :)
Adı nereden geliyor ?
- Adından da anlaşılacağı üzere Donchian Kanallarından. Göstergeyi geliştirirken Donchian Kanallarından ilham aldım. Donchian kanalları fiyatların son x periyot içerisindeki en yüksek ve en düşük seviyelerini grafikte gösteriyor. DonchianFib ise bunu her x periyot için bir defa yapıp, fibonacci seviyelerini de kullanarak üst ve ara seviyeler oluşturuyor.
Not : Daha önce böyle bir göstergenin yapılıp yapılmadığını bilmiyorum. Yapıldı ise ben tradingview'da görmedim.

American Approximation Bjerksund & Stensland 2002 [Loxx]American Approximation Bjerksund & Stensland 2002 is an American Options pricing model. This indicator also includes numerical greeks. You can compare the output of the American Approximation to the Black-Scholes-Merton value on the output of the options panel.
The Bjerksund & Stensland (2002) Approximation
The Bjerksund and Stensland (2002) approximation divides the time to maturity into two parts, each with a separate flat exercise boundary. It is thus a straightforward generalization of the Bjerksund-Stensland 1993 algorithm. The method is fast and efficient and should be more accurate than the Barone-Adesi and Whaley (1987) and the Bjerksund and Stensland (1993b) approximations. The algorithm requires an accurate cumulative bivariate normal approximation. Several approximations that are described in the literature are not sufficiently accurate, but the Genze algorithm works.
C = alpha2*S^B - alpha2*phi(S, t1, B, I2, I2)
+ phi(S, t1, I2, I2) - phi(S, t1, I, I1, I2)
- X*phi(S, t1, 0, I2, I2) + X*phi(S, t1, 0, I1, I2)
+ alpha1*phi(X, t1, B, I1, I2) - alpha1*psi*St, T, B, I1, I2, I1, t1)
+ psi(S, T, 1, I1, I2, I1, t1) - psi(S, T, 1, X, I2, I1, t1)
- X*psi(S, T, 0, I1, I2, I1, t1) + psi(S, T, 0 ,X, I2, I1, t1)
where
alpha1 = (I1 - X)*I1^-B
alpha2 = (I2 - X)*I2^-B
B = (1/2 - b/v^2) + ((b/v^2 - 1/2)^2 + 2*(r/v^2))^0.5
The function psi(S, T, y, H, I) is given by
psi(S, T, gamma, H, I) = e^lambda * S^gamma * (N(-d) - (I/S)^k * N(-d2))
d = (log(S/H) + (b + (gamma - 1/2) * v^2) * T) / (v * T^0.5)
d2 = (log(I^2/(S*H)) + (b + (gamma - 1/2) * v^2) * T) / (v * T^0.5)
lambda = -r + gamma * b + 1/2 * gamma * (gamma - 1) * v^2
k = 2*b/v^2 + (2 * gamma - 1)
and the trigger price I is defined as
I1 = B0 + (B(+infi) - B0) * (1 - e^h1)
I2 = B0 + (B(+infi) - B0) * (1 - e^h2)
h1 = -(b*t1 + 2*v*t1^0.5) * (X^2 / ((B(+infi) - B0))*B0)
h2 = -(b*T + 2*v*T^0.5) * (X^2 / ((B(+infi) - B0))*B0)
t1 = 1/2 * (5^0.5 - 1) * T
B(+infi) = (B / (B - 1)) * X
B0 = max(X, (r / (r - b)) * X)
Moreover, the function psi(S, T, gamma, H, I2, I1, t1) is given by
psi(S, T, gamma, H, I2, I1, t1, r, b, v) = e^(lambda * T) * S^gamma * (M(-e1, -f1, rho) - (I2/S)^k * M(-e2, -f2, rho)
- (I1/S)^k * M(-e3, -f3, -rho) + (I1/I2)^k * M(-e4, -f4, -rho))
where (see screenshot for e and f values)
b=r options on non-dividend paying stock
b=r-q options on stock or index paying a dividend yield of q
b=0 options on futures
b=r-rf currency options (where rf is the rate in the second currency)
Inputs
S = Stock price.
K = Strike price of option.
T = Time to expiration in years.
r = Risk-free rate
c = Cost of Carry
V = Variance of the underlying asset price
cnd1(x) = Cumulative Normal Distribution
cbnd3(x) = Cumulative Bivariate Normal Distribution
nd(x) = Standard Normal Density Function
convertingToCCRate(r, cmp ) = Rate compounder
Numerical Greeks or Greeks by Finite Difference
Analytical Greeks are the standard approach to estimating Delta, Gamma etc... That is what we typically use when we can derive from closed form solutions. Normally, these are well-defined and available in text books. Previously, we relied on closed form solutions for the call or put formulae differentiated with respect to the Black Scholes parameters. When Greeks formulae are difficult to develop or tease out, we can alternatively employ numerical Greeks - sometimes referred to finite difference approximations. A key advantage of numerical Greeks relates to their estimation independent of deriving mathematical Greeks. This could be important when we examine American options where there may not technically exist an exact closed form solution that is straightforward to work with. (via VinegarHill FinanceLabs)
Things to know
Only works on the daily timeframe and for the current source price.
You can adjust the text size to fit the screen

Trend SuggestionsThis brings together a number of variables to produce trend predictions that could be utilized as decision-making tools.
Uses the aforementioned price and volume derivatives
- A moving average and three weighted moving averages (WMA1, WMA2, WMA3)
- Super Trend Line (ST)
- Opening Range Breakout on Five Minutes, Resistance Bands Pocket pivots, support, and price volume
he Direction is determined by the High and Low Bands of WMAs and the Supertrend Line, which are used to determine the Upper and Lower Lines around the Price. When the price passes below the lower boundary of the band, a downtrend is said to have begun.
Similarly, for an uptrend, this continues until the price passes over the upper edge of the band. Teal for an uptrend and fuchsia for a downturn area shared by the band to identify the trend.
The first five minutes of the breakout lines have a tiny buffer augmentation of 11% applied to them.
Based on what has been observed, support and resistance zones have been somewhat changed from the figures that are often utilized (might work other markets as well)
The markings that may be seen are as follows:
- Blue Triangle indicates a pocket pivot with an upward bias;
- Maroon Triangle indicates a pocket pivot with a downward bias;
- Teal colored Diamonds indicate price upthrusts and potential trend confirmation locations, depending on success or failure.
- Similar backdrop color changes that look as vertical shading are also used to identify them.
- Fuchsia-colored diamonds indicate price declines and a potential trend, depending on whether it persists or fails.
- Dark green and maroon square boxes indicate potential price reversals in the support and resistance bands, respectively.
It goes without saying that this work is derived from numerous other open-source community initiatives.
Feel free to adjust anything you'd like, and we appreciate any feedback.

FDI-Adaptive Supertrend w/ Floating Levels [Loxx]FDI-Adaptive Supertrend w/ Floating Levels is a Fractal Dimension Index adaptive Supertrend indicator. This allows Supertrend to better adaptive to volatility of the market. This also includes floating levels that act as support and resistance, stop loss or take profit, or indication of market reversal. Additional signal types will be added in the future based on these floating levels.
What is the Fractal Dimension Index?
The goal of the fractal dimension index is to determine whether the market is trending or in a trading range. It does not measure the direction of the trend. A value less than 1.5 indicates that the price series is persistent or that the market is trending. Lower values of the FDI indicate a stronger trend. A value greater than 1.5 indicates that the market is in a trading range and is acting in a more random fashion.
What is the Supertrend?
Supertrend indicator was created by Olivier Seban to work on different time frames. It works for futures , forex, and equities. It is used in 15 minutes, hourly, weekly, and daily charts . Based on the parameters of multiplier and period, the indicator normally uses 3 for multiplier and 7 for the ATR period as default values. Average True Range is represented by the number of days while the multiplier is the value by which the range is multiplied.
Included:
Bar coloring
Alerts
Signals

Hitokiri rsi and bbNG : This indicator is created by combining the standard period RSI indicator with an Oversold limit of 32, an Overbought limit of 70 and a period of 14 (these values can be changed optionally from the entries and still tabs of the indicator settings) and the Bollinger Band . indicator with a standard deviation of 2 and a period of 20. Also, the RSI Oversold is an upward green triangle where the price simultaneously falls below the BB and the lower limit (Low) (i.e. below 32), where the RSI Overbought (i.e. above 70) at the same time the price rises above the BB and the upper limit (Upper) is a downward red triangle. is indicated by a triangle. An alarm condition is established on these conditions. Source codes are posted visually and written in clear language and with explanations for beginners to learn to pine.
TR : Bu gösterge OverSold sınırı 32, OverBought sınırı 70 ve periodu 14 olan (bu değerler tercihe göre indikatör ayarlarının girdiler ve still sekmelerinden değiştirilebilir) standart periodluk RSI göstergesi ile standart sapma değeri 2, periodu 20 olan Bollinger Bandı göstergesinin birleştirilmesiyle oluşturulmuş olup ilaveten RSI'nin OverSold iken (yani 32 altına düştüğü) aynı anda fiyatın BBand alt sınırı (Lower) altına düştüğü yerleri yukarı yönlü yeşil üçgenle, RSI'nin OverBought iken (yani 70 üstüne çıktığı) aynı anda fiyatın BBand üst sınırı (Upper) üstüne çıktığı yerleri aşağı yönlü kırmızı üçgenle belirtmektedir. Bu şartlar üzerine de alarm kondüsyonu oluşturulmuştur. Kaynak kodları görünür olarak yayınlanmış olup, pine öğrenmeye yeni başlayanlar için anlaşılır dilde ve açıklamalar eklenerek yazılmıştır.
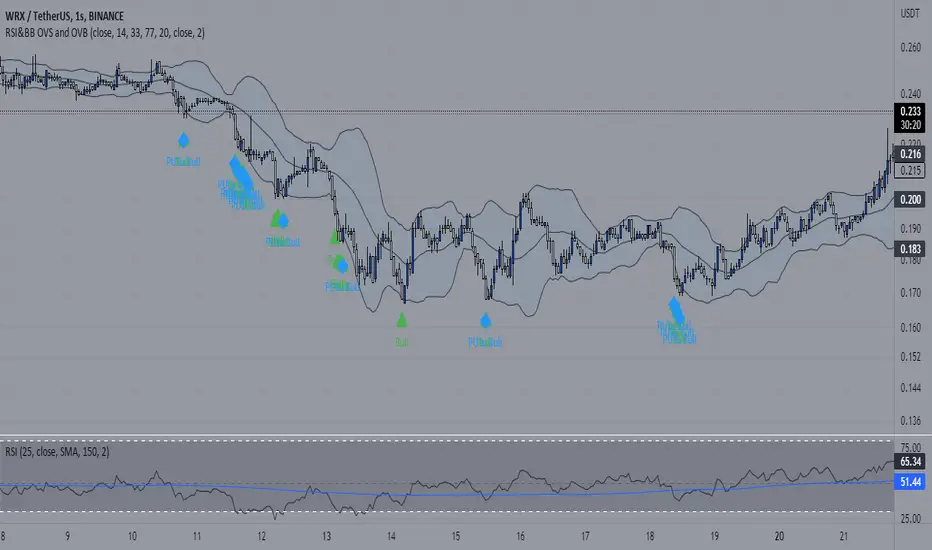
Adaptive Supertrend w/ Floating Levels [Loxx]Adaptive Supertrend w/ Floating Levels is a Supertrend indicator made adaptive by comparing the coefficient of determination / average of the least squares. The basic concept is this: use correlation with an r-squared line to adapt the period of the indicator, thereby resulting in a more versatile Supertrend. This adaptive formula makes the Supertrend more reactive to small fluctuation in the market while still doing what it's supposed to do: track trend. In addition, floating levels are drawn above or below the Supertrend which are calculated with percentage of the highest and lowest values of the Supertrend within the last “lookback” period. These floating levels act as filter to detect / prevent false trend reversals. T
What is the Supertrend?
Supertrend indicator was created by Olivier Seban to work on different time frames. It works for futures, forex, and equities. It is used in 15 minutes, hourly, weekly, and daily charts. Based on the parameters of multiplier and period, the indicator normally uses 3 for multiplier and 7 for the ATR period as default values. Average True Range is represented by the number of days while the multiplier is the value by which the range is multiplied.
Included
-Toggle on/off bar coloring
-Toggle on/off adaptivity
-Toggle on/off fill coloring
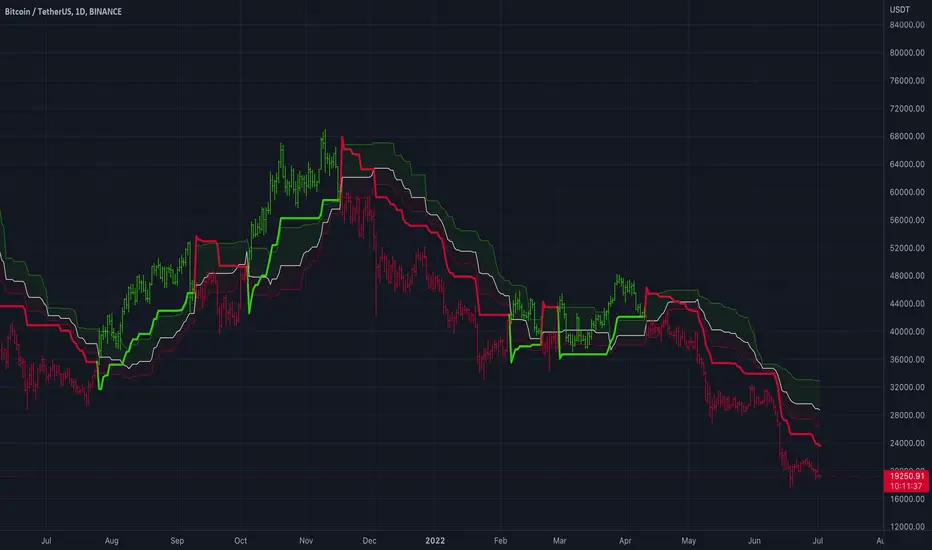
Strategy Table LibraryLibrary "table_library"
TODO: With this library, you can add tables to your strategies.
strategy_table()
Returns: Strategy Profit Table
Adds a table to the graph of the strategy for which you are calling the function. You can see data such as net profit in this table.
No parameters. Just call the function inside the strategy.
Example Code :
import only_fibonacci/table_lib/1 as st
st.strategy_table()
