ATR Drift %This script plots an histogram calculated this way:
Get the previous ATR sample, calculated in the specified timeframe
Get the actual open price of the bar in the specified timeframe minus the actual price in the current timeframe
and plots the percent change between the the 2 values
For example, if you select DAY as timeframe for the ATR:
Plots the percent change between:
- ATR(daily) from yesterday
and
- open from today - actual price
Due to Tradingview limitations, only shows the plot if the actual timeframe of the graphic is equal or lower that the ATR selected timeframe
The background changes shows a new ATR sample taking place
I'm testing this for scalping in 5M timeframe with the ATR in 4H
All my published scripts at: es.tradingview.com
在腳本中搜尋"ATR"

ATR Bands with vortex indicator [LM]Hello traders,
I would like to present you ATR Bands with vortex indicator. This indicator is different than my others I used not that known vortex indicator as a entry indicator, and atr bands I have used as a exit indicator.
You can see 2 set of bands with different multiplicator, first is used as first target profit, stop loss and second as a second target
There are to modes that takes, first is static mode that gives you lines with 1st, 2nd target profit and in red color stop loss
In the static mode you can also turn off extending line he price reach the level:
Second mode is tracking atr first band with candle offset of your choosing:
The trailing functionality is not working 100% but I as thinking to share it anyway and see maybe some feedback and meantime I will fix the trailing behavior.
Settings:
Genreal settings - basic setting of source for atr bands, line settings,
First atr bands setting
Second atr bands setting
Vortex setting
Cheers and Happy Xmas,
Lukas

ATR color zones with volume radar [LM]Hello Guys,
I would like to introduce you the ATR color zones with volume radar indicator. It's a fork of @GlobalMarketSignals "GMS: Mr. Yen's Color Zone" shout-out to him.
I have enriched it -> that zones are calculated based on the ATR and percentages as described below and volume radar on candle bars. You can select from which timeframe color zones are calculated.
Zones:
white line is the previous period close
red zone = +/- 20% ATR of previous period
yellow zone = +/- 40% ATR of previous period
green zone = +/- 60% ATR of previous period
blue zone = +/- 100% ATR of previous period
Volume radar:
lime = above volume MA average multiplied by multiplier up bar
maroon = above volume MA average multiplied by multiplier down bar
black = volume is decreasing but is not below half of volume MA
navy = volume is decreasing and is below half of volume MA
markers are shown when volume is increasing two consecutive candle in row in direction of the candle
Any suggestions are welcomed

ATR Squeeze BackgroundThis simple but powerful indicator shades the background of your chart whenever volatility contracts, based on a custom comparison of fast and slow ATR (Average True Range) periods.
By visualizing low-volatility zones, you can:
* Identify moments of compression that may precede explosive price moves
* Stay out of choppy, low-momentum periods
* Adapt this as a component in a broader volatility or breakout strategy
🔧 How It Works
* A Fast ATR (default: 7 periods) and a Slow ATR (default: 40 periods) are calculated
* When the Fast ATR is lower than the Slow ATR, the background is shaded in blue
* This shading signals a contraction in volatility — a condition often seen before breakouts or strong directional moves
⚡️ Why This Matters
Many experienced traders pay close attention to volatility cycles. This background indicator helps visualize those cycles at a glance. It's minimal, non-intrusive, and easy to combine with your existing tools.
🙏 Credits
This script borrows core logic from the excellent “Relative Volume at Time” script by TradingView. Credit is given with appreciation.
⚠️ Disclaimer
This script is for educational purposes only.
It does not constitute financial advice, and past performance is not indicative of future results. Always do your own research and test strategies before making trading decisions.

ATR Dynamic Stop (Table + Plot + ATR %)📊 This script displays dynamic stop levels based on ATR, designed for active traders.
Features:
- Shows long and short stop levels (price ± ATR × multiplier).
- Displays values as a floating table on the top-right corner.
- Optional plot lines directly on the chart.
- Option to calculate based on realtime price or last close.
- Displays the ATR value both in price units and as a percentage of the selected price.
- Fully customizable table: text size, text color, background color.
Inputs:
- ATR Multiplier and Length.
- Show/hide stop lines on the chart.
- Select price source (realtime or last close).
- Table appearance options.
Ideal for:
- Traders who want a clear visual stop guide.
- Combining volatility with risk management.

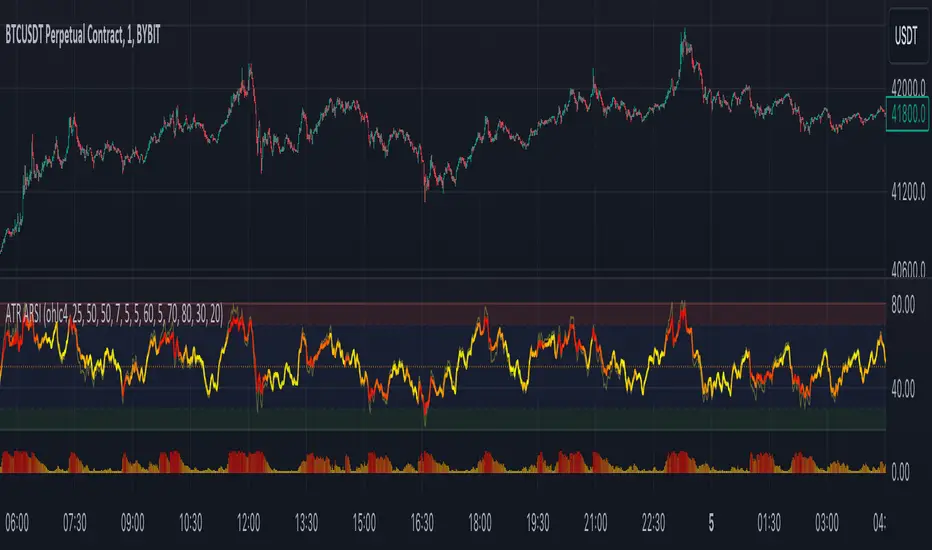
ATR Adaptive RSI OscillatorThe " ATR Adaptive RSI Oscillator " is a versatile technical analysis tool designed to help traders make informed decisions in dynamic market conditions. It combines the Relative Strength Index (RSI) with the Average True Range (ATR) to provide adaptive and responsive insights into price trends.
Key Features :
Adaptive RSI Periods : The indicator introduces the concept of adaptive RSI periods based on the ATR (Average True Range) of the market. When enabled, it dynamically adjusts the RSI calculation period, offering longer periods during high volatility and shorter periods during low volatility. This adaptability enhances the accuracy of RSI signals across varying market conditions.
Volume-Based Smoothing : The indicator includes a smoothing feature that computes a time-decayed weighted moving average of RSI values over the last two bars, using volume-based weights. This approach offers a time-sensitive smoothing effect, reducing noise for a clearer view of trend strength compared to the standard RSI.
Divergence Detection : Traders can enable divergence detection to identify potential reversal points in the market. The indicator highlights regular bullish and bearish divergences, providing valuable insights into market sentiment shifts.
Customizable Parameters : Traders have the flexibility to customize various parameters, including RSI length, adaptive mode, ATR length, and divergence settings, to tailor the indicator to their trading strategy.
Overbought and Oversold Levels : The indicator includes overbought (OB) and oversold (OS) boundary lines that can be adjusted to suit individual preferences. These levels help traders identify potential reversal zones.
The "ATR Adaptive RSI Oscillator" is a powerful tool for traders seeking to adapt their trading strategies to changing market dynamics. Whether you're a trend follower or a contrarian trader, this indicator provides valuable insights to support your decision-making process.
ATR Position Size AutomationAll you have to fill out is your account balance, the % amount of your account you want to risk, and the percentage of ATR you want calculated. If you have 100% it will do a full ATR calculation. So if the ATR is $2 then your risk per share would be $2. If you had 50% in the same example it would be risking $1 per share.
You can also customize what time frame you want the ATR to be calculating off of. Just be aware the calculation will only be right if you are showing a lower time frame on your chart then the one selected on the indicator. (If you are calculating a daily dont be on a weekly chart. You have to be on a Daily or lower)
You can select what boxes you want displayed and if you want the ATR lines on the chart.

ATR Bands with QQE [LM]Hello traders,
I would like to present you ATR Bands with QQE. This indicator is different than my other indicators I used QQE oscillator as an entry indicator, and atr bands I have used as an exit indicator.
You can see 2 set of bands with different multiplicator, first is used as first target profit, stop loss and second as a second target
There are two modes that takes, first is static mode that gives you lines with 1st, 2nd target profit and in red color stop loss.
Second mode has static first target and trailing stop loss
Settings:
Genreal settings - basic setting of source for atr bands, line settings,
First atr bands setting
Second atr bands setting
QQE settings
Cheers,
Lukas

ATR Start & Stop BotThis script is using Average True Range (ATR) and works very well on the Bitcoin 4 hour timeframe to determine when to stop and start your bots.
It has a very similar visual to the EMA RSI Indicator found here:
This 'ATR Start & Stop Bot' is better because it has less confusion during sideways market movement.
As an example - You are using 3commas and have a Composite bot setup with several alt coins, you can use this indicator with the ' Stop bot ' alert to disable your composite bot from taking trades at times when the market is on a trend that looks in the red.
Alternatively you can use the ' Start bot ' alert to turn your bot back on during the green uptrends.
Using this indicator with these alerts on the Bitcoin 4-Hour chart add a great layer of automation to your already existing bots.
Credits:
Original 'ATR Stops' indicator belong to the user failathon and that script is found here:
Also credits to Dradian for the alert additions.

ATR Pips with Stop LossThis indicator shares ATR pips and a calculated 1.5 x stop loss calculation.
1st number is ATR.
2nd number is ATR x 1.5 (a typical SL when trading daily time frame).
The plot lines are really not that important- it's the actual numbers.
What I do is uncheck the plot line checkboxes (ATR & SL) so it doesn't show up, that way I can reduce the indicator window.
This script is a modified script by ATR Pips . Kept the BB section for now as it might be useful, but doubt it.
Future updates:
- editable the multiple for SL
- static daily numbers (right now this shows the timeframe you are viewing, I'd keep that but add a static daily ATR so you have both)

ATR Volatility Spectrum
This indicator estimates price volatility and it is based on ATR only.
The advantage of this indicator is that it can be used with any pair, any time frame.
The fluctuations of a short period ATR with respect to a gently ATR with high period
are calculated.
The only parameters are the periods of the reference ATR and fast ATR, which could be
safely let untouched and modified by experts.
RED areas depict low volatility
GREEN areas depict high volatility.
When the clouds are outside the region delimited by the aqua lines we have
extreme conditions:
Extremely low volatility = red cloud outside the aqua bands
Extremely high volatility = green cloud outside the aqua bands
Vitelot/yanez/Vts December 2018.
Hitting the like button is free act of gratitude

ATR-Normalized VWMA DeviationThis indicator measures how far price deviates from the Volume-Weighted Moving Average ( VWMA ), normalized by market volatility ( ATR ). It identifies significant price reversal points by combining price structure and volatility-adjusted deviation behavior.
The core idea is to use VWMA as a dynamic trend anchor, then measure how far price travels away from it relative to recent volatility . This helps highlight when price has stretched too far and may be due for a reversal or pullback.
How it works:
VWMA deviation is calculated as the difference between price and the VWMA.
That deviation is divided by ATR (Average True Range) to normalize for current volatility.
The script tracks the highest and lowest normalized deviations over the chosen lookback period.
It also tracks price structure (highest/lowest highs/lows) over the same period.
A reversal signal is generated when a historical extreme in deviation aligns with a price structure extreme, and a confirmed reversal candle forms.
You get visual signals and color highlights where these conditions occur.
Settings explained:
Lookback period defines how many bars the script uses to find recent extremes.
ATR length controls how volatility is measured.
VWMA length controls how the volume-weighted moving average is calculated.
Signal filters help refine entries based on price vs deviation behavior.
Display options let you customize how signals and levels appear on the chart.
This indicator is especially useful for spotting potential turning points where price has moved far from VWMA relative to volatility, suggesting possible exhaustion or overextension.
Tips for use:
Combine with broader trend context (higher timeframe support/resistance).
Use with risk management rules (position sizing, stops) — signals are guides, not guaranteed entries.
Adjust lookback and ATR settings based on your trading timeframe and asset volatility.

ATR Horizontal Lines from EMA and SMA with TableHow it works:
The script calculates ATR levels (of your choosing)
Instead of plotting curves, it creates horizontal lines
The lines are deleted and recreated on each bar to show current levels
Lines extend to the right or can be limited to a certain width
Customization options:
Line width (1-10 pixels)
Individual colors for each of the 4 lines
All the original parameters (EMA/SMA lengths, ATR length, multipliers)
The horizontal lines will now show the current ATR-based support/resistance levels and move dynamically as the EMAs, SMA, and ATR values change with new price data.

ATR Enhanced [DCAUT]█ ATR Enhanced
📊 OVERVIEW
Standard ATR uses only RMA smoothing, while ATR Enhanced provides 20+ professional smoothing algorithms , offering precise volatility measurement solutions for different trading scenarios and market environments.
💡 CORE VALUE
- 20+ algorithm choices : SMA, EMA, RMA, WMA, HMA, T3, KAMA, FRAMA, Kalman Filter, etc.
📋 PARAMETER SETUP
ATR Length : Calculation period (default: 14)
Moving Average Type : Choose the most suitable smoothing method from 20+ algorithms
🎨 COLOR CODING
Green : Rising volatility
Red : Falling volatility

ATR InfoWhat Is the Average True Range (ATR)?
The average true range (ATR) is a technical analysis indicator, introduced by market technician J. Welles Wilder Jr. in his book New Concepts in Technical Trading Systems, that measures market volatility by decomposing the entire range of an asset price for that period.
Each instrument per unit of time passes its average value of the true range, but there are moments when the volatility explodes or abruptly decays, these phenomena introduce large distortions into the average value of the true range.
The ATR_WPB function calculates the average value of the true range for the specified number of bars, while excluding paranormally large and paranormally small bars from the calculation of the average.
For example, if the instrument has passed a small ATR value, then it has many chances to continue moving, but if the instrument has passed its ATR value, then the chances of continuing to move are extremely low.

ATR and IV Volatility TableThis is a volatility tool designed to get the daily bottom and top values calculated using a daily ATR and IV values.
ATR values can be calculated directly, however for IV I recommend to take the values from external sources for the asset that you want to trade.
Regarding of the usage, I always recommend to go at the end of the previous close day of the candle(with replay function) or beginning of the daily open candle and get the expected values for movements.
For example for 26April for SPX, we have an ATR of 77 points and the close of the candle was 4296.
So based on ATR for 27 April our TOP is going to be 4296 + 77 , while our BOT is going to be 4296-77
At the same time lets assume the IV for today is going to be around 25% -> this is translated to 25 / (sqrt (252)) = 1.57 aprox
So based on IV our TOP is going to be 4296 + 4296 * 0.0157 , while our BOT is going to be 4296 - 4296 * 0.0157
I found out from my calculations that 80-85% of the times these bot and top points act as an amazing support and resistence points for day trading, so I fully recommend you to start including them into your analysis.
If you have any questions let me know !

ATR Daily LevelsPlots the daily ATR on the chart as upper and lower levels.
It can be use to adapt your trading in high and low periods of market volatility, determine reasonable target or take profit, entry at likely mean reversion, stop loss beyond normal flows etc...
More on the script behavior:
- Daily ATR upper/lower levels are applied on the current day low/high;
- The ATR value is defined by the last D1 bar;
- Shows up to D1 timeframe;
- Configuration for the indicator's period (default: 20 period ATR);
- Configuration for plotting the indicator on the the x axis with an offset/at begining of the day (default: offset);

ATR 0.5 & 0.7 rangesIt good to look to ATR on intraday trading.
According to our team research only 4.8% of days security goes out of their ATR.
So we developed ATR indicator which shows Daily ATR ranges on smaller time frames.
When price crosses 70% of previous day ATR is good to look for signal to trade backward.

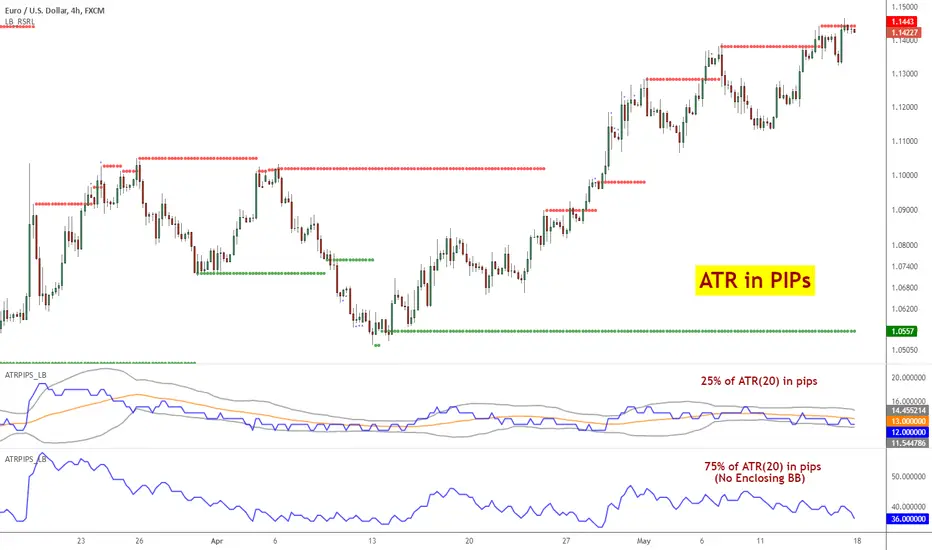
ATR Pips [LazyBear]This is ATR in pips. This was requested by user @ElixiumCapital. ATRPIPs in his words:
"ATR PIPs is useful for finding markets with your desired amount of volatility, for example I prefer to trade forex pairs with the highest amount of volatility in the past 5 days, setting the length parameter to 5 days. And setting my stop loss at 25% to 33% of the the indicators value."
I have added options to show a BB around ATR, as well as normal ATR (not in PIPs). All the parameters are configurable.
List of my public indicators: bit.ly
List of my app-store indicators: blog.tradingview.com
ATR Divergences [UAlgo]Divergence is a concept in financial markets that highlights inconsistencies between the price of an asset and a given indicator. This script focuses on identifying divergences using the Average True Range (ATR). Divergence occurs when there is a disparity between the direction of the price and the oscillator, providing valuable insights for traders anticipating potential trend reversals.
This script employs pivot points (with using High-Low values of the candles) to identify potential divergences between the oscillator (ATR) and price movements. Here's how each type of divergence is determined:
Key Features:
Regular Bullish Divergence:
Oscillator registers a higher low.
Price records a lower low.
Indicative of potential upward reversal.
Hidden Bullish Divergence:
Oscillator indicates a lower low.
Price exhibits a higher low.
Signals a concealed bullish continuation pattern.
Regular Bearish Divergence:
Oscillator shows a lower high.
Price marks a higher high.
Suggests a possible downward reversal.
Hidden Bearish Divergence:
Oscillator reflects a higher high.
Price displays a lower high.
Indicates a hidden bearish continuation pattern.
Usage and Customization:
ATR Length: Adjustable parameter for customizing the Average True Range calculation period.
Plot Options: Choose to display Regular Bullish, Hidden Bullish, Regular Bearish, and/or Hidden Bearish divergences.
Wait for Candle Close: Option to wait for candle closure before plotting signals.
How to Interpret:
Regular divergences may indicate potential trend reversals, while hidden divergences suggest a continuation of the current trend. Traders can leverage these signals to make informed decisions in their trading strategies.
Feel free to customize the parameters based on your trading preferences. Happy Trading!

ATR Extension [QuantVue]The Moving Average ATR Extension Indicator offers a powerful blend of two key market elements: the Average True Range (ATR) and Moving Averages (MA), capturing the dynamics of market momentum and trend direction.
This indicator is used to measure market extension from a user-selected moving average based on multiples of the Average True Range (ATR). By doing this, it becomes remarkably straightforward to spot strength at breakout points or exhaustion near the end of a run.
As a market breaks out the extension indicates a surge in buying pressure, while an extension after a sizeable move can often be an indication of market exhaustion. This extended position essentially reflects over-enthusiastic buying and could be an early warning sign of a potential trend reversal.
Breakout Strength:
Exhaustion:
Give this indicator a BOOST and COMMENT your thoughts!
We hope you enjoy.
Cheers.

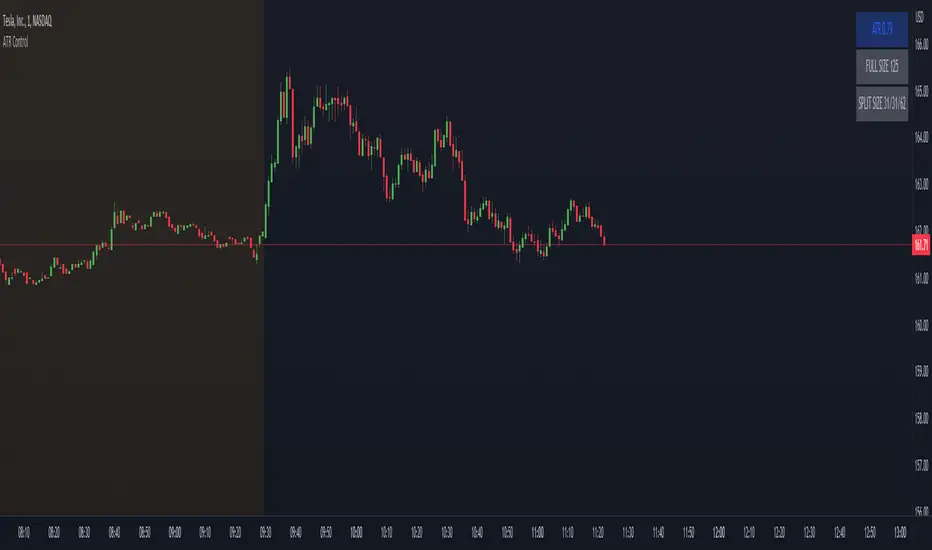
ATR ControlThis indicator shows the following values:
ATR value of the current symbol
Size of the full position based on the maximum risk set
Three sizes that are percents of the full size already present in this indicator
Customizable settings are:
Show/hide single rows
ATR Timeframe
ATR Lenght
First percent of the split to apply
Second percent of the split to apply
Maximum risk
The last percent is automatically calculated using the first two.
Example:
Full size: 500
First percent: 10
Second percent: 40
The third percent is calculated as 100 - first percent - second percent = 50
The split sizes shown are: 50/200/250
ATR & APCAverage True Range (ATR) and Average Price Change (APC). Shows the ATR and APC as well as the TR and PC for the current bar, colour coded to indicate very large/small bars. The ATR and APC are also colour coded to reflect whether they are increasing or decreasing. Style will need to be customized.
