Cumulative Delta VolumeHello Traders,
This is Cumulative Delta Volume script. Delta refers to the difference between buying and selling volume at each price level. Cumulative Delta builds upon this concept by recording a cumulative tally of these differences in buying vs selling volume. The Cumulative Delta indicator plots as candlesticks or line. One of the main uses of Cumulative Delta is to confirm or deny market trends. you may need to search it for yourself ;)
You have option to see it as Candles or a Line. also there are options to show 2 SMAs and 2 EMAs with different Lengths, you can set the lengths as you wish.
By default it shows CDV as Heikin Ashi Candles, it can also show it as normal candles:
It can show CDV as a line:
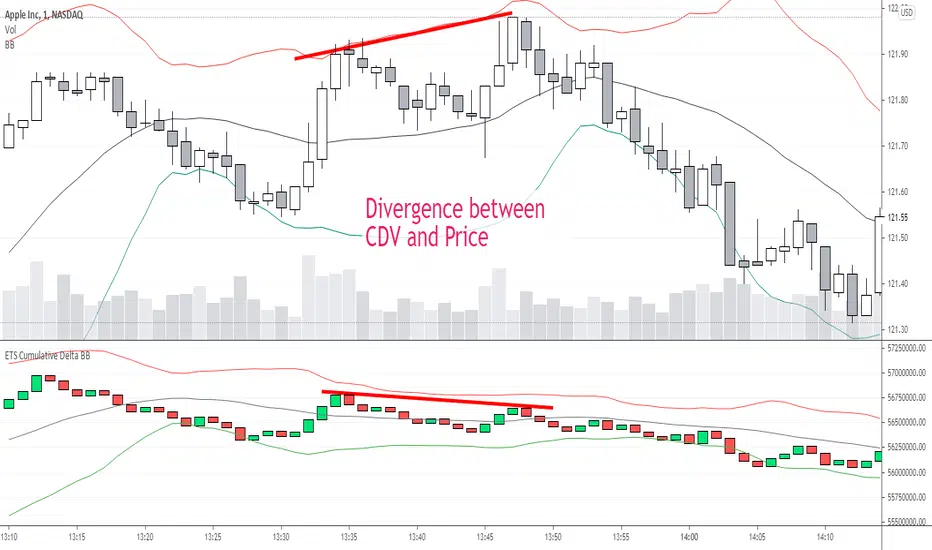
Also you may need to check divergence:
Enjoy!
在腳本中搜尋"Cumulative Delta Volume"

Cumulative Delta Volume WaveIntroducing an Enhanced Version of the CDV by LonesomeTheBlue
For the original version and description check this link:
What Makes This Version Different than the original?
This enhanced version of the CDV indicator incorporates advanced signal processing techniques to bring new depth to market analysis.
Standard Deviation Bands and EMAs: These additions to the CDV offer a visual representation of significant market movements—highlighting major pumps and dumps, as well as identifying potential support and resistance levels.
Color-Coded Insights: The standard deviation bands utilize color coding based on signal processing principles. This feature becomes increasingly useful the more you zoom out, making it easier to observe and interpret market waves.
Market Maker Activity: By examining fluctuations within the standard deviation bands, traders can gauge when Market Makers are actively maneuvering to establish their long and short positions, often at the expense of retail traders.
EMA Support and Resistance: The embedded Exponential Moving Averages (EMAs) serve as dynamic support and resistance levels. Analyzing these can help traders determine the continuing strength of a market move, whether bullish or bearish.
Visual Guide to the Basics
For a clearer understanding of what this enhanced indicator can show, please refer to the image below:
And in addition to all the above one can detect relevant W and M structures way easier with this indicator ;)

Cumulative Delta Volume RSI-8 CandlesThis script combines Cumulative delta volume information and the RSI set to an 8 period look back to show momentum in the market. It is displayed using a color overlay with 3 colors. Green candles indicate positive market momentum along with positive delta and positive price movement. Red candles indicate negative market momentum along with negative delta and negative price movement. Yellow candles indicate possible ranging conditions or the start of a pullback in either direction. There is also a moving average built into the indicator to help with trend direction.
Combined with price action strategies or even simple moving averages this indicator can be used as a powerful confirmation or confluence in any trading system. Works nicely to confirm breakout strategies as well.
Can be used on any market or time frame though for price action strategies it works best on time frames H1 and under.

CVD – Visible Range Candles & Line (Cumulative Delta Volume)Disclaimer:
This indicator is provided for informational and educational purposes only. It does not constitute investment advice, trading advice, or a recommendation to buy or sell any financial instrument. The author assumes no liability for any losses, damages, or errors arising from use or misuse of this script. Please test thoroughly and use at your own risk.
________________________________________________________________________________
Purpose
This indicator provides a fast and clear visualization of Cumulative Delta Volume (CVD) for the currently visible chart range in TradingView. It helps traders identify buy/sell volume pressure and market sentiment over any custom timeframe, with full control over reset intervals and chart style.
Key Features
CVD by Visible Bars: Dynamically calculates CVD only for bars currently visible on the chart, so scrolling and zooming always rescale the line and candles to your view.
Style Selection: Choose line or candlestick display. Candles include both standard OHLC and optional Heikin Ashi smoothing.
Automatic Resets: Restart CVD accumulation at the beginning of every day, week, month, or quarter. Choose ‘None’ for ongoing accumulation.
Fully Custom Colors: Line color, candle body, wick, border – all optimized for clarity and customizable via the indicator’s Style tab.
Autoscale Support: Always fits your timeframe. No need to adjust scale manually.
Zero-Level Reference: Includes a horizontal zero line for quick reversal detection.
Input Parameters
Style: "Line" or "Candles" – controls visual type
Heikin Ashi candles: Enable smoothing for candle view
Show Line: Toggle CVD line visibility
Reset CVD: Options: None, Daily, Weekly, Monthly, Quarterly
How To Use
Add the indicator to your TradingView chart.
Select your preferred visual style (Line or Candles).
Choose reset frequency based on your trading timeframe.
Customize colors in the Style tab (line, candle up/down, wick, border).
Scroll or zoom on the chart – the indicator’s range always fits the currently visible bars.
Typical Use Cases
Intraday traders tracking open/close session volume delta
Swing traders identifying quarterly or monthly market accumulations
Visualizing buy/sell pressure divergence at reversal points
Comparing volume sentiment across flexible chart intervals
Formula
Delta calculation: Delta=volume×(sign(close−open))
Accumulation: Resets at user-chosen intervals, CVD plotted for only visible bars
Author
Created by Ronen Cohen

Cumulative Volume Delta with EMA PlotCumulative Delta Volume is a key tool for analyzing the relationship between trading volume and price movement, often referred to as Volume Price Action.
In this indicator, an Exponential Moving Average (EMA) is applied to smooth out short-term noise and reduce volatility, making trends easier to identify. Traders can watch for EMA crossovers as confirmation signals for potential trend reversals, as well as buying or selling opportunities.
Cumulative Volume DeltaCumulative Delta Volume is one of the key analysis in figuring out the Volume Price Action dependencies
Its very Intuitive in nature,
The below image shows how it is computed!
Enjoy

ATAI Volume analysis with price action V 1.00ATAI Volume Analysis with Price Action
1. Introduction
1.1 Overview
ATAI Volume Analysis with Price Action is a composite indicator designed for TradingView. It combines per‑side volume data —that is, how much buying and selling occurs during each bar—with standard price‑structure elements such as swings, trend lines and support/resistance. By blending these elements the script aims to help a trader understand which side is in control, whether a breakout is genuine, when markets are potentially exhausted and where liquidity providers might be active.
The indicator is built around TradingView’s up/down volume feed accessed via the TradingView/ta/10 library. The following excerpt from the script illustrates how this feed is configured:
import TradingView/ta/10 as tvta
// Determine lower timeframe string based on user choice and chart resolution
string lower_tf_breakout = use_custom_tf_input ? custom_tf_input :
timeframe.isseconds ? "1S" :
timeframe.isintraday ? "1" :
timeframe.isdaily ? "5" : "60"
// Request up/down volume (both positive)
= tvta.requestUpAndDownVolume(lower_tf_breakout)
Lower‑timeframe selection. If you do not specify a custom lower timeframe, the script chooses a default based on your chart resolution: 1 second for second charts, 1 minute for intraday charts, 5 minutes for daily charts and 60 minutes for anything longer. Smaller intervals provide a more precise view of buyer and seller flow but cover fewer bars. Larger intervals cover more history at the cost of granularity.
Tick vs. time bars. Many trading platforms offer a tick / intrabar calculation mode that updates an indicator on every trade rather than only on bar close. Turning on one‑tick calculation will give the most accurate split between buy and sell volume on the current bar, but it typically reduces the amount of historical data available. For the highest fidelity in live trading you can enable this mode; for studying longer histories you might prefer to disable it. When volume data is completely unavailable (some instruments and crypto pairs), all modules that rely on it will remain silent and only the price‑structure backbone will operate.
Figure caption, Each panel shows the indicator’s info table for a different volume sampling interval. In the left chart, the parentheses “(5)” beside the buy‑volume figure denote that the script is aggregating volume over five‑minute bars; the center chart uses “(1)” for one‑minute bars; and the right chart uses “(1T)” for a one‑tick interval. These notations tell you which lower timeframe is driving the volume calculations. Shorter intervals such as 1 minute or 1 tick provide finer detail on buyer and seller flow, but they cover fewer bars; longer intervals like five‑minute bars smooth the data and give more history.
Figure caption, The values in parentheses inside the info table come directly from the Breakout — Settings. The first row shows the custom lower-timeframe used for volume calculations (e.g., “(1)”, “(5)”, or “(1T)”)
2. Price‑Structure Backbone
Even without volume, the indicator draws structural features that underpin all other modules. These features are always on and serve as the reference levels for subsequent calculations.
2.1 What it draws
• Pivots: Swing highs and lows are detected using the pivot_left_input and pivot_right_input settings. A pivot high is identified when the high recorded pivot_right_input bars ago exceeds the highs of the preceding pivot_left_input bars and is also higher than (or equal to) the highs of the subsequent pivot_right_input bars; pivot lows follow the inverse logic. The indicator retains only a fixed number of such pivot points per side, as defined by point_count_input, discarding the oldest ones when the limit is exceeded.
• Trend lines: For each side, the indicator connects the earliest stored pivot and the most recent pivot (oldest high to newest high, and oldest low to newest low). When a new pivot is added or an old one drops out of the lookback window, the line’s endpoints—and therefore its slope—are recalculated accordingly.
• Horizontal support/resistance: The highest high and lowest low within the lookback window defined by length_input are plotted as horizontal dashed lines. These serve as short‑term support and resistance levels.
• Ranked labels: If showPivotLabels is enabled the indicator prints labels such as “HH1”, “HH2”, “LL1” and “LL2” near each pivot. The ranking is determined by comparing the price of each stored pivot: HH1 is the highest high, HH2 is the second highest, and so on; LL1 is the lowest low, LL2 is the second lowest. In the case of equal prices the newer pivot gets the better rank. Labels are offset from price using ½ × ATR × label_atr_multiplier, with the ATR length defined by label_atr_len_input. A dotted connector links each label to the candle’s wick.
2.2 Key settings
• length_input: Window length for finding the highest and lowest values and for determining trend line endpoints. A larger value considers more history and will generate longer trend lines and S/R levels.
• pivot_left_input, pivot_right_input: Strictness of swing confirmation. Higher values require more bars on either side to form a pivot; lower values create more pivots but may include minor swings.
• point_count_input: How many pivots are kept in memory on each side. When new pivots exceed this number the oldest ones are discarded.
• label_atr_len_input and label_atr_multiplier: Determine how far pivot labels are offset from the bar using ATR. Increasing the multiplier moves labels further away from price.
• Styling inputs for trend lines, horizontal lines and labels (color, width and line style).
Figure caption, The chart illustrates how the indicator’s price‑structure backbone operates. In this daily example, the script scans for bars where the high (or low) pivot_right_input bars back is higher (or lower) than the preceding pivot_left_input bars and higher or lower than the subsequent pivot_right_input bars; only those bars are marked as pivots.
These pivot points are stored and ranked: the highest high is labelled “HH1”, the second‑highest “HH2”, and so on, while lows are marked “LL1”, “LL2”, etc. Each label is offset from the price by half of an ATR‑based distance to keep the chart clear, and a dotted connector links the label to the actual candle.
The red diagonal line connects the earliest and latest stored high pivots, and the green line does the same for low pivots; when a new pivot is added or an old one drops out of the lookback window, the end‑points and slopes adjust accordingly. Dashed horizontal lines mark the highest high and lowest low within the current lookback window, providing visual support and resistance levels. Together, these elements form the structural backbone that other modules reference, even when volume data is unavailable.
3. Breakout Module
3.1 Concept
This module confirms that a price break beyond a recent high or low is supported by a genuine shift in buying or selling pressure. It requires price to clear the highest high (“HH1”) or lowest low (“LL1”) and, simultaneously, that the winning side shows a significant volume spike, dominance and ranking. Only when all volume and price conditions pass is a breakout labelled.
3.2 Inputs
• lookback_break_input : This controls the number of bars used to compute moving averages and percentiles for volume. A larger value smooths the averages and percentiles but makes the indicator respond more slowly.
• vol_mult_input : The “spike” multiplier; the current buy or sell volume must be at least this multiple of its moving average over the lookback window to qualify as a breakout.
• rank_threshold_input (0–100) : Defines a volume percentile cutoff: the current buyer/seller volume must be in the top (100−threshold)%(100−threshold)% of all volumes within the lookback window. For example, if set to 80, the current volume must be in the top 20 % of the lookback distribution.
• ratio_threshold_input (0–1) : Specifies the minimum share of total volume that the buyer (for a bullish breakout) or seller (for bearish) must hold on the current bar; the code also requires that the cumulative buyer volume over the lookback window exceeds the seller volume (and vice versa for bearish cases).
• use_custom_tf_input / custom_tf_input : When enabled, these inputs override the automatic choice of lower timeframe for up/down volume; otherwise the script selects a sensible default based on the chart’s timeframe.
• Label appearance settings : Separate options control the ATR-based offset length, offset multiplier, label size and colors for bullish and bearish breakout labels, as well as the connector style and width.
3.3 Detection logic
1. Data preparation : Retrieve per‑side volume from the lower timeframe and take absolute values. Build rolling arrays of the last lookback_break_input values to compute simple moving averages (SMAs), cumulative sums and percentile ranks for buy and sell volume.
2. Volume spike: A spike is flagged when the current buy (or, in the bearish case, sell) volume is at least vol_mult_input times its SMA over the lookback window.
3. Dominance test: The buyer’s (or seller’s) share of total volume on the current bar must meet or exceed ratio_threshold_input. In addition, the cumulative sum of buyer volume over the window must exceed the cumulative sum of seller volume for a bullish breakout (and vice versa for bearish). A separate requirement checks the sign of delta: for bullish breakouts delta_breakout must be non‑negative; for bearish breakouts it must be non‑positive.
4. Percentile rank: The current volume must fall within the top (100 – rank_threshold_input) percent of the lookback distribution—ensuring that the spike is unusually large relative to recent history.
5. Price test: For a bullish signal, the closing price must close above the highest pivot (HH1); for a bearish signal, the close must be below the lowest pivot (LL1).
6. Labeling: When all conditions above are satisfied, the indicator prints “Breakout ↑” above the bar (bullish) or “Breakout ↓” below the bar (bearish). Labels are offset using half of an ATR‑based distance and linked to the candle with a dotted connector.
Figure caption, (Breakout ↑ example) , On this daily chart, price pushes above the red trendline and the highest prior pivot (HH1). The indicator recognizes this as a valid breakout because the buyer‑side volume on the lower timeframe spikes above its recent moving average and buyers dominate the volume statistics over the lookback period; when combined with a close above HH1, this satisfies the breakout conditions. The “Breakout ↑” label appears above the candle, and the info table highlights that up‑volume is elevated relative to its 11‑bar average, buyer share exceeds the dominance threshold and money‑flow metrics support the move.
Figure caption, In this daily example, price breaks below the lowest pivot (LL1) and the lower green trendline. The indicator identifies this as a bearish breakout because sell‑side volume is sharply elevated—about twice its 11‑bar average—and sellers dominate both the bar and the lookback window. With the close falling below LL1, the script triggers a Breakout ↓ label and marks the corresponding row in the info table, which shows strong down volume, negative delta and a seller share comfortably above the dominance threshold.
4. Market Phase Module (Volume Only)
4.1 Concept
Not all markets trend; many cycle between periods of accumulation (buying pressure building up), distribution (selling pressure dominating) and neutral behavior. This module classifies the current bar into one of these phases without using ATR , relying solely on buyer and seller volume statistics. It looks at net flows, ratio changes and an OBV‑like cumulative line with dual‑reference (1‑ and 2‑bar) trends. The result is displayed both as on‑chart labels and in a dedicated row of the info table.
4.2 Inputs
• phase_period_len: Number of bars over which to compute sums and ratios for phase detection.
• phase_ratio_thresh : Minimum buyer share (for accumulation) or minimum seller share (for distribution, derived as 1 − phase_ratio_thresh) of the total volume.
• strict_mode: When enabled, both the 1‑bar and 2‑bar changes in each statistic must agree on the direction (strict confirmation); when disabled, only one of the two references needs to agree (looser confirmation).
• Color customisation for info table cells and label styling for accumulation and distribution phases, including ATR length, multiplier, label size, colors and connector styles.
• show_phase_module: Toggles the entire phase detection subsystem.
• show_phase_labels: Controls whether on‑chart labels are drawn when accumulation or distribution is detected.
4.3 Detection logic
The module computes three families of statistics over the volume window defined by phase_period_len:
1. Net sum (buyers minus sellers): net_sum_phase = Σ(buy) − Σ(sell). A positive value indicates a predominance of buyers. The code also computes the differences between the current value and the values 1 and 2 bars ago (d_net_1, d_net_2) to derive up/down trends.
2. Buyer ratio: The instantaneous ratio TF_buy_breakout / TF_tot_breakout and the window ratio Σ(buy) / Σ(total). The current ratio must exceed phase_ratio_thresh for accumulation or fall below 1 − phase_ratio_thresh for distribution. The first and second differences of the window ratio (d_ratio_1, d_ratio_2) determine trend direction.
3. OBV‑like cumulative net flow: An on‑balance volume analogue obv_net_phase increments by TF_buy_breakout − TF_sell_breakout each bar. Its differences over the last 1 and 2 bars (d_obv_1, d_obv_2) provide trend clues.
The algorithm then combines these signals:
• For strict mode , accumulation requires: (a) current ratio ≥ threshold, (b) cumulative ratio ≥ threshold, (c) both ratio differences ≥ 0, (d) net sum differences ≥ 0, and (e) OBV differences ≥ 0. Distribution is the mirror case.
• For loose mode , it relaxes the directional tests: either the 1‑ or the 2‑bar difference needs to agree in each category.
If all conditions for accumulation are satisfied, the phase is labelled “Accumulation” ; if all conditions for distribution are satisfied, it’s labelled “Distribution” ; otherwise the phase is “Neutral” .
4.4 Outputs
• Info table row : Row 8 displays “Market Phase (Vol)” on the left and the detected phase (Accumulation, Distribution or Neutral) on the right. The text colour of both cells matches a user‑selectable palette (typically green for accumulation, red for distribution and grey for neutral).
• On‑chart labels : When show_phase_labels is enabled and a phase persists for at least one bar, the module prints a label above the bar ( “Accum” ) or below the bar ( “Dist” ) with a dashed or dotted connector. The label is offset using ATR based on phase_label_atr_len_input and phase_label_multiplier and is styled according to user preferences.
Figure caption, The chart displays a red “Dist” label above a particular bar, indicating that the accumulation/distribution module identified a distribution phase at that point. The detection is based on seller dominance: during that bar, the net buyer-minus-seller flow and the OBV‑style cumulative flow were trending down, and the buyer ratio had dropped below the preset threshold. These conditions satisfy the distribution criteria in strict mode. The label is placed above the bar using an ATR‑based offset and a dashed connector. By the time of the current bar in the screenshot, the phase indicator shows “Neutral” in the info table—signaling that neither accumulation nor distribution conditions are currently met—yet the historical “Dist” label remains to mark where the prior distribution phase began.
Figure caption, In this example the market phase module has signaled an Accumulation phase. Three bars before the current candle, the algorithm detected a shift toward buyers: up‑volume exceeded its moving average, down‑volume was below average, and the buyer share of total volume climbed above the threshold while the on‑balance net flow and cumulative ratios were trending upwards. The blue “Accum” label anchored below that bar marks the start of the phase; it remains on the chart because successive bars continue to satisfy the accumulation conditions. The info table confirms this: the “Market Phase (Vol)” row still reads Accumulation, and the ratio and sum rows show buyers dominating both on the current bar and across the lookback window.
5. OB/OS Spike Module
5.1 What overbought/oversold means here
In many markets, a rapid extension up or down is often followed by a period of consolidation or reversal. The indicator interprets overbought (OB) conditions as abnormally strong selling risk at or after a price rally and oversold (OS) conditions as unusually strong buying risk after a decline. Importantly, these are not direct trade signals; rather they flag areas where caution or contrarian setups may be appropriate.
5.2 Inputs
• minHits_obos (1–7): Minimum number of oscillators that must agree on an overbought or oversold condition for a label to print.
• syncWin_obos: Length of a small sliding window over which oscillator votes are smoothed by taking the maximum count observed. This helps filter out choppy signals.
• Volume spike criteria: kVolRatio_obos (ratio of current volume to its SMA) and zVolThr_obos (Z‑score threshold) across volLen_obos. Either threshold can trigger a spike.
• Oscillator toggles and periods: Each of RSI, Stochastic (K and D), Williams %R, CCI, MFI, DeMarker and Stochastic RSI can be independently enabled; their periods are adjustable.
• Label appearance: ATR‑based offset, size, colors for OB and OS labels, plus connector style and width.
5.3 Detection logic
1. Directional volume spikes: Volume spikes are computed separately for buyer and seller volumes. A sell volume spike (sellVolSpike) flags a potential OverBought bar, while a buy volume spike (buyVolSpike) flags a potential OverSold bar. A spike occurs when the respective volume exceeds kVolRatio_obos times its simple moving average over the window or when its Z‑score exceeds zVolThr_obos.
2. Oscillator votes: For each enabled oscillator, calculate its overbought and oversold state using standard thresholds (e.g., RSI ≥ 70 for OB and ≤ 30 for OS; Stochastic %K/%D ≥ 80 for OB and ≤ 20 for OS; etc.). Count how many oscillators vote for OB and how many vote for OS.
3. Minimum hits: Apply the smoothing window syncWin_obos to the vote counts using a maximum‑of‑last‑N approach. A candidate bar is only considered if the smoothed OB hit count ≥ minHits_obos (for OverBought) or the smoothed OS hit count ≥ minHits_obos (for OverSold).
4. Tie‑breaking: If both OverBought and OverSold spike conditions are present on the same bar, compare the smoothed hit counts: the side with the higher count is selected; ties default to OverBought.
5. Label printing: When conditions are met, the bar is labelled as “OverBought X/7” above the candle or “OverSold X/7” below it. “X” is the number of oscillators confirming, and the bracket lists the abbreviations of contributing oscillators. Labels are offset from price using half of an ATR‑scaled distance and can optionally include a dotted or dashed connector line.
Figure caption, In this chart the overbought/oversold module has flagged an OverSold signal. A sell‑off from the prior highs brought price down to the lower trend‑line, where the bar marked “OverSold 3/7 DeM” appears. This label indicates that on that bar the module detected a buy‑side volume spike and that at least three of the seven enabled oscillators—in this case including the DeMarker—were in oversold territory. The label is printed below the candle with a dotted connector, signaling that the market may be temporarily exhausted on the downside. After this oversold print, price begins to rebound towards the upper red trend‑line and higher pivot levels.
Figure caption, This example shows the overbought/oversold module in action. In the left‑hand panel you can see the OB/OS settings where each oscillator (RSI, Stochastic, Williams %R, CCI, MFI, DeMarker and Stochastic RSI) can be enabled or disabled, and the ATR length and label offset multiplier adjusted. On the chart itself, price has pushed up to the descending red trendline and triggered an “OverBought 3/7” label. That means the sell‑side volume spiked relative to its average and three out of the seven enabled oscillators were in overbought territory. The label is offset above the candle by half of an ATR and connected with a dashed line, signaling that upside momentum may be overextended and a pause or pullback could follow.
6. Buyer/Seller Trap Module
6.1 Concept
A bull trap occurs when price appears to break above resistance, attracting buyers, but fails to sustain the move and quickly reverses, leaving a long upper wick and trapping late entrants. A bear trap is the opposite: price breaks below support, lures in sellers, then snaps back, leaving a long lower wick and trapping shorts. This module detects such traps by looking for price structure sweeps, order‑flow mismatches and dominance reversals. It uses a scoring system to differentiate risk from confirmed traps.
6.2 Inputs
• trap_lookback_len: Window length used to rank extremes and detect sweeps.
• trap_wick_threshold: Minimum proportion of a bar’s range that must be wick (upper for bull traps, lower for bear traps) to qualify as a sweep.
• trap_score_risk: Minimum aggregated score required to flag a trap risk. (The code defines a trap_score_confirm input, but confirmation is actually based on price reversal rather than a separate score threshold.)
• trap_confirm_bars: Maximum number of bars allowed for price to reverse and confirm the trap. If price does not reverse in this window, the risk label will expire or remain unconfirmed.
• Label settings: ATR length and multiplier for offsetting, size, colours for risk and confirmed labels, and connector style and width. Separate settings exist for bull and bear traps.
• Toggle inputs: show_trap_module and show_trap_labels enable the module and control whether labels are drawn on the chart.
6.3 Scoring logic
The module assigns points to several conditions and sums them to determine whether a trap risk is present. For bull traps, the score is built from the following (bear traps mirror the logic with highs and lows swapped):
1. Sweep (2 points): Price trades above the high pivot (HH1) but fails to close above it and leaves a long upper wick at least trap_wick_threshold × range. For bear traps, price dips below the low pivot (LL1), fails to close below and leaves a long lower wick.
2. Close break (1 point): Price closes beyond HH1 or LL1 without leaving a long wick.
3. Candle/delta mismatch (2 points): The candle closes bullish yet the order flow delta is negative or the seller ratio exceeds 50%, indicating hidden supply. Conversely, a bearish close with positive delta or buyer dominance suggests hidden demand.
4. Dominance inversion (2 points): The current bar’s buyer volume has the highest rank in the lookback window while cumulative sums favor sellers, or vice versa.
5. Low‑volume break (1 point): Price crosses the pivot but total volume is below its moving average.
The total score for each side is compared to trap_score_risk. If the score is high enough, a “Bull Trap Risk” or “Bear Trap Risk” label is drawn, offset from the candle by half of an ATR‑scaled distance using a dashed outline. If, within trap_confirm_bars, price reverses beyond the opposite level—drops back below the high pivot for bull traps or rises above the low pivot for bear traps—the label is upgraded to a solid “Bull Trap” or “Bear Trap” . In this version of the code, there is no separate score threshold for confirmation: the variable trap_score_confirm is unused; confirmation depends solely on a successful price reversal within the specified number of bars.
Figure caption, In this example the trap module has flagged a Bear Trap Risk. Price initially breaks below the most recent low pivot (LL1), but the bar closes back above that level and leaves a long lower wick, suggesting a failed push lower. Combined with a mismatch between the candle direction and the order flow (buyers regain control) and a reversal in volume dominance, the aggregate score exceeds the risk threshold, so a dashed “Bear Trap Risk” label prints beneath the bar. The green and red trend lines mark the current low and high pivot trajectories, while the horizontal dashed lines show the highest and lowest values in the lookback window. If, within the next few bars, price closes decisively above the support, the risk label would upgrade to a solid “Bear Trap” label.
Figure caption, In this example the trap module has identified both ends of a price range. Near the highs, price briefly pushes above the descending red trendline and the recent pivot high, but fails to close there and leaves a noticeable upper wick. That combination of a sweep above resistance and order‑flow mismatch generates a Bull Trap Risk label with a dashed outline, warning that the upside break may not hold. At the opposite extreme, price later dips below the green trendline and the labelled low pivot, then quickly snaps back and closes higher. The long lower wick and subsequent price reversal upgrade the previous bear‑trap risk into a confirmed Bear Trap (solid label), indicating that sellers were caught on a false breakdown. Horizontal dashed lines mark the highest high and lowest low of the lookback window, while the red and green diagonals connect the earliest and latest pivot highs and lows to visualize the range.
7. Sharp Move Module
7.1 Concept
Markets sometimes display absorption or climax behavior—periods when one side steadily gains the upper hand before price breaks out with a sharp move. This module evaluates several order‑flow and volume conditions to anticipate such moves. Users can choose how many conditions must be met to flag a risk and how many (plus a price break) are required for confirmation.
7.2 Inputs
• sharp Lookback: Number of bars in the window used to compute moving averages, sums, percentile ranks and reference levels.
• sharpPercentile: Minimum percentile rank for the current side’s volume; the current buy (or sell) volume must be greater than or equal to this percentile of historical volumes over the lookback window.
• sharpVolMult: Multiplier used in the volume climax check. The current side’s volume must exceed this multiple of its average to count as a climax.
• sharpRatioThr: Minimum dominance ratio (current side’s volume relative to the opposite side) used in both the instant and cumulative dominance checks.
• sharpChurnThr: Maximum ratio of a bar’s range to its ATR for absorption/churn detection; lower values indicate more absorption (large volume in a small range).
• sharpScoreRisk: Minimum number of conditions that must be true to print a risk label.
• sharpScoreConfirm: Minimum number of conditions plus a price break required for confirmation.
• sharpCvdThr: Threshold for cumulative delta divergence versus price change (positive for bullish accumulation, negative for bearish distribution).
• Label settings: ATR length (sharpATRlen) and multiplier (sharpLabelMult) for positioning labels, label size, colors and connector styles for bullish and bearish sharp moves.
• Toggles: enableSharp activates the module; show_sharp_labels controls whether labels are drawn.
7.3 Conditions (six per side)
For each side, the indicator computes six boolean conditions and sums them to form a score:
1. Dominance (instant and cumulative):
– Instant dominance: current buy volume ≥ sharpRatioThr × current sell volume.
– Cumulative dominance: sum of buy volumes over the window ≥ sharpRatioThr × sum of sell volumes (and vice versa for bearish checks).
2. Accumulation/Distribution divergence: Over the lookback window, cumulative delta rises by at least sharpCvdThr while price fails to rise (bullish), or cumulative delta falls by at least sharpCvdThr while price fails to fall (bearish).
3. Volume climax: The current side’s volume is ≥ sharpVolMult × its average and the product of volume and bar range is the highest in the lookback window.
4. Absorption/Churn: The current side’s volume divided by the bar’s range equals the highest value in the window and the bar’s range divided by ATR ≤ sharpChurnThr (indicating large volume within a small range).
5. Percentile rank: The current side’s volume percentile rank is ≥ sharp Percentile.
6. Mirror logic for sellers: The above checks are repeated with buyer and seller roles swapped and the price break levels reversed.
Each condition that passes contributes one point to the corresponding side’s score (0 or 1). Risk and confirmation thresholds are then applied to these scores.
7.4 Scoring and labels
• Risk: If scoreBull ≥ sharpScoreRisk, a “Sharp ↑ Risk” label is drawn above the bar. If scoreBear ≥ sharpScoreRisk, a “Sharp ↓ Risk” label is drawn below the bar.
• Confirmation: A risk label is upgraded to “Sharp ↑” when scoreBull ≥ sharpScoreConfirm and the bar closes above the highest recent pivot (HH1); for bearish cases, confirmation requires scoreBear ≥ sharpScoreConfirm and a close below the lowest pivot (LL1).
• Label positioning: Labels are offset from the candle by ATR × sharpLabelMult (full ATR times multiplier), not half, and may include a dashed or dotted connector line if enabled.
Figure caption, In this chart both bullish and bearish sharp‑move setups have been flagged. Earlier in the range, a “Sharp ↓ Risk” label appears beneath a candle: the sell‑side score met the risk threshold, signaling that the combination of strong sell volume, dominance and absorption within a narrow range suggested a potential sharp decline. The price did not close below the lower pivot, so this label remains a “risk” and no confirmation occurred. Later, as the market recovered and volume shifted back to the buy side, a “Sharp ↑ Risk” label prints above a candle near the top of the channel. Here, buy‑side dominance, cumulative delta divergence and a volume climax aligned, but price has not yet closed above the upper pivot (HH1), so the alert is still a risk rather than a confirmed sharp‑up move.
Figure caption, In this chart a Sharp ↑ label is displayed above a candle, indicating that the sharp move module has confirmed a bullish breakout. Prior bars satisfied the risk threshold — showing buy‑side dominance, positive cumulative delta divergence, a volume climax and strong absorption in a narrow range — and this candle closes above the highest recent pivot, upgrading the earlier “Sharp ↑ Risk” alert to a full Sharp ↑ signal. The green label is offset from the candle with a dashed connector, while the red and green trend lines trace the high and low pivot trajectories and the dashed horizontals mark the highest and lowest values of the lookback window.
8. Market‑Maker / Spread‑Capture Module
8.1 Concept
Liquidity providers often “capture the spread” by buying and selling in almost equal amounts within a very narrow price range. These bars can signal temporary congestion before a move or reflect algorithmic activity. This module flags bars where both buyer and seller volumes are high, the price range is only a few ticks and the buy/sell split remains close to 50%. It helps traders spot potential liquidity pockets.
8.2 Inputs
• scalpLookback: Window length used to compute volume averages.
• scalpVolMult: Multiplier applied to each side’s average volume; both buy and sell volumes must exceed this multiple.
• scalpTickCount: Maximum allowed number of ticks in a bar’s range (calculated as (high − low) / minTick). A value of 1 or 2 captures ultra‑small bars; increasing it relaxes the range requirement.
• scalpDeltaRatio: Maximum deviation from a perfect 50/50 split. For example, 0.05 means the buyer share must be between 45% and 55%.
• Label settings: ATR length, multiplier, size, colors, connector style and width.
• Toggles : show_scalp_module and show_scalp_labels to enable the module and its labels.
8.3 Signal
When, on the current bar, both TF_buy_breakout and TF_sell_breakout exceed scalpVolMult times their respective averages and (high − low)/minTick ≤ scalpTickCount and the buyer share is within scalpDeltaRatio of 50%, the module prints a “Spread ↔” label above the bar. The label uses the same ATR offset logic as other modules and draws a connector if enabled.
Figure caption, In this chart the spread‑capture module has identified a potential liquidity pocket. Buyer and seller volumes both spiked above their recent averages, yet the candle’s range measured only a couple of ticks and the buy/sell split stayed close to 50 %. This combination met the module’s criteria, so it printed a grey “Spread ↔” label above the bar. The red and green trend lines link the earliest and latest high and low pivots, and the dashed horizontals mark the highest high and lowest low within the current lookback window.
9. Money Flow Module
9.1 Concept
To translate volume into a monetary measure, this module multiplies each side’s volume by the closing price. It tracks buying and selling system money default currency on a per-bar basis and sums them over a chosen period. The difference between buy and sell currencies (Δ$) shows net inflow or outflow.
9.2 Inputs
• mf_period_len_mf: Number of bars used for summing buy and sell dollars.
• Label appearance settings: ATR length, multiplier, size, colors for up/down labels, and connector style and width.
• Toggles: Use enableMoneyFlowLabel_mf and showMFLabels to control whether the module and its labels are displayed.
9.3 Calculations
• Per-bar money: Buy $ = TF_buy_breakout × close; Sell $ = TF_sell_breakout × close. Their difference is Δ$ = Buy $ − Sell $.
• Summations: Over mf_period_len_mf bars, compute Σ Buy $, Σ Sell $ and ΣΔ$ using math.sum().
• Info table entries: Rows 9–13 display these values as texts like “↑ USD 1234 (1M)” or “ΣΔ USD −5678 (14)”, with colors reflecting whether buyers or sellers dominate.
• Money flow status: If Δ$ is positive the bar is marked “Money flow in” ; if negative, “Money flow out” ; if zero, “Neutral”. The cumulative status is similarly derived from ΣΔ.Labels print at the bar that changes the sign of ΣΔ, offset using ATR × label multiplier and styled per user preferences.
Figure caption, The chart illustrates a steady rise toward the highest recent pivot (HH1) with price riding between a rising green trend‑line and a red trend‑line drawn through earlier pivot highs. A green Money flow in label appears above the bar near the top of the channel, signaling that net dollar flow turned positive on this bar: buy‑side dollar volume exceeded sell‑side dollar volume, pushing the cumulative sum ΣΔ$ above zero. In the info table, the “Money flow (bar)” and “Money flow Σ” rows both read In, confirming that the indicator’s money‑flow module has detected an inflow at both bar and aggregate levels, while other modules (pivots, trend lines and support/resistance) remain active to provide structural context.
In this example the Money Flow module signals a net outflow. Price has been trending downward: successive high pivots form a falling red trend‑line and the low pivots form a descending green support line. When the latest bar broke below the previous low pivot (LL1), both the bar‑level and cumulative net dollar flow turned negative—selling volume at the close exceeded buying volume and pushed the cumulative Δ$ below zero. The module reacts by printing a red “Money flow out” label beneath the candle; the info table confirms that the “Money flow (bar)” and “Money flow Σ” rows both show Out, indicating sustained dominance of sellers in this period.
10. Info Table
10.1 Purpose
When enabled, the Info Table appears in the lower right of your chart. It summarises key values computed by the indicator—such as buy and sell volume, delta, total volume, breakout status, market phase, and money flow—so you can see at a glance which side is dominant and which signals are active.
10.2 Symbols
• ↑ / ↓ — Up (↑) denotes buy volume or money; down (↓) denotes sell volume or money.
• MA — Moving average. In the table it shows the average value of a series over the lookback period.
• Σ (Sigma) — Cumulative sum over the chosen lookback period.
• Δ (Delta) — Difference between buy and sell values.
• B / S — Buyer and seller share of total volume, expressed as percentages.
• Ref. Price — Reference price for breakout calculations, based on the latest pivot.
• Status — Indicates whether a breakout condition is currently active (True) or has failed.
10.3 Row definitions
1. Up volume / MA up volume – Displays current buy volume on the lower timeframe and its moving average over the lookback period.
2. Down volume / MA down volume – Shows current sell volume and its moving average; sell values are formatted in red for clarity.
3. Δ / ΣΔ – Lists the difference between buy and sell volume for the current bar and the cumulative delta volume over the lookback period.
4. Σ / MA Σ (Vol/MA) – Total volume (buy + sell) for the bar, with the ratio of this volume to its moving average; the right cell shows the average total volume.
5. B/S ratio – Buy and sell share of the total volume: current bar percentages and the average percentages across the lookback period.
6. Buyer Rank / Seller Rank – Ranks the bar’s buy and sell volumes among the last (n) bars; lower rank numbers indicate higher relative volume.
7. Σ Buy / Σ Sell – Sum of buy and sell volumes over the lookback window, indicating which side has traded more.
8. Breakout UP / DOWN – Shows the breakout thresholds (Ref. Price) and whether the breakout condition is active (True) or has failed.
9. Market Phase (Vol) – Reports the current volume‑only phase: Accumulation, Distribution or Neutral.
10. Money Flow – The final rows display dollar amounts and status:
– ↑ USD / Σ↑ USD – Buy dollars for the current bar and the cumulative sum over the money‑flow period.
– ↓ USD / Σ↓ USD – Sell dollars and their cumulative sum.
– Δ USD / ΣΔ USD – Net dollar difference (buy minus sell) for the bar and cumulatively.
– Money flow (bar) – Indicates whether the bar’s net dollar flow is positive (In), negative (Out) or neutral.
– Money flow Σ – Shows whether the cumulative net dollar flow across the chosen period is positive, negative or neutral.
The chart above shows a sequence of different signals from the indicator. A Bull Trap Risk appears after price briefly pushes above resistance but fails to hold, then a green Accum label identifies an accumulation phase. An upward breakout follows, confirmed by a Money flow in print. Later, a Sharp ↓ Risk warns of a possible sharp downturn; after price dips below support but quickly recovers, a Bear Trap label marks a false breakdown. The highlighted info table in the center summarizes key metrics at that moment, including current and average buy/sell volumes, net delta, total volume versus its moving average, breakout status (up and down), market phase (volume), and bar‑level and cumulative money flow (In/Out).
11. Conclusion & Final Remarks
This indicator was developed as a holistic study of market structure and order flow. It brings together several well‑known concepts from technical analysis—breakouts, accumulation and distribution phases, overbought and oversold extremes, bull and bear traps, sharp directional moves, market‑maker spread bars and money flow—into a single Pine Script tool. Each module is based on widely recognized trading ideas and was implemented after consulting reference materials and example strategies, so you can see in real time how these concepts interact on your chart.
A distinctive feature of this indicator is its reliance on per‑side volume: instead of tallying only total volume, it separately measures buy and sell transactions on a lower time frame. This approach gives a clearer view of who is in control—buyers or sellers—and helps filter breakouts, detect phases of accumulation or distribution, recognize potential traps, anticipate sharp moves and gauge whether liquidity providers are active. The money‑flow module extends this analysis by converting volume into currency values and tracking net inflow or outflow across a chosen window.
Although comprehensive, this indicator is intended solely as a guide. It highlights conditions and statistics that many traders find useful, but it does not generate trading signals or guarantee results. Ultimately, you remain responsible for your positions. Use the information presented here to inform your analysis, combine it with other tools and risk‑management techniques, and always make your own decisions when trading.

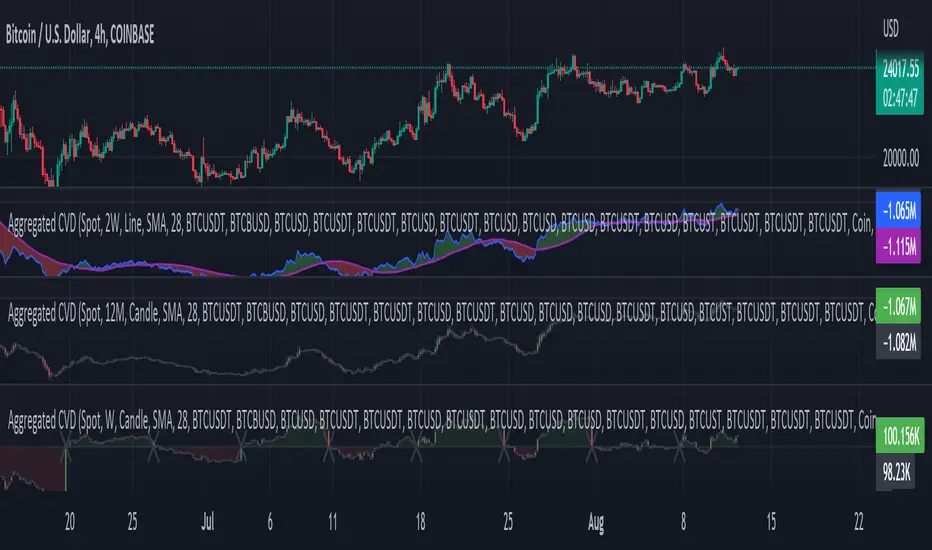
CVD with Moving Average (Trend Colors) [SYNC & TRADE]Yesterday I wrote a simple and easy code for the indicator "Cumulative Delta Volume with a moving average" using AI.
Introduction:
Delta is the difference between buys and sells. If there are more purchases, the delta is positive, if there are more sales, the delta is negative. We look at each candle separately on a particular time frame, which does not give us an overall picture over time.
Cumulative volume delta is in many ways an extension of volume delta, but it covers longer periods of time and provides different trading signals. Like the volume delta indicator, the Cumulative Volume Delta (CVD) indicator measures the relationship between buying and selling pressure, but does not focus on one specific candle (or other chart element), but rather gives a picture over time.
What did you want to get?
I have often seen that they tried to attach RSI and the Ichimoku cloud to the cumulative delta of volume, but I have never seen a cumulative delta of volume with a moving average. A moving average that takes data from the cumulative volume delta will be different from the moving average of the underlying asset. It has been noted that often at the intersection of the cumulative volume delta and the moving average, this is a more accurate signal to buy or sell than the same intersections for the underlying asset.
Initially, 5 moving averages were made with values of 21, 55, 89, 144 and 233, but I realized that this overloads the chart. It is easier to change the length of the moving average depending on the time frame you are using than to overload the chart. The final version with one moving SMA, EMA, RMA, WMA, HMA.
The logic for applying a moving average to a cumulative volume delta:
You choose a moving average, just like you would on your underlying asset. Use the moving average you like and the period you are used to working with. Each TF has its own settings.
What we see on the graph:
This is not an oscillator, but an adapted version for a candlestick chart (line only). Using it, you can clearly see where the market is moving based on the cumulative volume delta. The cool thing is that you can include your moving average applied to the cumulative volume delta. Thanks to this, you can see a trend movement, a return to the moving average to continue the trend.
Opportunities not lost:
The most interesting thing is that it remains possible to observe the divergence of the asset and the cumulative delta of the volume. This gives a great advantage. Those who have not worked with divergence do not rush into it right away. There may be 3 peaks in divergence (as with oversold/overbought), but it works many times more clearly than RSI and MACD.
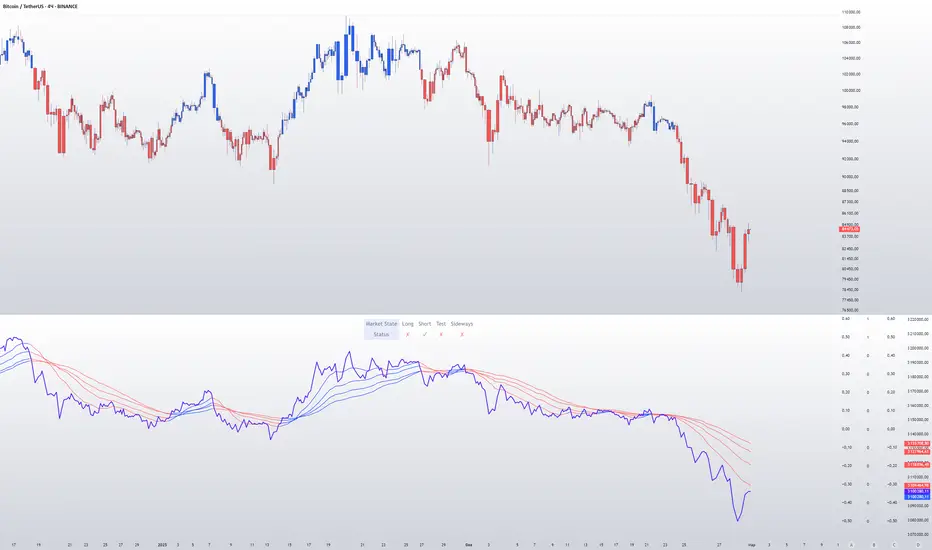
Here's a good example on the daily chart. The moment we were all waiting for 75,000. The cumulative Delta Volume fell with each peak, while the price chart (tops) were approximately level.
Usually they throw (allow to buy) without volume for sales (delta down, price up) in order to merge at a more interesting price. And they also drain without the volume of purchases for a squeeze (price down / delta up) and again I buy back at a more interesting price. There are more complex estimation options; you can read about the divergence of the cumulative delta of the CVD volume. I just recommend doing a backtest.
Recommendations:
One more moment. Use the indicator on the stock exchange, where there is the most money, by turnover and by asset. Choose Binance, not Bybit. Those. choose the BTC asset, for example, but on the Binance exchange. Not futures, but spot.
The greater the turnover on the exchange for an asset, and the fewer opportunities to enter with leverage, the less volatile the price and the more beautiful and accurate the chart.
Works on all assets. There is a subscription limit (the number of calculated bars) that has little effect on anything. Can be applied to any asset where there is volume (not SPX, but ES1, not MOEX, but MX1!).
Перевод на русский.
Вчера написал с помощью AI простой и легкий код индикатора "Кумулятивная Дельта Объема со скользящей средней".
Введение:
Дельта (Delta) — это разница между покупками и продажами. Если покупок больше — дельта положительная, если больше продаж — дельта отрицательная. Мы смотрим на каждую свечу отдельно на том или ином таймфрейме, что не дает нам общей картины во времени.
Кумулятивная дельта объема — во многом продолжение дельты объёмов, но она включает более длительные периоды времени и дает другие торговые сигналы. Как и индикатор дельты объёма, индикатор кумулятивной дельты объема (Cumulative Volume Delta, CVD) измеряет связь между давлением покупателей и продавцов, но при этом не фокусируется на одной конкретной свече (или другом элементе графика), а дает картину во времени.
Что хотел получить?
Часто видел, что к кумулятивной детьте объема пытались прикрепить RSI и облако ишимоку, но никогда не видел кумулятивную дельту объема со скользящей средней. Скользящая средняя которая берет данные от кумулятивной дельты объема будет отличатся от скользящей средней основного актива. Было замечено, что часто в местах пересечения кумулятивной дельты объема и скользящей средней - это более точный сигнал к покупке или продаже, чем такие же пересечения по основному активу.
Изначально было сделанно 5 скользящих со значениями 21, 55, 89, 144 и 233, но я понял, что это перегружает график. Проще менять длину скользящей средней от используемого таймфрейма, чем перегружать график. Финальный вариант с одной скользящей SMA, EMA, RMA, WMA, HMA.
Логика применения скользящей средней к кумулятивной дельте объема:
Вы выбираете скользящую среднюю, так же как и на основном активе. Применяйте ту скользящую среднюю, которая вам нравится и период, с которым привыкли работать. На каждом TF свои настройки.
Что мы видим на графике:
Это не осциллятор, а адаптированная версия к свечному графику (только линия). С помощью него вы можете наглядно посмотреть куда движется рынок по кумулятивной дельте объема. Самое интересное, что вы можете включить свою скользящую среднюю, применимую к кумулятивной дельте объема. Благодаря этому вы можете видеть трендовое движение, возврат к средней скользящей для продолжения тренда.
Не потерянные возможности:
Самое интересное, что осталась возможность наблюдать за дивергенцией актива и кумулятивной дельтой объема. Это дает большое преимущество. Те кто не работал с дивергенцией не бросайтесь на нее сразу. Может быть и 3 пика в дивергенции (как с перепроданностью / перекупленностью), но работает в разы четче чем RSI и MACD.
Вот хороший пример на дневном графике. Момент когда мы все ждали 75000. Кумулятивная Дельта Объема падала с каждым пиком, в то время как ценовой график (вершины) были примерно на уровне.
Обычно закидывают (разрешают покупать) без объема на продажи (дельта вниз цена вверх), чтобы слить по более интересной цене. И также сливают без объема покупок для сквиза (цена вниз / дельта вверх) и опять откупаю по более интересной цене. Существуют более сложные варианты оценки, можете почитать про дивергенцию кумулятивной дельты объема CVD. Только рекомендую сделать бэктест.
Рекомендации:
Еще момент. Используйте индикатор, на бирже, там где больше всего денег, по обороту и по активу. Выбирайте не Bybit, а Binance. Т.е. выбираете актив BTC, к примеру, но на бирже Binance. Не фьючерс, а спот.
Чем более большие обороты на бирже, по активу, и меньше возможностей заходить с плечами, тем менее волатильная цена и более красивый и точный график.
Работает на всех активах. Есть ограничение по подписке (количество рассчитываемых баров) мало влияет на что. Можно применить к любому активу где есть объем (не SPX, а ES1, не MOEX, а MX1!).
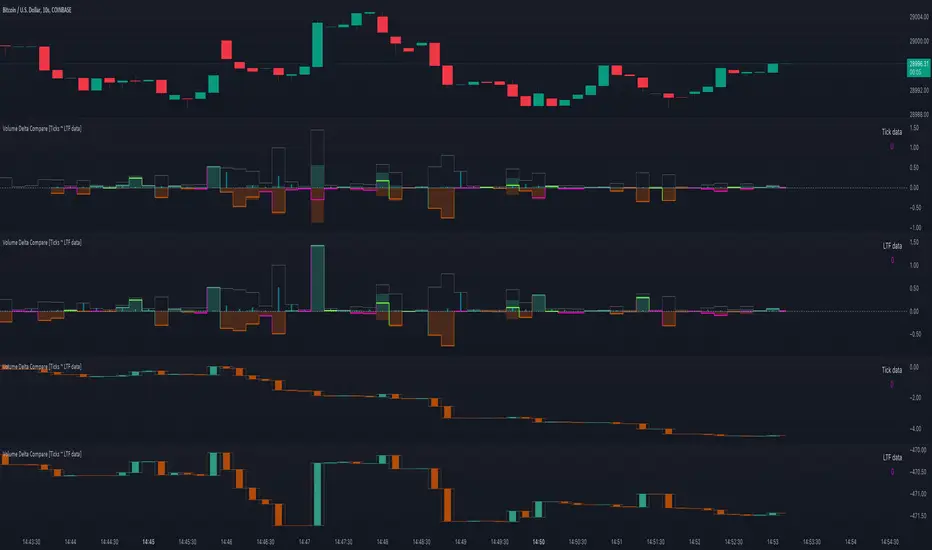
Volume Delta Compare [Ticks ~ LTF data]
The "Volume Delta Compare " publication shows 2 different techniques to show into-depth details of Volume, using Tick and Lower-Time-Frame (LTF) data.
🔶 USAGE
Check for divergences between price and volume movement
Check details (why and when a ΔV developed)
Or if you want to see a lot of data stacked on each other )
🔶 CONCEPTS
🔹 Tick vs. LTF data
a Tick is an measure of (upward or downward) movement in price OR volume.
We can use this data by using varip in the code.
Advantage:
• Detail, detail, detail
• Accurate, per tick
Disadvantage:
• Only realtime
• Can reset 'easily' -> loss of data
• Will reset when settings are changed
LTF data, through the request.security_lower_tf() function, measures the OHLCV data per LTF bar
Advantage:
• Access to history when loading a chart
• No 'loss' of data when chart resets
Disadvantage:
• Less detailed
• Less accurate
This script makes it possible to compare the 2 techniques and enables you to show different values.
🔹 Values
There are mainly 3 important values:
• UP volume (uV): volume when price rises
• DOWN volume (dV): volume when price falls
• NEUTRAL volume (nV): volume when price stays the same
From this, additional data is calculated:
• Volume Delta (ΔV): uV minus dV
• Cumulative Delta Volume (cΔV): sum of ΔV
One typical nV is at open: at that moment there isn't a base price to compare with,
so when the first trade doesn't fully fill the first supply (up or down), volume will rise, but price just is 'open', no movement -> no uV or dV.
• Tick data: every volume changement per tick will be added to the concerning variable (uV, dV or nV)
• LTF data: every volume changement of each bar will be added to the concerning variable (uV, dV or nV)
-> this can easily give a difference, for example (Tick vs. 1 minute LTF), when most of the ticks caused a rise of price, but at the last few seconds, a few ticks causes the close to come below open, with Tick data this could give more UP Volume, while LTF data will show 1 value of DOWN Volume.
🔶 EXAMPLES
🔹 Details
In these examples you can see:
• grey line: Total volume (higher precision)
• UP/DOWN/NEUTRAL Volume
• green columns: uV
• orange columns: dV
• blue pillars: nV
• coloured stepline: reflects ΔV
• close > open and positive ΔV -> green
• close > open but negative ΔV -> fuchsia
• close < open and negative ΔV -> orange
• close < open but positive ΔV -> bright lime green
• Right side -> indication of used data (Tick/LTF data) + last ΔV
• labels (can be disabled)
Above 0 (only with Tick data): data from EVERY tick (ΔV ):
• first the amount of Volume (0 when the amount is very minimal)
• between brackets: price movement
Below 0:
• Σ V: sum of uV, dV and nV, for that bar
• Σ up: sum of uV for that bar
• Σ dn: sum of dV for that bar
• Σ nt: sum of nV for that bar
• Σ P: sum of price movement, for that bar (only at Tick data)
(At the right you'll see a new bar just started)
Here is a detail of the first second at opening:
🔹 Cumulative Volume Delta (CVD)
Difference CVD based on Tick vs. LTF data :
(horizontal lines added for reference)
🔶 FEATURES
🔹 Minimal plotting of na values
Data window and status line only show what is applicable (tick or LTF data) to diminish clutter of data values:
The Tick option has a label above 0 which includes details of every Tick.
If data is added every tick, that label on a 10 minute chart will be filled beyond limitations pretty quickly (string max_length = 4096 limit).
To prevent the script stopping to execute, at a certain limit, this label will stop updating and show the message "Too much data".
The label below the 0-line won't reach that limit, so it will keep on updating.
Timeframes closer to 1 second will have less risk to reach that 4096 limit. Details will remain to show in this case.
🔹 Automatic label colour adaption when changing between dark/light mode values
Label background/text-colour will adapt according to the dark/light-mode by using chart.fg_color / chart.bg_color
🔶 SETTINGS
🔹 Data from: Ticks vs. LTF data
🔹 LTF: Lower Time-Frame for when LTF option is chosen: 1, 5, 10, 15, 30 Seconds or 1 minute
🔹 Also start when bar already has data: only for tick data -> when disabled calculations only start on a new bar.
🔹 CVD, Only show Cumulative Delta Volume: enable to just display CVD
🔹 Colours: colour at the right is for price/volume direction divergences
🔹 Label: choose what you want to display + size labels
🔹 0-line: The label under the 0-line sometimes goes below the chart. this can be adjusted with this setting.
Aggregation BTC CVDThe script calculates the Cumulative Volume Delta (CVD) for multiple cryptocurrency exchanges, then averages these values and plots them.
Indicator Setup:
The script sets up an indicator called "BTC Cumulative Volume Delta (CVD) for multiple cryptocurrency exchanges", displayed as a separate panel (not overlaid on the price chart) with volume format.
Getting 1-minute data from multiple exchanges:
It retrieves 1-minute data (buy and sell volumes) for Bitcoin (BTC) against USD or USDT from several exchanges: Binance, OKEx, Coinbase (both BTCUSDT and BTCUSD), Bitfinex, Bybit, Huobi, and Kraken.
Calculating total buying and selling volume for each exchange:
For each exchange, it calculates the total buying volume (buy_vol_...), selling volume (sell_vol_...), and the difference between them (delta_vol_...).
It then computes the cumulative delta volume (cum_delta_vol_...), which is a running total of delta_vol_....
Calculating the average CVD:
It calculates the average cumulative delta volume (average_cum_delta_vol) by summing the cumulative delta volumes from all exchanges and dividing by the number of exchanges.
Plotting the average CVD:
Finally, it plots the average CVD with white color, and a line width of 2.
This script essentially provides an averaged Cumulative Volume Delta across multiple exchanges, giving a comprehensive view of buying and selling pressure in the Bitcoin market across these platforms.

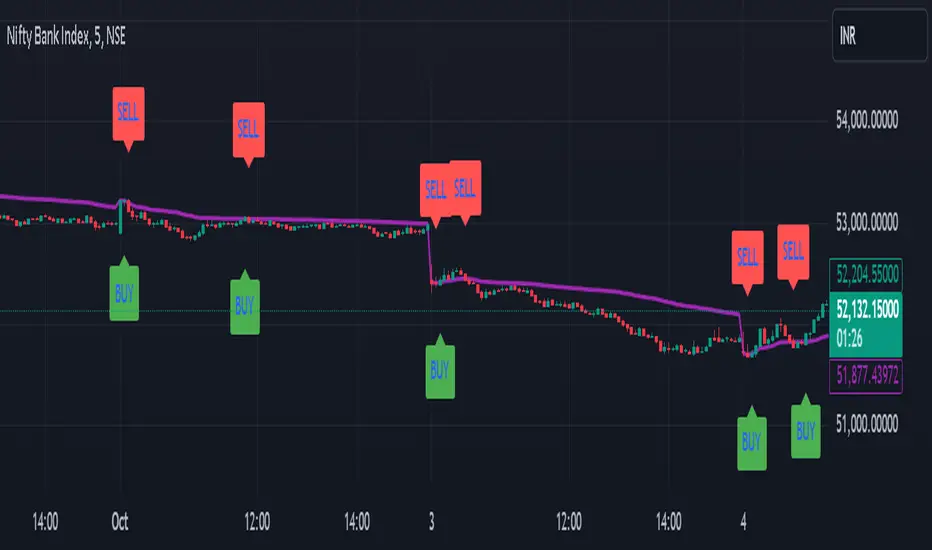
Cumulative Volume Delta with VWAP-based Buy/Sell AlertsDescription:
This script combines Cumulative Volume Delta (CVD) with Volume Weighted Average Price (VWAP) to generate buy and sell signals. It plots both the cumulative volume delta and its moving average on the chart, but the actual buy and sell signals are now based on the crossover and crossunder of the price with the VWAP, a popular tool for tracking price relative to the volume-weighted average over time.
Features:
Cumulative Volume Delta (CVD) Plot:
CVD helps visualize the net buying or selling pressure by accumulating volume when the price is rising and subtracting it when the price is falling. The cumulative volume is plotted on the chart as a blue line.
Moving Average of CVD:
A simple moving average (SMA) of the cumulative volume delta is plotted in orange to smooth out fluctuations and help detect the trend of volume flow.
VWAP Calculation:
VWAP (Volume Weighted Average Price) is a standard benchmark widely used in trading. It gives insight into whether the price is trading above or below the average price at which most of the volume has traded, weighted by volume. The VWAP is plotted as a purple line on the chart.
Buy/Sell Signals Based on VWAP:
Buy Signal: Triggered when the price crosses above the VWAP, indicating potential upward momentum.
Sell Signal: Triggered when the price crosses below the VWAP, signaling potential downward momentum.
These signals are displayed on the chart with clear labels:
Buy Signal: A green upward label appears below the price.
Sell Signal: A red downward label appears above the price.
Alerts for Buy/Sell Conditions:
Alerts are built into the script, so traders can receive notifications when the following conditions are met:
Buy Alert: The price crosses above the VWAP.
Sell Alert: The price crosses below the VWAP.
Use Case:
This script is useful for traders looking to incorporate both volume-based indicators and the VWAP into their trading strategy. The combination of CVD and VWAP provides a more comprehensive view of both price and volume dynamics:
VWAP helps traders understand whether the price is trading above or below its volume-weighted average.
CVD highlights buying or selling pressure through cumulative volume analysis.
Customization:
Anchor Periods: The user can customize the anchor period to suit different timeframes and trading styles.
Custom Alerts: The alert conditions can be easily modified to integrate into any trader’s strategy.
This script can be adapted for both short-term and long-term trading strategies and is especially useful in high-volume markets.
How to Use:
Add the script to your TradingView chart.
Customize the timeframe and anchor period, if needed, to match your preferred trading style.
Watch for Buy/Sell signals based on price crossing the VWAP.
Set up alerts to receive notifications when Buy or Sell signals are triggered.
This script is designed to help traders make informed decisions based on both price action relative to volume and Cumulative Delta volume trends, giving a more comprehensive view of the market dynamics.
Aggr. CDV / Delta Volume - InFinitoModified & Updated script from MARKET VOLUME by Ricardo M Arjona @XeL_Arjona that Includes Aggregated Volume, Delta Volume, Volume by Side
Aggregation code originally from Crypt0rus
Candle Plotting code from LonesomeTheBlue
***The indicator can be used for any coin/symbol to aggregate volume , but it has to be set up manually***
***The indicator can be used with specific symbol data only by disabling the aggregation option, which allows for it to be used on any symbol***
- Calculated based on Aggregated Volume instead of by symbol volume . Using aggregated data makes it more accurate and allows to compare volume flow between different kinds of markets (Spot, Futures , Perpetuals, Futures+Perpetuals and All Volume ).
- As well, in order to make the data as accurate as possible, the data from each exchange aggregated is normalized to report always in terms of 1 BTC . In case this indicator is used for another symbol, the calculations can be adjusted manually to make it always report data in terms of 1 contract/coin.
All Aggregated Volume By Side: Based of Xel_Arjona's calculation, buy and sell volume is estimated each period. This indicators can display both Buy Volume and Sell Volume for each period.
Aggregated Delta Volume By Side: Displays the difference between Buy & Sell Volume as Delta (Down if Sell Vol - Up if Buy Vol)
Aggregated Cumulative Delta Volume: Displays the sum of Delta Volume as a line, candles or Heiken Aishi Candles. Great for observing Volume Flow and spotting divergences
- It is Possible to add an MA to the CVD and to color fill in between the indicator and the MA
- It is possible to reset the indicators basis to 0 periodically
Volume CVD and Open InterestVolume, Cumulative Delta Volume and Open Interest are great indications of strength and sentiment in the market. Until now they have required separate indicators, but this indicator can show them all.
With a clean and aesthetic plot, this indicator has the option to choose the data source:
- Volume - the total volume of transactions, buys and sells
- Up Volume - the total volume from buys only
- Down Volume - the total volume from sells only
- Up/Down Volume (Net) - the difference in the Buy Volume and Sell Volume
- Cumulative Delta - the sum of the up/down volume for the previous 14 bars
- Cumulative Delta EMA - a smoothed average of the sum of the up/down volume for the previous 14 bars, over a 14 period EMA
- Open Interest - a user defined ticker, whose value is added to the plot, while this is designed to be used with Open Interest tickers, you can actually choose any ticker you want, perhaps you want to see DXY while charting Bitcoin!
There are several customization features for the colour of the plot, with a nice gradient colouring from high to low. You can choose the lookback which defines only the highest and lowest values for the colour gradient. There is also an option for how the Open Interest value is determined, based on Close, Open or differences between previous values.
While similar, Volume and Open Interest are not the same. To me the simplest explanation is Volume shows the trades that have been executed and the buy/sell direction, while Open Interest shows the value of open trades that are yet to be completed.
Volume shows strength, sentiment and volatility.
Open Interest does not show direction, but does indicate momentum and liquidity in the market.

ETS Prox Cumulative Volume Delta BBThis script is based on the work originally done by kprsa for the Monster Cumulative Delta indicator, but adds Bollinger Bands and upgrades it to version 4 from version 1.
It is an approximation of the Cumulative Delta Volume that is usually based on volume differences between market and limit orders, but because that data is not available, this indicator allocates a portion of the volume of a candle to the "upward" and "downward force" of each candle.
The upward force of a "Buy" candle is calculated by the High-Low
The downward force is calculated by (High-Close)+(Open-Low)
"Sell" candles are calculated in the same way just opposite
Total force=up force + down force
Up volume approximation = candle volume * up force/total force
Down volume approximation = candle volume * down force/total force
The result is similar to OBV, but not exactly the same, and allows for a "candle size" which you can't get with On Balance Volume.
I had never used a Cumulative Delta Volume indicator before, but when I started using it myself, it proved very effective when there was a deviation from price. It was also very effective in my opinion when Bollinger Bands was added to assess the standard deviation of the CDV compared to the Bollinger Band of price and looking for areas where the CDV reaction to hitting or getting close to the BB was different.
I hope you find it useful! Of course, it comes with no guarantee of profits or any investing advice whatsoever.
Buying/Selling PressureBuying/Selling Pressure - Volume-Based Market Sentiment
Buying/Selling Pressure identifies market dominance by separating volume into buying and selling components. The indicator uses Volume ATR normalization to create a universal pressure oscillator that works consistently across all markets and timeframes.
What is Buying/Selling Pressure?
This indicator answers a fundamental question: Are buyers or sellers in control? By analyzing how volume distributes within each bar, it calculates cumulative buying and selling pressure, then normalizes the result using Volume ATR for cross-market comparability.
Formula: × 100
Where Delta = Buying Volume - Selling Volume
Calculation Methods
Money Flow (Recommended):
Volume weighted by close position in bar range. Close near high = buying pressure, close near low = selling pressure.
Formula: / (high - low)
Simple Delta:
Basic approach where bullish bars = 100% buying, bearish bars = 100% selling.
Weighted Delta:
Volume weighted by body size relative to total range, focusing on candle strength.
Key Features
Volume ATR Normalization: Adapts to volume volatility for consistent readings across assets
Cumulative Delta: Tracks net buying/selling pressure over time (similar to OBV)
Signal Line: EMA smoothing for trend identification and crossover signals
Zero Line: Clear visual separation between buyer and seller dominance
Color-Coded Display: Green area = buyers control, red area = sellers control
Interpretation
Above Zero: Buyers dominating - cumulative buying pressure exceeds selling
Below Zero: Sellers dominating - cumulative selling pressure exceeds buying
Cross Signal Line: Momentum shift - pressure trend changing direction
Increasing Magnitude: Strengthening pressure in current direction
Decreasing Magnitude: Weakening pressure, potential reversal
Volume vs Pressure
High volume with low pressure indicates balanced battle between buyers and sellers. High pressure with high volume confirms strong directional conviction. This separation provides insights beyond traditional volume analysis.
Best Practices
Use with price action for confirmation
Divergences signal potential reversals (price makes new high/low but pressure doesn't)
Large volume with near-zero pressure = indecision, breakout preparation
Signal line crossovers provide momentum change signals
Extreme readings suggest potential exhaustion
Settings
Calculation Method: Choose Money Flow, Simple Delta, or Weighted Delta
EMA Length: Period for cumulative delta smoothing (default: 21)
Signal Line: Optional EMA of oscillator for crossover signals (default: 9)
Buying/Selling Pressure transforms volume analysis into actionable market sentiment, revealing whether buyers or sellers control price action beneath surface volatility.
This indicator is designed for educational and analytical purposes. Past performance does not guarantee future results. Always conduct thorough research and consider consulting with financial professionals before making investment decisions.

Volume Channel Flow [ChartPrime]⯁ OVERVIEW — Volume Channel Flow
The Volume Channel Flow indicator dynamically tracks evolving trend channels while simultaneously analyzing volume distribution within each channel segment.
By combining adaptive volatility-based channel boundaries with real-time volume profiling, the tool highlights directional bias, structural breakouts, and zones where buy/sell pressure is concentrated.
This makes it a powerful hybrid of a trend-tracking system and a miniature volume-profile engine that updates live as the market moves.
⯁ CONCEPTS
Dynamic Volatility Channel:
Upper and lower channel levels are continuously recalculated using ATR. These levels shift only when price breaks outside the previous channel, signaling a trend transition.
Channel Segmentation:
When a channel shift occurs, the previous segment is closed and visually plotted as its own range — allowing traders to inspect each discrete “flow phase” of the market.
Embedded Volume Profile:
Inside each channel segment, the indicator builds a mini volume histogram using user-defined binning. This creates a quick visual read of how volume was distributed within that price range.
Point of Control (PoC):
The price level with the highest traded volume inside each completed segment is detected and plotted as a dashed horizontal PoC line.
Flow Bias (Bullish/Bearish):
The volume profile color adapts depending on whether cumulative delta volume (buy minus sell pressure) is positive or negative for the segment.
Breakout Labels:
When a new channel is formed, arrows mark whether the breakout occurred upward or downward.
⯁ FEATURES
Adaptive Trend Channel Construction
Channels update only when price closes beyond upper or lower volatility thresholds. This isolates trend shifts with minimal noise.
Channel Visualization Options
Choose to display full channel boxes or only trend lines using customizable styling.
Real-Time Volume Profiling
As long as the channel remains active, volume distribution is recalculated live on every bar.
PoC Projection
The PoC is drawn across the channel range, marking the highest-volume price level for each segment.
Directional Delta Coloring
Volume profiles automatically shift to bullish or bearish colors based on cumulative delta inside the channel.
Breakout Detection
Arrows highlight each transition into a new channel regime.
⯁ HOW TO USE
Spot trend changes using breakout arrows and the creation of new trend channels.
Gauge strength of a channel by examining the density and shape of the internal volume profile.
Use PoC levels as potential support/resistance interaction zones.
Validate momentum by checking whether volume delta shows bullish or bearish dominance.
Monitor channel edges to anticipate continuation or reversal setups.
⯁ CONCLUSION
The Volume Channel Flow indicator merges trend structure with volume analytics, providing a continuously adaptive picture of market flow.
It not only detects where trend phases begin and end, but also reveals what type of volume behavior shaped each segment, offering a deeper understanding of trend strength and directional pressure.

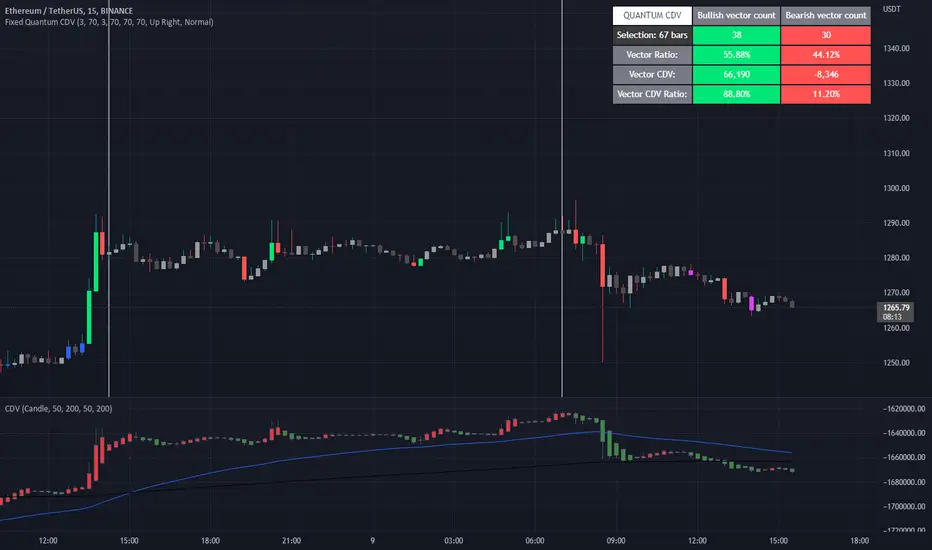
Fixed Quantum CDVWe took the original script Cumulative delta volume from LonesomeTheBlue, here is the link:
To understand the CDV you can watch traders reality master class about CDV.
This indicator show the ratio of vector color and the ratio of the cumulative delta volume from vector color.
First you select a date range on the chart. Then it calculate all candles in that region. Let's say there is 3 green vectors and 3 red vectors in the region, the ratio of vector color will be 50% for bull and 50% for bear vector. As for the CDV ratio, it will measure the total CDV inside green vector and total CDV inside red vector and make a ratio. But it is a little different.
I twisted the calculation for the ratio of CDV a little bit to make it more comprehensive in the table. Since it's the ratio of the CDV for the bull candles versus the bear candles, the CDV is almost always a positive number for the bull candles and almost always a negative number for the bear candle. So I calculated the bear CDV as a positive number. Formula: Bull_CDV_ratio = Bull_CDV / (Bull_CDV + Bear_CDV), Bear_CDV_ratio = -Bear_CDV / (Bull_CDV - Bear_CDV).
Note that when the bull CDV and bear CDV are both a positive number or both a negative number, the ratio percentage can be over 100% and under 0%. It means that we expect volatility.
Enjoy!
CDV Momentum WaveDescription:
This indicator visualizes the Cumulative Delta Volume (CDV) as waves, providing traders with insights into the momentum and strength of buying and selling activity. By tracking the cumulative difference between buying and selling pressure, it highlights shifts in market sentiment with color-coded wave patterns.
How to Use:
Spot Momentum:
Green waves signify strong buying pressure, while red waves indicate dominant selling pressure. Blue and orange waves mark transitions or weaker momentum.
Trend Analysis:
Persistent color and direction in waves reflect a strong trend, while frequent shifts may signal reversals or consolidation.
Sensitivity Adjustment:
Use the mul2 setting to fine-tune wave responsiveness for short-term or long-term analysis.
Wave Position Adjustment:
The osx setting adjusts the visual placement of the waves on the chart.
By default (osx = 0), the waves are aligned directly with the candle data they are calculated from.
Increasing osx shifts the waves forward.
Decreasing osx shifts the waves backward.
This tool helps traders detect momentum shifts, confirm trends, and understand volume dynamics in various market conditions.

Strategy Myth-Busting #11 - TrendMagic+SqzMom+CDV - [MYN]This is part of a new series we are calling "Strategy Myth-Busting" where we take open public manual trading strategies and automate them. The goal is to not only validate the authenticity of the claims but to provide an automated version for traders who wish to trade autonomously.
Our 11th one is an automated version of the "Magic Trading Strategy : Most Profitable Indicator : 1 Minute Scalping Strategy Crypto" strategy from "Fx MENTOR US" who doesn't make any official claims but given the indicators he was using, it looked like on the surface that this might actually work. The strategy author uses this on the 1 minute and 3 minute timeframes on mostly FOREX and Heiken Ashi candles but as the title of his strategy indicates is designed for Crypto. So who knows..
To backtest this accurately and get a better picture we resolved the Heiken Ashi bars to standard candlesticks . Even so, I was unable to sustain any consistency in my results on either the 1 or 3 min time frames and both FOREX and Crypto. 10000% Busted.
This strategy uses a combination of 3 open-source public indicators:
Trend Magic by KivancOzbilgic
Squeeze Momentum by LazyBear
Cumulative Delta Volume by LonesomeTheBlue
Trend Magic consists of two main indicators to validate momentum and volatility. It uses an ATR like a trailing Stop to determine the overarching momentum and CCI as a means to validate volatility. Together these are used as the primary indicator in this strategy. When the CCI is above 0 this is confirmation of a volatility event is occurring with affirmation based upon current momentum (ATR).
The CCI volatility indicator gets confirmation by the the Cumulative Delta Volume indicator which calculates the difference between buying and selling pressure. Volume Delta is calculated by taking the difference of the volume that traded at the offer price and the volume that traded at the bid price. The more volume that is traded at the bid price, the more likely there is momentum in the market.
And lastly the Squeeze Momentum indicator which uses a combination of Bollinger Bands, Keltner Channels and Momentum are used to again confirm momentum and volatility. During periods of low volatility, Bollinger bands narrow and trade inside Keltner channels. They can only contract so much before it can’t contain the energy it’s been building. When the Bollinger bands come back out, it explodes higher. When we see the histogram bar exploding into green above 0 that is a clear confirmation of increased momentum and volatile. The opposite (red) below 0 is true when there are low periods. This indicator is used as a means to really determine when there is premium selling plays going on leading to big directional movements again confirming the positive or negative momentum and volatility direction.
If you know of or have a strategy you want to see myth-busted or just have an idea for one, please feel free to message me.
Trading Rules
1 - 3 min candles
FOREX or Crypto
Stop loss at swing high/low | 1.5 risk/ratio
Long Condition
Trend Magic line is Blue ( CCI is above 0) and above the current close on the bar
Squeeze Momentum's histogram bar is green/lime
Cumulative Delta Volume line is green
Short Condition
Trend Magic line is Red ( CCI is below 0) and below the current close on the bar
Squeeze Momentum's histogram bar is red/maroon
Cumulative Delta Volume line is peach

Koncorde PlusKONCORDE IS ONLY INTENDED TO BE APPLIED TO ASSETS WHERE VOLUME DATA IS PROVIDED.
This indicator is made up of 6 indicators: 4 trend (RSI, MFI, BB, Stochastic) and 2 volume. The 2's for volume are the PVI (positive volume index) and the NVI (negative volume index). These two indicators are the interesting ones as they are programmed to proportionally attribute the volume traded between the strong hands (sharks) and the weak hands (minnows).
As for what time period to use, the bigger the better, since after all what we are doing is data analysis and therefore the more data, the better.
When strong hands (blue histogram) are below zero, they are said to be selling while when they are above zero, they are said to be buying. The same goes for weak hands (green histogram).
Meaning of each zone:
Blue histogram: strong hand (sharks). If it is positive it indicates accumulation and if it is negative distribution.
Green histogram: weak hand (minnows). If it is positive it indicates buy and if it is negative it indicates sale.
Brown histogram: Indicates the trend and depends on previous values of weak hands and trend indicators (RSI, MFI, BB, Stochastic).
Red line: It is an average that smoothes the trend indicated by the brown histogram (default is the EMA).
Crossing Pattern
The pattern gives us a bullish entry signal when the trend (brown histogram) crosses above the average (red line) and is positioned bearish when the trend crosses below the average.
Zero Pattern
When the price trend (brown histogram) tends to zero, it means that there will be a change in its trend. This pattern is for trading in a bullish position.
Spring Pattern
When a cross between the average (red line) and the trend (brown histogram) has already occurred, and in addition the weak hands are above the price trend, that "spring on the mountain" is formed that gives us to understand that the upward trend will be more than evident.
Mirror Pattern
This pattern occurs when there is panic in the market and weak hands are selling (below zero). If at that moment the strong hands are buyers, the price tends to level off to begin the rise later.
This pattern is compatible with the Crossover Pattern, having more guarantees of success. If just after finishing the mirror pattern, the Crossover Pattern plus the Spring Pattern appears, then we have a good chance of winning.
Bear Hug Pattern
This pattern is for bearish positions only. It is the opposite figure to the mirror pattern. That is, we have strong hands clearly selling and weak hands clearly buying and above the price trend (brown histogram). It is the figure where you can see that the strong hands are distributing the assets to the weak hands.
Harpoon Pattern
If when the mirror pattern occurs, the red line crosses the blue histogram, a very strong bullish entry signal is produced.
Add an exit signal which occurs when we are in a spring pattern but the big hands start selling, mostly coinciding with the start of the bear hug pattern.
General rules for operating the Mirror Pattern:
a) Wait for the green histogram to start recovery, rise to positive values; if possible, until it crosses from bottom to top the brown line (brown histogram) and/or red average .
b) The blue histogram should be consistently positive. If it turns and goes towards negative values it can indicate a failed pattern at that same point.
c) Locate the low of the lower candle within the pattern and place the Stop Loss just below it for reference.
d) If we are not sure (we almost never will be) that there will be a turn or if it could finally be a bearish continuation we can use the SL to go short .
Additional:
A panel with performance statistics of the analyzed asset was added.
Added an indicator that shows the cumulative delta volume in the form of triangles at the top of the chart.
Added of user @DonovanWall
PS: Unofficial version, I was guided by the description of the BLAI5 author's website www.blai5.net
DISCLAIMER: For educational and entertainment purposes only. Nothing in this content should be interpreted as financial advice or a recommendation to buy or sell any sort of security or investment including all types of cryptos. DYOR, TYOB.

COIN/BTC Volume-Weighted DivergenceThe COIN/BTC Volume-Weighted Divergence indicator identifies buy and sell signals by analyzing deviations between Coinbase and Bitcoin prices relative to their respective VWAPs (Volume-Weighted Average Price). This method isolates points of potential trend reversals, overextensions, or relative mispricing based on volume-adjusted price benchmarks.
The indicator leverages Coinbase’s high beta relative to Bitcoin in bull markets. A buy signal occurs when Coinbase is below VWAP (indicating undervaluation) while Bitcoin is above VWAP (signaling strong broader momentum). A sell signal is generated when Coinbase trades above VWAP (indicating overvaluation) while Bitcoin moves below VWAP (indicating weakening momentum).
This divergence logic enables traders to identify misalignment between Bitcoin-driven market trends and Coinbase’s price behavior. The indicator effectively identifies undervalued entry points and signals exits before speculative extensions are correct. It provides a systematic approach to trading during trending conditions, aligning decisions with volume-weighted price dynamics and inter-asset relationships.
How It Works
1. VWAP:
“fair value” benchmark combining price and volume.
• Above VWAP: Bullish momentum.
• Below VWAP: Bearish momentum.
2. Divergence:
• Coinbase Divergence: close - coin_vwap (distance from COIN’s VWAP).
• Bitcoin Divergence: btc_price - btc_vwap (distance from BTC’s VWAP).
3. Signals:
• Buy: Coinbase is below VWAP (potentially oversold), and Bitcoin is above VWAP (broader bullish trend).
• Sell: Coinbase is above VWAP (potentially overbought), and Bitcoin is below VWAP (broader bearish trend).
4. Visualization:
• Green triangle: Buy signal.
• Red triangle: Sell signal.
Strengths
• Combines price and volume for reliable insights.
• Highlights potential trend reversals or overextensions.
• Exploits correlations between Coinbase and Bitcoin.
Limitations
• Struggles in sideways markets.
• Sensitive to volume spikes, which may distort VWAP.
• Ineffective in strong trends where divergence persists.
Improvements
1. Z-Scores: Use statistical thresholds (e.g., ±2 std dev) for stronger signals.
2. Volume Filter: Generate signals only during high-volume periods.
3. Momentum Confirmation: Combine with RSI or MACD for better reliability.
4. Multi-Timeframe VWAP: Use intraday, daily, and weekly VWAPs for deeper analysis.
Complementary Tools
• Momentum Indicators: RSI, MACD for trend validation.
• Volume-Based Metrics: OBV, cumulative delta volume.
• Support/Resistance Levels: Enhance reversal accuracy.

Divergence for Many Panel (D4MP+)Divergence for Many Panel (D4MP+)
This Divergence for Many Panel indicator is built upon the realtme divergence drawing code originally authored by LonesomeTheBlue, now in the form of a panel indicator.
The available oscillators, hand picked for their ability to identify high quality divergences currently include:
- Ultimate Oscillator (UO)
- True Strength Index (TSI)
- Money Flow Index (MFI)
- Relative Strength Index (RSI)
- Stochastic RSI
- Time Segmented Volume (TSV)
- Cumulative Delta Volume (CDV)
Note : this list of available oscillators may be added to or altered at a later date.
The indicator includes the following features:
- Ability to select any of the above oscillators
- Optional divergence lines drawn directly onto the oscillator in realtime .
- Configurable alerts to notify you when divergences occur.
- Configurable pivot lookback periods to fine tune the divergences drawn in order to suit different trading styles and timeframes, including the ability to enable automatic adjustment of pivot period per chart timeframe.
- Background colouring option to indicate when the selected oscillator has crossed above or below its centerline.
- Alternate timeframe feature allows you to configure the oscillator to use data from a different timeframe than the chart it is loaded on.
- Oscillator name label, so you can clearly see which oscillator is selected, in the case you have multiple loaded onto a chart.
- Optional adjustable range bands.
- Automatic adjustment of line colours, centerlines and range band levels on a per oscillator basis by default.
- Ability to customise the colours of each of the oscillators.
What is the Ultimate Oscillator ( UO )?
“The Ultimate Oscillator indicator (UO) indicator is a technical analysis tool used to measure momentum across three varying timeframes. The problem with many momentum oscillators is that after a rapid advance or decline in price, they can form false divergence trading signals. For example, after a rapid rise in price, a bearish divergence signal may present itself, however price continues to rise. The ultimate Oscillator attempts to correct this by using multiple timeframes in its calculation as opposed to just one timeframe which is what is used in most other momentum oscillators.”
What is the True Strength Index ( TSI )?
"The true strength index (TSI) is a technical momentum oscillator used to identify trends and reversals. The indicator may be useful for determining overbought and oversold conditions, indicating potential trend direction changes via centerline or signal line crossovers, and warning of trend weakness through divergence."
What is the Money Flow Index ( MFI )?
“The Money Flow Index ( MFI ) is a technical oscillator that uses price and volume data for identifying overbought or oversold signals in an asset. It can also be used to spot divergences which warn of a trend change in price. The oscillator moves between 0 and 100. Unlike conventional oscillators such as the Relative Strength Index ( RSI ), the Money Flow Index incorporates both price and volume data, as opposed to just price. For this reason, some analysts call MFI the volume-weighted RSI .”
What is the Relative Strength Index ( RSI )?
"The relative strength index (RSI) is a momentum indicator used in technical analysis. RSI measures the speed and magnitude of a security's recent price changes to evaluate overvalued or undervalued conditions in the price of that security. The RSI can do more than point to overbought and oversold securities. It can also indicate securities that may be primed for a trend reversal or corrective pullback in price. It can signal when to buy and sell. Traditionally, an RSI reading of 70 or above indicates an overbought situation. A reading of 30 or below indicates an oversold condition. It is also commonly used to identify divergences."
What is the Stochastic RSI (StochRSI)?
"The Stochastic RSI (StochRSI) is an indicator used in technical analysis that ranges between zero and one (or zero and 100 on some charting platforms) and is created by applying the Stochastic oscillator formula to a set of relative strength index (RSI) values rather than to standard price data. Using RSI values within the Stochastic formula gives traders an idea of whether the current RSI value is overbought or oversold. The StochRSI oscillator was developed to take advantage of both momentum indicators in order to create a more sensitive indicator that is attuned to a specific security's historical performance rather than a generalized analysis of price change."
What Is Time Segmented Volume?
"Time segmented volume (TSV) is a technical analysis indicator developed by Worden Brothers Inc. that segments a stock's price and volume according to specific time intervals. The price and volume data is then compared to uncover periods of accumulation (buying) and distribution (selling)."
What is Cumulative Volume Delta ( CDV )?
"The CDV analyses the net buying at market price and net selling at market price. This means, that volume delta is measuring whether it is the buyers or sellers that are more aggressive in taking the current market price. It measures the degree of intent by buyers and sellers, which can be used to indicate who is more dominant. The CDV can be used to help identify possible trends and also divergences"
What are divergences?
Divergence is when the price of an asset is moving in the opposite direction of a technical indicator, such as an oscillator, or is moving contrary to other data. Divergence warns that the current price trend may be weakening, and in some cases may lead to the price changing direction.
There are 4 main types of divergence, which are split into 2 categories;
regular divergences and hidden divergences. Regular divergences indicate possible trend reversals, and hidden divergences indicate possible trend continuation.
Regular bullish divergence: An indication of a potential trend reversal, from the current downtrend, to an uptrend.
Regular bearish divergence: An indication of a potential trend reversal, from the current uptrend, to a downtrend.
Hidden bullish divergence: An indication of a potential uptrend continuation.
Hidden bearish divergence: An indication of a potential downtrend continuation.
Setting alerts.
With this indicator you can set alerts to notify you when any/all of the above types of divergences occur, on any chart timeframe you choose.
Configurable pivot periods.
You can adjust the default pivot periods to suit your prefered trading style and timeframe. If you like to trade a shorter time frame, lowering the default lookback values will make the divergences drawn more sensitive to short term price action.
How do traders use divergences in their trading?
A divergence is considered a leading indicator in technical analysis , meaning it has the ability to indicate a potential price move in the short term future.
Hidden bullish and hidden bearish divergences, which indicate a potential continuation of the current trend are sometimes considered a good place for traders to begin, since trend continuation occurs more frequently than reversals, or trend changes.
When trading regular bullish divergences and regular bearish divergences, which are indications of a trend reversal, the probability of it doing so may increase when these occur at a strong support or resistance level . A common mistake new traders make is to get into a regular divergence trade too early, assuming it will immediately reverse, but these can continue to form for some time before the trend eventually changes, by using forms of support or resistance as an added confluence, such as when price reaches a moving average, the success rate when trading these patterns may increase.
Typically, traders will manually draw lines across the swing highs and swing lows of both the price chart and the oscillator to see whether they appear to present a divergence, this indicator will draw them for you, quickly and clearly, and can notify you when they occur.
Disclaimer : This script includes code from several stock indicators by Tradingview as well as the Divergence for Many Indicators v4 by LonesomeTheBlue. With special thanks.

1M XAU Cumulative Delta Volume with OB Breakouts
### Overview
This is a **session-based CVD strategy** built around the **00:00–07:00 CEST range**. It finds the high/low of that session, turns them into **adaptive ATR-based support (yellow)** and **resistance (purple)** zones, and trades only **CVD-confirmed reversals** off those levels.
---
### How it Works
* For each day, the script:
* Builds a 00:00–07:00 CEST **profile high/low**.
* Creates a **support zone** around the session low and a **resistance zone** around the session high.
* Using lower timeframe data, it reconstructs **Cumulative Volume Delta (CVD)** and a **recent delta** filter.
* It arms “pending” states when price **enters a zone from the correct side**, then confirms:
* **BUY (long):** price reclaims above support and recent CVD is strongly positive.
* **SELL (short):** price rejects below resistance and recent CVD is strongly negative.
Only these two CVD signals (`buySignal` / `sellSignal`) open trades.
---
### Strategy Logic
* **Entries**
* `buySignal` → open **long** (if flat).
* `sellSignal` → open **short** (if flat).
* No pyramiding; one position at a time.
* **Exits (only TP & SL)**
* Long: TP at `avg_price * (0.5 + TP%)`, SL at `avg_price * (1 – SL%)`.
* Short: TP at `avg_price * (0.5 – TP%)`, SL at `avg_price * (1 + SL%)`.
* No opposite-signal exits.
---
### Extras
* **Reversal markers** on yellow/purple zones and **breakout/retest markers** are plotted for context and alerts but **do not trigger entries**.
* Zone width and “thickening” are ATR-based so important touches and near-touches are easy to see.
* Only suited for **1m intraday scalping** (e.g. XAU/USD), but can be tested on other markets/timeframes.
