Market CycleMarket Cycle Indicator
This indicator identifies the four classic market cycle phases — Accumulation, Markup, Distribution, and Markdown — using a combination of trend, momentum, and volatility signals. It helps traders quickly understand the current market context and avoid trading against major structural shifts.
How It Works
The algorithm evaluates multiple conditions:
• Trend direction based on EMA Fast vs EMA Slow
• Momentum strength using MACD histogram and its slope
• Overbought / oversold zones with RSI
• Trend strength / weakness via ADX (DMI)
Each bar is classified into one of the following phases:
• Accumulation: Low trend strength, rising momentum, mid-range RSI
• Markup: Strong uptrend with rising positive momentum
• Distribution: Weakening momentum after an uptrend, high RSI
• Markdown: Strong downtrend with falling momentum and low RSI
The indicator highlights the active phase using background color and displays a real-time label on the chart.
Main Features
• Automatic detection of 4 market cycle phases
• Background color shading for easy visualization
• Real-time label showing the current phase
• Optional alerts for each phase change
• Clean and optimized code (Pine Script v5)
Recommended Use
Use this indicator to:
• Identify the broader market context
• Avoid entering during distribution or late markup zones
• Time entries better during accumulation or early markup
• Combine with price action, volume, and support/resistance for best results
Note:
This is not a buy/sell signal generator. It provides context, not predictions. Always manage risk appropriately.
在腳本中搜尋"Cycle"

Thiru Macro Time Cycles🕐 Thiru Macro Time Cycles - Advanced Multi-Session Trading Indicator
═══════════════════════════════════════════
📋 WHAT IT DOES:
Thiru Macro Time Cycles is a professional-grade trading indicator that automatically identifies and visualizes 10 critical macro trading sessions throughout the trading day. This indicator helps traders identify optimal entry windows during high-probability market periods across London and New York sessions.
The indicator displays horizontal lines and labels marking specific 30-minute time windows that are known for significant price movements and institutional trading activity. Perfect for traders who follow ICT (Inner Circle Trader) methodologies, session trading strategies, and time-based market analysis.
═══════════════════════════════════════════
✨ KEY FEATURES:
🕐 MULTI-SESSION COVERAGE
10 Distinct Macro Sessions:
- London Sessions: 2 sessions (2:45-3:15 AM & 3:45-4:15 AM EST)
- NY AM Sessions: 4 sessions (7:45-8:15 AM, 8:45-9:15 AM, 9:45-10:15 AM, 10:45-11:15 AM EST)
- NY PM Sessions: 4 sessions (11:45-12:15 PM, 12:45-1:15 PM, 1:45-2:15 PM, 2:45-3:15 PM EST)
• Each session is a precise 30-minute window optimized for institutional activity
🎨 FULLY CUSTOMIZABLE VISUALS
• Individual Color Control: Set unique colors for each of the 10 sessions
• Plain Text Labels: Clean labels without background boxes for better visibility
• Label Customization: Show/hide labels, adjust text alignment (Left/Center/Right), size (Tiny to Huge)
• Line Customization: Adjustable width (1-10px), style (Solid/Dotted/Dashed), transparency
• Professional Color Coding: Different colors for London vs NY sessions
• Clean Visual Design: Horizontal lines with optional plain text labels
⏰ INTELLIGENT TIME MANAGEMENT
• Days to Show: Control how many days of sessions to display (1-30 days, default: 5)
• Weekend Filtering: Option to skip Saturday and Sunday for cleaner weekly view
• Automatic Cleanup: Smart memory management prevents chart clutter
• Timezone Aware: Uses Eastern Time (EST/EDT) with automatic DST handling
• Historical Tracking: View past sessions for pattern analysis
📊 SESSION CONTROL SYSTEM
• Individual Session Control: Enable/disable each of the 10 sessions independently
• Session Group Toggles: Show/hide all London, NY AM, or NY PM sessions at once
• London Sessions: Marked as "LO 1" and "LO 2"
• NY AM Sessions: Marked as "AM 1", "AM 2", "AM 3", "AM 4"
• NY PM Sessions: Marked as "PM 1", "PM 2", "PM 3", "PM 4"
• Clear Label System: Easy to identify which session you're viewing
═══════════════════════════════════════════
🚀 HOW TO USE:
BASIC SETUP:
1️⃣ Add the indicator to your chart
2️⃣ The indicator will automatically display sessions for the current and past days
3️⃣ Sessions appear as horizontal lines at the bottom of the indicator pane
4️⃣ Labels show session names (LO 1, LO 2, AM 1-4, PM 1-4)
CUSTOMIZATION:
1️⃣ Open Settings (gear icon)
2️⃣ Adjust "Days to Show" to control historical display (1-30 days recommended)
3️⃣ Enable/disable individual sessions or entire session groups
4️⃣ Toggle "Show Labels" on/off based on your preference
5️⃣ Choose "Text Alignment" (Left/Center/Right) and label size
6️⃣ Customize line width, style, and transparency
7️⃣ Customize colors for each session in the "Colors" section
8️⃣ Enable "Skip Weekends" for cleaner weekly view
FOR SESSION TRADING:
• Monitor the horizontal lines to identify active macro sessions
• Watch for price reactions during these specific 30-minute windows
• Use session labels to quickly identify which macro period is active
• Track multiple days to see session patterns and consistency
FOR ICT/SMC TRADERS:
• London sessions (LO 1, LO 2) align with London Killzone periods
• NY AM sessions (AM 1-4) cover the New York morning session
• NY PM sessions (PM 1-4) cover the New York afternoon session
• Use these windows for optimal entry timing in your trading setups
FOR MULTI-TIMEFRAME ANALYSIS:
• Works on all timeframes (optimized for 15m, 30m, 1h, 4h)
• Adjust "Days to Show" based on your timeframe:
- Lower timeframes (15m, 30m): 3-5 days
- Higher timeframes (4h, Daily): 5-10 days
═══════════════════════════════════════════
⚙️ SETTINGS OVERVIEW:
📌 DISPLAY SETTINGS:
• Days to Show: Number of days to display (default: 5, range: 1-30)
• Skip Weekends: Toggle to skip Saturday and Sunday (default: ON)
• Line Y Position: Adjust vertical position of lines (-1.0 to 1.0)
📌 SESSION GROUPS:
• Show London Sessions: Toggle all London sessions on/off
• Show NY AM Sessions: Toggle all NY AM sessions on/off
• Show NY PM Sessions: Toggle all NY PM sessions on/off
📌 INDIVIDUAL SESSIONS:
• Enable/disable each of the 10 sessions independently
📌 LABEL SETTINGS:
• Show Labels: Toggle labels on/off (default: ON)
• Text Alignment: Left, Center, or Right positioning
• Label Size: Tiny, Small, Normal, Large, or Huge (default: Small)
• Label Y Position: Adjust vertical position (-1.0 to 1.0)
• Label Text Color: Customize text color
📌 LINE APPEARANCE:
• Line Width: 1-10 pixels (default: 7)
• Line Style: Solid, Dotted, or Dashed
• Line Transparency: 0-100% (default: 0 = fully opaque)
🎨 COLORS:
• London Macro 1 Line Color (2:45-3:15 AM): Default Blue
• London Macro 2 Line Color (3:45-4:15 AM): Default Blue
• NYAM Macro 1 Line Color (7:45-8:15 AM): Default Orange
• NYAM Macro 2 Line Color (8:45-9:15 AM): Default Orange
• NYAM Macro 3 Line Color (9:45-10:15 AM): Default Blue
• NYAM Macro 4 Line Color (10:45-11:15 AM): Default Blue
• NYPM Macro 1 Line Color (11:45-12:15 PM): Default Orange
• NYPM Macro 2 Line Color (12:45-1:15 PM): Default Orange
• NYPM Macro 3 Line Color (1:45-2:15 PM): Default Blue
• NYPM Macro 4 Line Color (2:45-3:15 PM): Default Blue
═══════════════════════════════════════════
💡 TIPS & BEST PRACTICES:
✅ RECOMMENDED SETTINGS:
• Days to Show: 5 days (good balance of history and clarity)
• Show Labels: ON (helps identify sessions quickly)
• Text Alignment: Center (best visibility)
✅ TRADING STRATEGIES:
• Combine with price action analysis during macro sessions
• Watch for breakouts or reversals at session boundaries
• Use in conjunction with other ICT/SMC indicators
• Track which sessions show highest volatility for your instrument
✅ CHART SETUP:
• Works best on clean charts (minimal other indicators)
• Recommended instruments: Forex pairs, indices, futures
• Optimal timeframes: 15m, 30m, 1h for intraday trading
• Can be used on 4h/Daily for swing trading context
✅ PERFORMANCE OPTIMIZATION:
• Reduce "Days to Show" if chart becomes cluttered
• Turn off labels if you prefer cleaner visual
• Use consistent colors to build visual memory
• Adjust based on your trading style and preferences
═══════════════════════════════════════════
📈 SESSION TIMES (Eastern Time):
🌍 LONDON SESSIONS:
• LO 1: 2:45 AM - 3:15 AM EST
• LO 2: 3:45 AM - 4:15 AM EST
🇺🇸 NEW YORK AM SESSIONS:
• AM 1: 7:45 AM - 8:15 AM EST
• AM 2: 8:45 AM - 9:15 AM EST
• AM 3: 9:45 AM - 10:15 AM EST
• AM 4: 10:45 AM - 11:15 AM EST
🇺🇸 NEW YORK PM SESSIONS:
• PM 1: 11:45 AM - 12:15 PM EST
• PM 2: 12:45 PM - 1:15 PM EST
• PM 3: 1:45 PM - 2:15 PM EST
• PM 4: 2:45 PM - 3:15 PM EST
═══════════════════════════════════════════
🔧 TECHNICAL DETAILS:
• Pine Script Version: v6
• Indicator Type: Non-overlay (separate pane)
• Timezone: America/New_York (Eastern Time)
• Automatic DST Handling: Yes
• Memory Management: Optimized with automatic cleanup
• Performance: Lightweight and efficient
═══════════════════════════════════════════
🎯 USE CASES:
1️⃣ SESSION TRADING
Identify optimal entry windows during high-probability trading sessions
2️⃣ ICT/SMC METHODOLOGY
Align with Inner Circle Trader and Smart Money Concepts time-based strategies
3️⃣ INSTITUTIONAL TIMING
Track when institutional traders are most active in the market
4️⃣ MULTI-SESSION ANALYSIS
Compare price action across different macro sessions to find patterns
5️⃣ TIME-BASED ENTRIES
Use macro sessions as timing filters for your trading setups
═══════════════════════════════════════════
📝 NOTES:
• All times are in Eastern Time (EST/EDT)
• The indicator automatically handles daylight saving time changes
• Sessions are displayed as horizontal lines in a separate indicator pane
• Works with all instruments: Forex, Stocks, Futures, Crypto
• Compatible with all timeframes, optimized for intraday trading
═══════════════════════════════════════════
👤 AUTHOR & SUPPORT:
Created by: ThiruDinesh
TradingView Profile: @ThiruDinesh
For questions, feedback, or support, please contact through TradingView.
═══════════════════════════════════════════
© 2025 ThiruDinesh - All Rights Reserved
Proprietary Algorithm - Do Not Redistribute
This indicator contains proprietary trading logic and methodology
developed exclusively by ThiruDinesh. Unauthorized copying,
distribution, or reverse engineering is strictly prohibited.
═══════════════════════════════════════════

Previous Cycle Range + SMTs [bilal x shpat]Inspired by ICT (Inner Circle Trader) concepts
Description made by ChatGPT
Thank you shpat.a for making the SMT option
📝 Overview
The Previous Cycle Range + SMTs indicator is a multi-timeframe tool designed to visualize key market structure levels derived from the previous trading cycle’s range — a concept heavily utilized in ICT-style analysis.
In addition to the traditional range levels, this indicator adds Smart Money Tool (SMT) detection, allowing traders to identify bullish or bearish divergences across multiple correlated assets, giving an edge in spotting potential turning points and liquidity imbalances.
It helps traders identify equilibrium levels, liquidity zones, and potential premium/discount areas based on the prior day (or any chosen period) high and low — now with intermarket divergence insights.
⚙️ Features
Custom Cycle Length: Define your own cycle in minutes (e.g., 1440 = 1 day, 10080 = 1 week).
Previous High/Low: Automatically plots the previous cycle’s high and low levels.
Equilibrium (EQ): Optional 50% midpoint line to highlight the market’s equilibrium.
Quarter Levels: Adds 25% and 75% range lines for refined premium/discount analysis.
Extended Ranges: Optional extended levels (e.g., -100%, +200%) to identify continuation or retracement targets.
Fib Levels (1.272 & 1.618): Adds ICT-style Fibonacci extension levels for confluence zones.
Smart Money Tool (SMT) Detection:
Detects bullish or bearish divergences between your main asset and up to two comparison symbols.
Highlights potential SMT zones with optional text labels for quick visualization.
Optional SMT summary table displays divergence status for all three assets.
Custom Styling: Full control over colors, line width, label style, and extension distance.
💡 How It Helps
This indicator aligns with ICT principles by making the previous day’s range visible and actionable, now with SMT divergence insights:
The previous day’s high/low often act as liquidity pools.
The equilibrium (EQ) represents fair value — useful for spotting premium/discount zones.
Quarter levels and Fibonacci extensions add precision when mapping market structure and potential reaction points.
SMT detection helps traders identify early divergence signals that may indicate upcoming bullish or bearish moves across correlated markets.
🔍 Example Uses
Identify where price is trading relative to the previous session’s range.
Use EQ and quarter levels to gauge premium vs. discount conditions.
Spot intermarket divergences using SMTs to anticipate potential reversal or continuation points.
Combine with other ICT-based tools (e.g., PD arrays, dealing ranges, or kill zones) for refined trade setups.

US Macro Cycle (Z-Score Model)US Macro Cycle (Z-Score Model)
This indicator tracks the US economic cycle in real time using a weighted composite of seven macro and market-based indicators, each converted into a rolling Z-score for comparability. The model identifies the current phase of the cycle — Expansion, Peak, Contraction, or Recovery — and suggests sector tilts based on historical performance in each phase.
Core Components:
Yield Curve (10y–2y): Positive & steepening = growth; inverted = slowdown risk.
Credit Spreads (HYG/LQD): Tightening = risk-on; widening = risk-off.
Sector Leadership (Cyclicals vs. Defensives): Measures market leadership regime.
Copper/Gold Ratio: Higher copper = growth signal; higher gold = defensive.
SPY vs. 200-day MA: Equity trend strength.
SPY/IEF Ratio: Stocks vs. bonds relative strength.
VIX (Inverted): Low/falling volatility = supportive; high/rising = risk-off.
Methodology:
Each series is transformed into a rolling Z-score over the selected lookback period (optionally using median/MAD for robustness and winsorization to clip outliers).
Z-scores are combined using user-defined weights and normalized.
The smoothed composite is compared against phase thresholds to classify the macro environment.
Features:
Customizable Weights: Emphasize the indicators most relevant to your strategy.
Adjustable Thresholds: Fine-tune cycle phase definitions.
Background Coloring: Visual cue for the current phase.
Summary Table: Displays composite Z, confidence %, and individual Z-scores.
Alerts: Trigger when the phase changes, with details on the composite score and recommended tilt.
Use Cases:
Align sector rotation or relative strength strategies with the macro backdrop.
Identify favorable or defensive phases for tactical allocation.
Monitor macro turning points to manage portfolio risk.
It's doesn't fill nan gaps so there is quite a bit of zeroes, non-repainting.

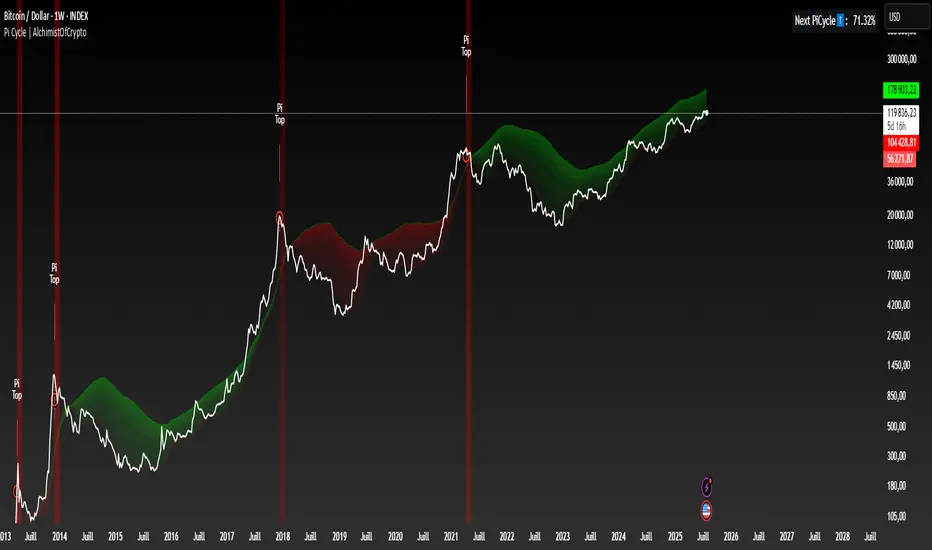
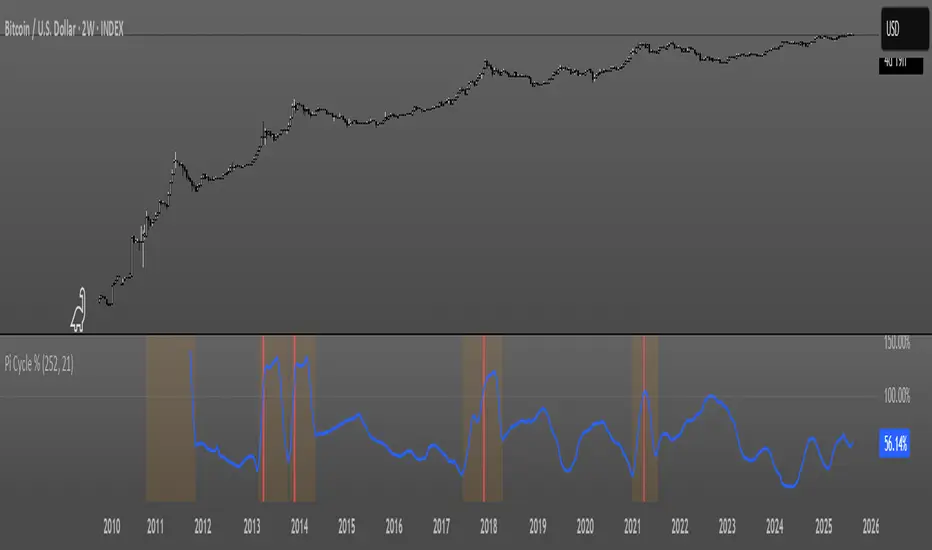
Pi Cycle | AlchimistOfCryptoPi Cycle Top Indicator - A Powerful Market Phase Detector
Developed by AlchimistOfCrypto
🧪 The Pi Cycle uses mathematical harmony to identify Bitcoin market cycle tops
with remarkable precision. Just as elements react at specific temperatures,
Bitcoin price behaves predictably when these two moving averages converge! 🧬
⚗️ The formula measures when the 111-day SMA crosses below the 350-day SMA × 2,
creating a perfect alchemical reaction that has successfully identified the
major cycle tops in 2013, 2017, and 2021.
🔬 Like the Golden Ratio in nature, this indicator reveals the hidden
mathematical structure within Bitcoin's chaotic price movements.
🧮 When the reaction occurs, prepare for molecular breakdown! 🔥
Cycle Composite 3.6 WeightedThe Cycle Composite is a multi-factor market cycle model designed to classify long-term market behavior into distinct phases using normalized and weighted data inputs.
It combines ten key on-chain, dominance, volatility, sentiment, and trend-following metrics into a single composite output. The goal is to provide a clearer understanding of where the market may stand in the broader cycle (e.g., accumulation, early bull, late bull, or euphoria).
This version (3.4) introduces flexible weighting, trend strength markers, and additional context-aware signals such as risk-on confirmations and altseason flags.
Phases Identified:
The model categorizes the market into one of five zones:
Euphoria (> 85)
Late Bull (70 – 85)
Mid Bull (50 – 70)
Early Bull (30 – 50)
Fear (< 30)
Each phase is determined by a smoothed EMA of the weighted composite score.
Data Sources and Metrics Used (10 total):
BTC Dominance (CRYPTOCAP:BTC.D)
Stablecoin Dominance (USDT + USDC average) (inverted for risk-on)
ETH Dominance (CRYPTOCAP:ETH.D)
BBWP (normalized Bollinger Band Width % over 1-year window)
WVF (Williams VIX Fix for volatility spike detection)
NUPL (Net Unrealized Profit/Loss, external source)
CMF (Chaikin Money Flow, smoothed volume accumulation)
CEX Open Interest (custom input from DAO / external source)
Whale Inflows (custom input from whale exchange transfer data)
Google Trends Average (BTC, Crypto, Altcoin terms)
All inputs are normalized over a 200-bar window and combined via weighted averaging, where each weight is user-configurable.
Additional Features:
Phase Labels: Labels are printed only when a new phase is entered.
Bull Continuation Marker: Triangle up when composite makes higher highs and NUPL increases.
Weakening Marker: Triangle down when composite rolls over in Late Bull and NUPL falls.
Risk-On Signal: Green circle appears when CMF and Google Trends are both rising.
Altseason Flag: Orange diamond appears when dominance of "others.d" exceeds BTC.D and ETH.D and composite is above 50.
Background Shading: Each phase is shaded with a semi-transparent background color.
Timeframe-Aware Display: All markers and signals are shown only on weekly timeframe for clarity.
Intended Use:
This script is intended for educational and macro-trend analysis purposes.
It can be used to:
Identify macro cycle position (accumulation, bull phases, euphoria, etc.)
Spot long-term trend continuation or weakening signals
Add context to price action with external on-chain and sentiment data
Time rotation events such as altseason risk
Disclaimer:
This script does not constitute financial advice.
It is intended for informational and research purposes only.
Users should conduct their own due diligence and analysis before making investment decisions.

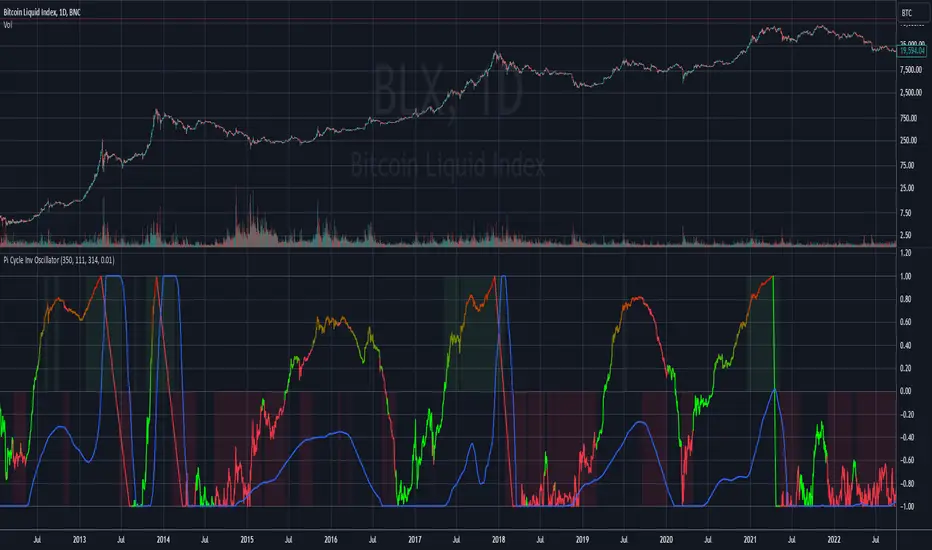
Pi Cycle MACD Inverse OscillatorPi Cycle MACD Inverse Oscillator with Gradient and Days Since Last Top
This indicator is ideal for Bitcoin traders seeking a robust tool to visualize long-term and short-term trends with enhanced clarity and actionable insights.
This script combines the concept of the Pi Cycle indicator with a unique MACD-based inverse oscillator to analyze Bitcoin market trends. It introduces several features to help traders understand market conditions better:
Inverse Oscillator:
- Oscillator ranges between 1 and -1.
- A value of 1 indicates the two moving averages (350 MA and 111 MA) are equal.
- A value of -1 indicates the maximum observed distance between the moving averages during the selected lookback period.
- The oscillator dynamically adjusts to price changes using a configurable scaling factor.
Gradient Visualization:
The oscillator line transitions smoothly from green (closer to -1) to yellow (at 0) and red (closer to 1).
The color gradient provides a quick visual cue for market momentum.
Days Since Last Pi Cycle Top:
Calculates and displays the number of days since the last "Pi Cycle Top" (defined as a crossover between the two moving averages).
The label updates dynamically and appears only on the most recent bar.
Conditional Fill:
Highlights the area between 0 and 1 with a green gradient when the price is above the long moving average.
Enhances visual understanding of the oscillator's position relative to key thresholds.
Inputs:
- Long Moving Average (350 default): Determines the primary trend.
- Short Moving Average (111 default): Measures shorter-term momentum.
- Oscillator Lookback Period (100 default): Defines the range for normalizing the oscillator.
- Price Scaling Factor (0.01 default): Adjusts the normalization to account for large price fluctuations.
How to Use:
- Use the oscillator to identify potential reversal points and trend momentum.
- Look for transitions in the gradient color and the position relative to 0.
- Monitor the "Days Since Last Top" label for insights into the market's cycle timing.
- Utilize the conditional fill to quickly assess when the market is in a favorable position above the long moving average.
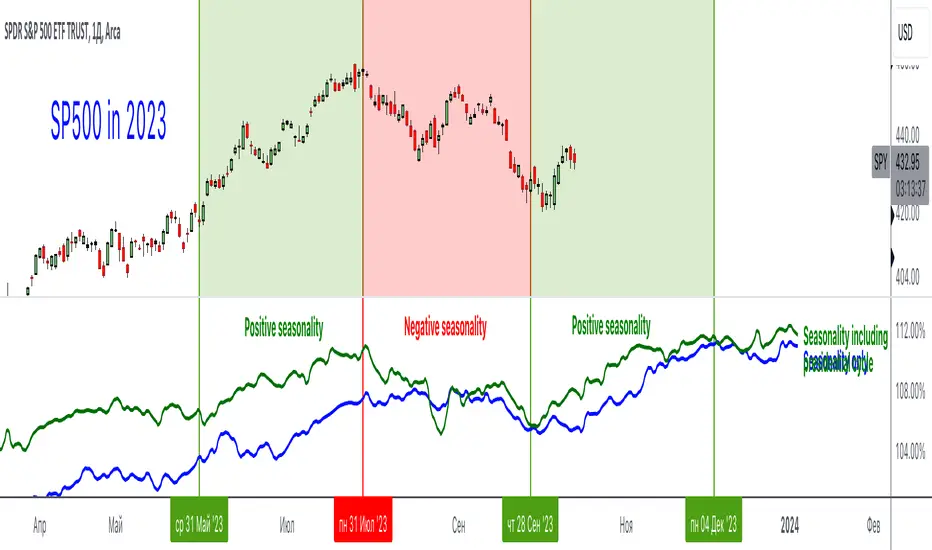
Seasonality and Presidential cycleAn incredibly useful indicator that shows seasonality and presidential cycles by indices, stocks and industries. Just type in a ticker and trade according to seasonal patterns
Blue line - seasonality excluding presidential cycles
Green line - seasonality taking into account presidential cycles
*Seasonal patterns over the last 10 years
This indicator uses the request.seed() function.
Requests data from a GitHub repository maintained by our team and returns it as a series.
Pine Seeds is a service to import custom data and access it via TradingView.
Use TradingView as frontend and use a GitHub repository as backend.
github.com
...
Rus: Невероятно полезный индикатор, который показывает сезонность и президентские циклы по индексам, акциям и отраслям. Просто вбейте тикер и торгуйте согласно сезонным паттернам
Синяя линия - сезонность без учета президентских циклов
Зеленая линия - сезонность с учетом президентских циклов
*Сезонные паттерны за последние 10 лет
Pi Cycle OscillatorThis oscillator combines the Pi Cycle Top indicator with a percentile-based approach to create a more precise and easy to read market timing tool.
Instead of waiting for moving average crossovers, it shows you exactly how close you are to a potential market top.
Orange background means you should start preparing for a potential top and look into taking profits.
Red background means that the crossover has happened on the original Pi Cycle Indicator and that you should have already sold everything. (Crossover of the gray line aka 100)
Thank you
Bollinger Band Width Percentile - The_Caretaker
Pi Cycle Top - megasyl20
Benner Cycle + Auto Weekly FibonacciBenner Cycle Wave
A sinusoidal wave modeled after the historic Benner Cycle theory, which suggests regular economic and market turning points.
- Auto-adjusts based on chart time
- Displays BUY/SELL signal markers at cycle peaks and troughs
Fibonacci Retracement Levels
Automatically draws key Fibonacci levels (0% to 100%) using the daily high and low, helping you spot potential reversal or continuation zones.
- Fully dynamic: updates at the start of each week
- Great for intraday and swing traders looking to time pullbacks or breakouts
Why use both?
The Benner wave highlights when markets may shift. The Fibonacci levels show where price could react. Together, they give you time + price confluence — a powerful edge in trade planning.

Weierstrass Function (Fractal Cycles)THE WEIERSTRASS FUNCTION
f(x) = ∑(n=0)^∞ a^n * cos(b^n * π * x)
The Weierstrass Function is the sum of an infinite series of cosine functions, each with increasing frequency and decreasing amplitude. This creates powerful multi-scale oscillations within the range ⬍(-2;+2), resembling a system of self-repetitive patterns. You can zoom into any part of the output and observe similar proportions, mimicking the hidden order behind the irregularity and unpredictability of financial markets.
IT DOESN’T RELY ON ANY MARKET DATA, AS THE OUTPUT IS BASED PURELY ON A MATHEMATICAL FORMULA!
This script does not provide direct buy or sell signals and should be used as a tool for analyzing the market behavior through fractal geometry. The function is often used to model complex, chaotic systems, including natural phenomena and financial markets.
APPLICATIONS:
Timing Aspect: Identifies the phases of market cycles, helping to keep awareness of frequency of turning points
Price-Modeling features: The Amplitude, frequency, and scaling settings allow the indicator to simulate the trends and oscillations. Its nowhere-differentiable nature aligns with the market's inherent uncertainty. The fractured oscillations resemble sharp jumps, noise, and dips found in volatile markets.
SETTINGS
Amplitude Factor (a): Controls the size of each wave. A higher value makes the waves larger.
Frequency Factor (b): Determines how fast the waves oscillate. A higher value creates more frequent waves.
Ability to Invert the output: Just like any cosine function it starts its journey with a decline, which is not distinctive to the behavior of most assets. The default setting is in "inverted mode".
Scale Factor: Adjusts the speed at which the oscillations grow over time.
Number of Terms (n_terms): Increases the number of waves. More terms add complexity to the pattern.

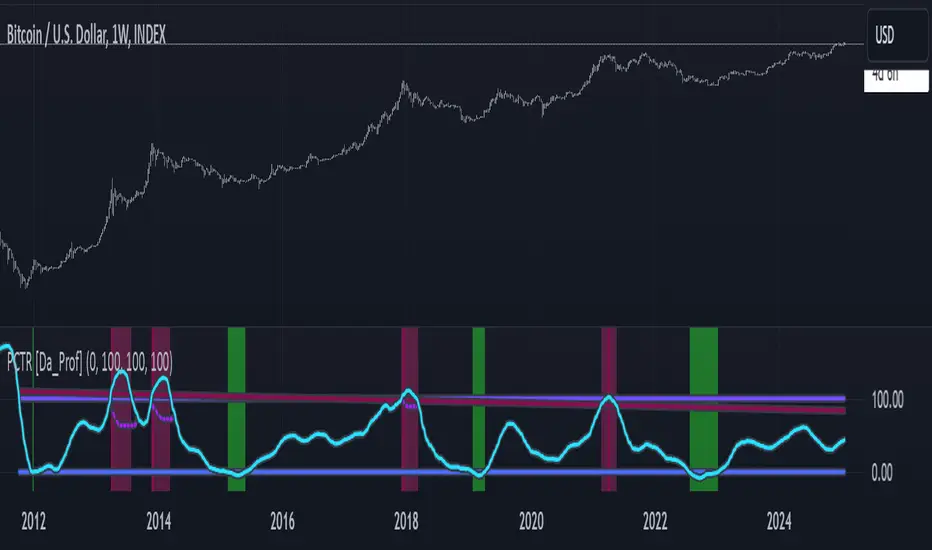
PCTR - Pi Cycle Top Risk [Logue]Pi-cycle Top Risk (PCTR) - The PCTR indicator uses divergence of the Pi-cycle top indicator display the risk that a macro top in Bitcoin (BTC) is near. The Pi-cycle top indicator is simply the cross of the 111-day moving average above a 2x multiple of the 350-day moving average of the BTC price. While there is no fundamental reasoning behind why this works, it has worked to indicate previous bitcoin tops by taking advantage of the cyclicality of the BTC price and measurement overextension of BTC price. This indicator triggers a top signal when the fast moving average (111-day) crosses above the 2x multiple of the slow moving average (350-day).
What's interesting is the indicator can also signal a bottom when the divergence of the fast moving average is at an extreme versus the slow moving average. The indicator signals a bottom when the fast MA is 66% away from the slow MA value.
Both the top and bottom signals are clearly shown on the chart on a scale from 100 to 0.
Sentimental Cycles with CrossingsThis indicator provides the following options, where you can choose to display:
DEMA TEMA cycles, filtered by default with sentiment.
Sentiment cloud, based on the 200ema area between the 1 minute and 1 hour lines.
One or both ema crossings with their respective timeframes (independent from current chart timeframe) and optional line display.
One or two tickers and their respective crossings based on selected timeframes.
Additional EMA lines supplied with their very own timeframe.
This indicator is intended to be used any way suitable to the user, nearly every aspect is customizable, and the defaults are just enough to get you started on deciding whether it's time to enter calls or puts.
TIPS for optimal results:
- Try using 2 charts: the 1 minute and the 1 hour per symbol. Under the 1 minute chart, use the 3 minute and 5 minute timeframe for crossings.
- Try to start a position when a sentimental DEMA TEMA cloud is beginning to form. The first bar usually pays thicc.
- Tickers SPY and VXX can be of good reference for market direction. If all crossings coincide, it's because there's a strong momentum in a certain direction for the market.

Cosmic Pi CycleAn adaptation of the Pi Cycle type indicator that
uses more accurate "pi" moving average periods
allows to adjust the numerator mult
shows cycle bottoms
shows a basis line
can be layered like in the example to create a Pi Cycle Channel

Market Cycle & Scalping entry / exitCycle indicator is an oscillator commonly used to identify market trends and provide buy and sell signals to traders. The Cyle indicator is based on the assumption that currency trends accelerate and decelerate in cyclical patterns that may reflect the dominant price cycle of any stock, during any time frame. It works best on a 1 min chart for quick scalp plays.

BTC Flow Dashboard : Spot Premium + OI + Funding + Cycle SignalsSpot Premium vs Perpetual Basket (%):
Tracks how aggressively perps are trading relative to spot, a leading indicator of speculative activity and leverage buildup.
Aggregated Open Interest Z-Score:
A normalized view of OI expansion/contraction across major exchanges (Binance, BitMEX, Bybit, Kraken, etc.), highlighting when leverage enters overheated zones.
Composite Funding Rate Analysis:
Calculates a TWAP-smoothed funding composite across major venues, with optional APR scaling, showing where perpetual markets are paying for long or short exposure.
Confluence Signal Engine:
Dynamically flags bullish or bearish market conditions based on premium behavior and leverage environment — including over-leverage warnings that often precede volatility spikes.
Extreme Cycle Tops & Bottoms (Experimental):
Optional signal module that highlights historically significant extremes (e.g., 2020 bottom or 2021 top) based on statistical Z-score thresholds across the three core metrics.
Notes & Tips
Works best on weekly or monthly timeframes for macro cycle analysis.
Daily and 3D views provide short-term leverage context but may produce more frequent signals.
The Extreme Signal Engine is experimental — not a trading signal on its own, but a contextual tool to support macro decision-making.

Pi Cycle Top Indicator - mychaelgoPlots the original Pi Cycle Top moving averages and marks bars where the 111DMA is rising and crosses above the 350DMA×2, often coinciding with Bitcoin cycle peaks. Includes a label with the signal price.

Blockchain Fundamentals: Liquidity Cycle MomentumLiquidity Cycle Momentum Indicator
Overview:
This indicator analyzes global liquidity trends by calculating a unique Liquidity Index and measuring its year-over-year (YoY) percentage change. It then applies a momentum oscillator to the YoY change, providing insights into the cyclical momentum of liquidity. The indicator incorporates a limited historical data workaround to ensure accurate calculations even when the chart’s history is short.
Features Breakdown:
1. Limited Historical Data Workaround
Function: The limit(length) function adjusts the lookback period when there isn’t enough historical data (i.e., near the beginning of the chart), ensuring that calculations do not break due to insufficient data.
2. Global Liquidity Calculation
Data Sources:
TVC:CN10Y (10-year yield from China)
TVC:DXY (US Dollar Index)
ECONOMICS:USCBBS (US Central Bank Balance Sheet)
FRED:JPNASSETS (Japanese assets)
ECONOMICS:CNCBBS (Chinese Central Bank Balance Sheet)
FRED:ECBASSETSW (ECB assets)
Calculation Methodology:
A ratio is computed (cn10y / dxy) to adjust for currency influences.
The Liquidity Index is then derived by multiplying this ratio with the sum of the other liquidity components.
3. Year-over-Year (YoY) Percent Change
Computation:
The indicator determines the number of bars that approximately represent one year.
It then compares the current Liquidity Index to its value one year ago, calculating the YoY percentage change.
4. Momentum Oscillator on YoY Change
Oscillator Components:
1. Calculated using the Chande Momentum Oscillator (CMO) applied to the YoY percent change with a user-defined momentum length.
2. A weighted moving average (WMA) that smooths the momentum signal.
3. Overbought and Oversold zones
Signal Generation:
Buy Signal: Triggered when the momentum crosses upward from an oversold condition, suggesting a potential upward shift in liquidity momentum.
Sell Signal: Triggered when crosses below an overbought condition, indicating potential downward momentum.
State Management:
The indicator maintains a state variable to avoid repeated signals, ensuring that a new buy or sell signal is only generated when there’s a clear change in momentum.
5. Visual Presentation and Alerts
Plots:
The oscillator value and signalline are plotted for visual analysis.
Overbought and oversold levels are marked with dashed horizontal lines.
Signal Markers:
Buy and sell signals are marked with green and maroon circles, respectively.
Background Coloration:
Optionally, the chart’s background bars are colored (yellow for buy signals and fuchsia for sell signals) to enhance visual cues when signals are triggered.
Conclusion
In summary, the Liquidity Cycle Momentum Indicator provides a robust framework to analyze liquidity trends by combining global liquidity data, YoY changes, and momentum oscillation. This makes it an effective tool for traders and analysts looking to identify cyclical shifts in liquidity conditions and potential turning points in the market.

Pi Cycle Indicator Low and High
The Pi Cycle Indicator is a technical analysis tool used in finance, particularly within cryptocurrency markets, to identify potential market tops or bottoms. It is based on two moving averages: the 111-day moving average and the 350-day moving average of Bitcoin's price. The indicator suggests that when these two moving averages converge or cross each other, it may signal significant market turning points. The name "Pi Cycle" comes from the mathematical relationship between these two moving averages, roughly equivalent to the mathematical constant Pi (3.14). Traders and analysts use this indicator to gauge potential trend reversals and make informed decisions regarding their trading strategies. However, like any technical analysis tool, it should be used in conjunction with other indicators and fundamental analysis for a comprehensive understanding of market conditions.

30MIN CYCLE█ HOW DOES IT WORK?
The known 90 min cycle is used as one killzone. But actually all 18 min are relevant to search for a trade. All 18 min when a new box starts only then is the placement of an order valid. If the entry candle isn't in a box then it will probably fail. The boxes should only be used in the M1 or M5 timeframe. The best hitrate is in the M1 timeframe. Included are the last 48 "Mini-Killzones" für intraday trading and backtesting. These "Mini-Killzones" can be used with the "Liquidity Inducement Strategy".
█ WHAT MAKES IT UNIQUE?
This is the first indicator on tradingview that shows all mini-killzones for trading and backtesting a whole tradingday. The well-known killzones of ICT are from 08:00-11:00 and 14:00 - 17:00 (UTC+1) but with this indicator there is finally a refinement of the ICT Smart Money Concept killzones.
█ HOW TO USE IT?
For a proper use of this indicator we suggest to know already at least SMC or better Liquidity Indcuement Trading. This indicator is a further confluence before placing an order. After you made your setup you will have these mini-killzones as a confluence. We don't suggest to open a trade only according to this indicator.
█ ADDITIONAL INFO
This indicator is free to use for all tradingview users.
█ DISCLAIMER
This is not financial advice.

Pi CycleImplementation of Pi Cycle Top and Pi Cycle Bottom with clear visualization
Pi Circle Top is slightly modified to be closer to Pi sma 113 & sma (355) * 2)
Pi Circle Bottom is ISO sma 571 & ema 150
Script will adapt to timeframe but under hourly it might not work due to the high amount of candles to take into account.

[SM] Bitcoin cycles bull market
An indicator to determine the seasonality / cyclicality of bitcoin for long trades.
Application
- For traders: Identification of zones with lower risk of entering long positions
- For swing traders and investors: customizable calendar of entries into long position
Indicator structure
1. Vertical zones (green and red) of time ranges. Only for historical bars. The range width is adjustable in the indicator settings.
2. Table (in the form of a calendar) for determining the time of entering a trade in the future. The table is not editable. It displays the result of the configured zones on the historical bars.
General settings
- choose the color of the Tradingview theme (light or dark)
Table settings
- Turn table display on / off
- Set the number of months to be displayed in the table
Settings of vertical zones (green and red)
Each cycle (1 month summer, 1 month autumn, ...) has four dates
- start date of the green zone (day and month)
- date of the end of the green zone
- start date of the red zone
- date of the end of the red zone

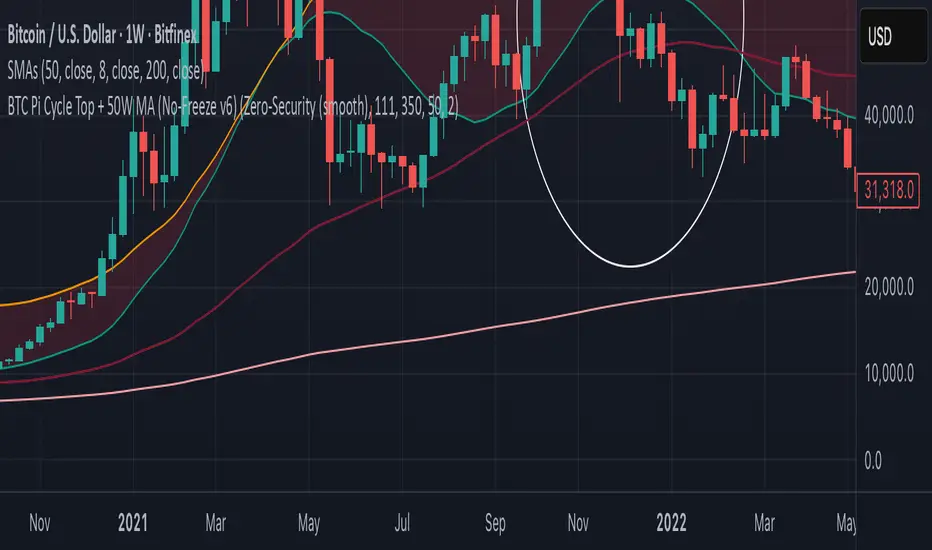
BTC Pi Cycle Top + 50W MA To indicate BTC TOP using pi cycle top + weekly 50 MA
Both overlay in a chart.
by ahmadzombie
19.10.2025