ROC (Rate of Change) Refurbished▮ Introduction
The Rate of Change indicator (ROC) is a momentum oscillator.
It was first introduced in the early 1970s by the American technical analyst Welles Wilder.
It calculates the percentage change in price between periods.
ROC takes the current price and compares it to a price 'n' periods (user defined) ago.
The calculated value is then plotted and fluctuates above and below a Zero Line.
A technical analyst may use ROC for:
- trend identification;
- identifying overbought and oversold conditions.
Even though ROC is an oscillator, it is not bounded to a set range.
The reason for this is that there is no limit to how far a security can advance in price but of course there is a limit to how far it can decline.
If price goes to $0, then it obviously will not decline any further.
Because of this, ROC can sometimes appear to be unbalanced.
(TradingView)
▮ Improvements
The following features were added:
1. Eight moving averages for the indicator;
2. Dynamic Zones;
3. Rules for coloring bars/candles.
▮ Motivation
Averages have been added to improve trend identification.
For finer tuning, you can choose the type of averages.
You can hide them if you don't need them.
The Dynamic Zones has been added to make it easier to identify overbought/oversold regions.
Unlike other oscillators like the RSI for example, the ROC does not have a predetermined range of oscillations.
Therefore, a fixed line that defines an overbought/oversold range becomes unfeasible.
It is in this matter that the Dynamic Zone helps.
It dynamically adjusts as the indicator oscillates.
▮ About Dynamic Zones
'Most indicators use a fixed zone for buy and sell signals.
Here's a concept based on zones that are responsive to the past levels of the indicator.'
The concept of Dynamic Zones was described by Leo Zamansky (Ph.D.) and David Stendahl, in the magazine of Stocks & Commodities V15:7 (306-310).
Basically, a statistical calculation is made to define the extreme levels, delimiting a possible overbought/oversold region.
Given user-defined probabilities, the percentile is calculated using the method of Nearest Rank.
It is calculated by taking the difference between the data point and the number of data points below it, then dividing by the total number of data points in the set.
The result is expressed as a percentage.
This provides a measure of how a particular value compares to other values in a data set, identifying outliers or values that are significantly higher or lower than the rest of the data.
▮ Thanks and Credits
- TradingView: for ROC and Moving Averages
- allanster: for Dynamic Zones
在腳本中搜尋"N+credit最新动态"

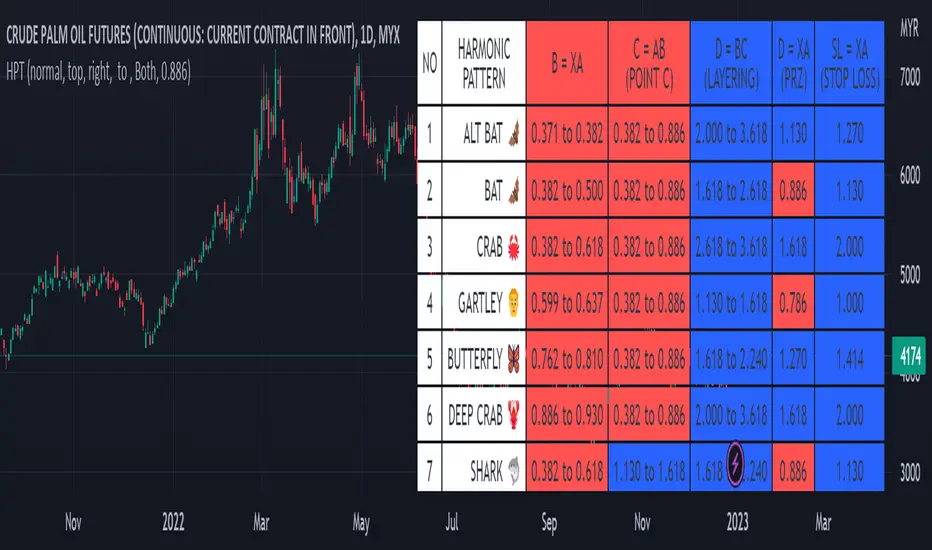
Harmonic Pattern Table UDT█ OVERVIEW
This table indicator was intended as helper / reference for using XABCD Pattern drawing tool.
The values shown in table was based on Harmonic Trading Volume 3: Reaction vs. Reversal written by Scott M Carney.
Code upgrade from Harmonic Pattern Table (Source Code) and based on latest User-Defined Type (UDT) .
As a result, code appeared more cleaner.
█ FEATURES
1. List Harmonic Patterns.
2. Font size small for mobile app and font size normal for desktop.
3. Options to show Animal name in text, emoji or both.
█ USAGE
Similar to Harmonic Pattern Table (Source Code).
█ CREDITS
Scott M Carney, Trading Volume 3: Reaction vs. Reversal
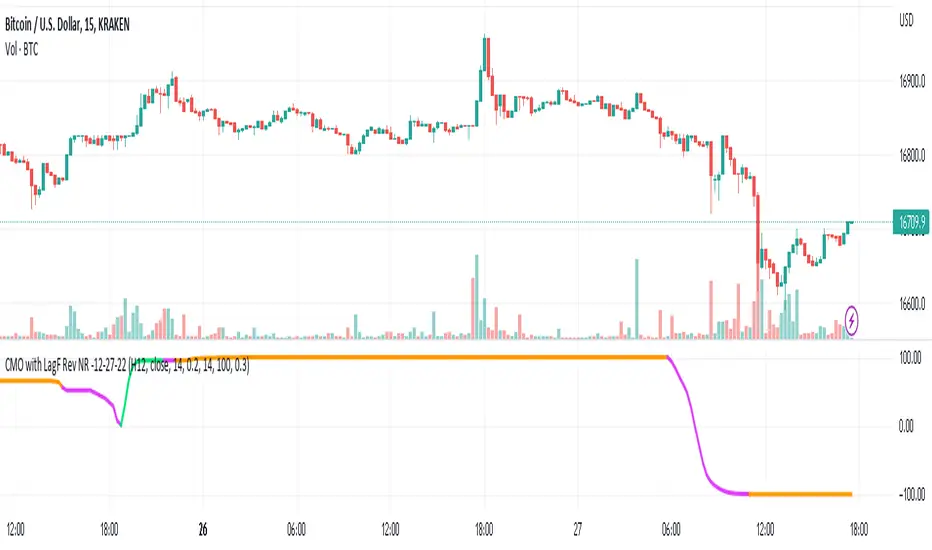
CMO with ATR and LagF Filtering - RevNR - 12-27-22Rev NR of the CMO ATR, with LagF Filtering - Released 12-27-22 by @Hockeydude84
This code takes Chande Momentum Oscillator (CMO), adds a coded ATR option and then filters the result through a Laguerre Filter (LagF) to reduce erroneous signals.
This code also has an option for self adjusting alpha on the Lag, via a lookback table and monitoring the price rate of change (ROC) in the lookback length.
Faster ROC will allow the LagF to move faster, slower price action will slow down LagF reaction. Pausing of signals is also present based on Rate of Change of the LagF Curve
Aggressive signals and Base signaling is allowed - aggressive bases signals on increase/decrease of previous LagF curve value point, Base is greater or less than 0
Original Code credits; Lost some of this due to time and multiple script manipulations, I believe the CMO origin code is from @TradingView House Code, and the LagF from @KıvançÖzbilgiç
CM_Williams_Vix_Fix - Market Top and Bottom with multi-timeframeThis is a modification of CM_Williams_Vix_Fix indicator to include both market tops and bottoms with multi-timeframe support. The original indicator only finds market bottoms.
All credits go to the original author ChrisMoody.
Original script link
Working:
The histogram above 0 signifies the trend of market going UP and the histogram below 0 signifies the trend of market going DOWN.
The histogram bar is calculated using "LookBack Period Standard Deviation High" number of candles. A threshold is calculated using bollinger bands and based on percentile of "Look Back Period Percentile High" number of candles.
If the histogram bar above 0 crosses the up threshold then we have market top which is signified by histogram bar having the color green. If the histogram bar below 0 crosses the down threshold then we have market bottom which is signified by histogram bar having the color red.
The market tops and bottoms can also be calculated across multiple timeframes.
Sample usage:
Suppose the market is in an uptrend and the indicator displays red market bottom bar, this might be an indication that the market has reached the end of a pullback. We can use additional indicators like stochastic or rsi to get additional confluence.
This indicator does not repaint but you need to wait for the candle to close.

MAGIC MACDMAGIC MACD ( MACD Indicator with Trend Filter and EMA Crossover confirmation and Momentum). This MACD uses Default Trading view MACD
from Technical indicators library and adding a second MACD along with 3 EMA's to detect Trend and confirm MACD Signal.
Eliminates usage of 3different indicators (Default MACD , MACD-2,EMA5, EMA20, EMA50)
Basic IDEA.
Idea is to filter Histogram when price is above or below 50EMA. Similar to QQE -mod oscillator but Has a EMA Filter
1.Take DEFAULT MACD crossover signals with lower period
2.check with a Higher MACD Histogram.
3.Enter upon EMA crossover signal and Histogram confirmation.
Histogram changes to GRAY when price is below EMA 50 or above EMA 50 (Follows Trend)
4.Exit on next Default MACD crossover signal.
Overview :
Moving Average Convergence Divergence Indicator Popularly Known as MACD is widely used. MACD Usually generates a lots of False signals
and noise in Lower Time Frames, making it difficult to enter a trade in sideways market. Divergence is a major issue along with sideways
movement and tangling of MACD and Signal Lines. There is no way to confirm a Default MACD signal, except to switch time frames and
verify.
Magic MACD Can be used to in combination with other signals.
This MACD uses two MACD Signals to verify the signal given by Default MACD . The Histogram Plot shown is of a higher period
MACD (close,5,50,30) values. When a signal is generated on a lower MACD it is verified by the histogram with higher time period.
Technicals Used:
1. Lower MACD-1 values 12,26 and signal-9 (crossover Signals)
2. Higher MACD-2 values 5,50 and signal-30 (Histogram)
3. EMA 50 (Histogram Filter to allow only if price above or below Ema 50)
4. EMA 5 and EMA 20 for crossover confirmation of trend
What's is in this Indicator?
1.Histogram-(higher period 5,50 and 30signal)
2. MACD crossover Signals-(lower period Default MACD setting)
3.Signal Lines-( EMA 5 & 20)
Implemented & Removed in this Indicator
1. Default MACD and Signal Lines are removed completely
2. MACD crossover are taken on lower periods and plotted as signals(Blue Triangle or Red Triangle)
3. Histogram is plotted from a higher Period providing a clear picture with Higher Time period
4. EMA 5 and EMA 20 are used for MACD signal confirmation
How to use?
Up Signal
1. MACD Default (12,26,30) up signals are shown in Blue
2. Wait till the Histogram changes Blue
3. Look for EMA signals crossover near by
Down Signal
1. MACD Default (12,26,30) up signals are shown in Red
2. Wait till the Histogram changes Red
3. Look for EMA signals crossover near by
Do's
Consider only opposite color as signals
1. Red Triangle on Blue Histogram(likely to move down direction)
2. Blue Triangle on Red Histogram (Likely to move up direction)
Don'ts
1.Ignore Blue Signal on Blue Histogram (pull back signals can be used to enter trade if you miss first crossover)
2.Ignore Red Signal on Red Histogram(pull back signals can be used to enter trade if you miss first crossover)
3.Ignore Up and Down signals till Gray or Blacked out area is finished in Histogram
Tips:
1. EMA plot also shows pull back areas along with signals
2.side by side opposite signals shows sides ways movement
3. EMA 5,20 is plotted on MACD Histogram for Additional Benefit
Thanks & Credits
To Tradingview Team for allowing me to use their default MACD version and coding it in to a MAGIC MACD by adding a few lines of code that
makes it more enhanced.
Warning...!
This is purely for Educational purpose only. Not to be used as a stand alone indicator. Usage is at your own Risk. Please get familiar with its working before implementing. Its not a Financial Advice or Suggestion . Any losses or gains is at your own risk.

WelcomeUDT█ OVERVIEW
This is a simplest example of user-defined types (UDT) or objects , which simplify as alternative to hello world.
█ CREDITS
Tradingview
█ USAGE
These are the types used during initializations, commonly variables.
export type Settings
int bar
float price
string phrase
...
Example of library function to print out label.
export printLabel(Settings setup) =>
if setup.variable
var label lab = na
label.delete(lab)
lab := label.new(setup.bar, setup.price, setup.phrase, color = setup.bg)
else
label.new(setup.bar, setup.price, setup.phrase, color = setup.bg)
Usage of types
Settings setup = Settings.new(bar_index , priceInput, phraseInput, colorInput, variableInput)
Alternative way to write types
Settings setup = Settings.new(
bar = bar_index ,
price = priceInput,
phrase = phraseInput,
variable = variableInput)
Usage of types into custom function / library function.
printLabel(setup)
printLabel(Settings)
Print out label
Parameters:
Settings : types
Returns: Label object
Settings
Initialize type values
Fields:
bar : X position for label
price : Y position for label
phrase : Text for label
bg : Color for label
variable : Boolean for enable new line and delete line

Simple OHLC Custom Range Interactive█ OVERVIEW
This indicator show lines of OHLC which can be commonly used as support and resistance zones.
OHLC can be shown table with candlestick visual.
Color of candlestick depends on direction of bullish / bearish of the chosen candlestick.
█ INSPIRATION
Inspired by design, code and usage of CAGR . Basic usage of custom range / interactive, pretty much explained here . Credits to TradingView .
█ FEATURES
Table can positioned by any position and font size can be resized.
OHLC can be in full or simple name.
Lines can be extend either right, left, both or none.
█ HOW TO USE
Only 1 point is required.
Dont worry about magnet, point will attached depends on High or Low of the candle.
█ USAGE / TIPS EXAMPLES (Description explained in each image)

Chandelier Exit ZLSMA StrategyIntroduction
Heyo guys, I recently checked out some eye-catching trading strategy videos on YT and found one to test.
This indicator is based on the video.
Usage
The recommended timeframe is 5 min.
Signals
Long Entry => L Label
Price crosses above ZLSMA and Chandelier Exit shows Buy
Long Exit => green circle
Price crosses below ZLSMA
Short Entry => S Label
Price crosses below ZLSMA and Chandelier Exit shows Sell
Short Exit => orange circle
Prices crosses above ZLSMA
Ty for checking this out. Enjoy!
--
Credits to
@netweaver2011 - ZLSMA
@everget – Chandelier Exit

Adaptive Fisherized KSTIntroduction
Heyo guys, here is a new adaptive fisherized indicator of me.
I applied Inverse Fisher Transform, Ehlers dominant cycle analysis,
smoothing and divergence analysis on the Know Sure Thing (KST) indicator.
Moreover, the indicator doesn't repaint.
Usage
I didn't backtest the indicator, but I recommend the 5–15 min timeframe.
It can be also used on other timeframs, but I have no experience with that.
The indicator has no special filter system, so you need to find an own combo in order to build a trading system.
A trend filter like KAMA or my Adaptive Fisherized Trend Intensity Index could fit well.
If you find a good combo, let me know it in the comments pls.
Signals
Zero Line
KST crossover 0 => Enter Long
KST crossunder 0 => Enter Short
Cross
KST crossover KST MA => Enter Long
KST crossunder KST MA => Enter Short
Cross Filtered
KST crossover KST MA and KST above 0 => Enter Long
KST crossunder KST MA and KST under 0 => Enter Short
KST crossunder 0 => Exit Long
KST crossover 0 => Exit Short
More to read: KST Explanation
Enjoy and let me know your opinion!
--
Credits to
- @tista
- @blackcat1402
- @DasanC
- @cheatcountry

Bitcoin Miner Extreme SellingThis script is for identifying extreme selling. Judging by the chart, Bitcoin miners often (not always) sell hard for two reasons: to take profit into parabolic price rises, or to stay solvent when the price is very low.
Extreme selling thus often coincides with long-term tops and bottoms in Bitcoin price. This can be a useful EXTRA data point when trying to time long-term Bitcoin spot or crypto equity investment (NOT advice, you remain responsible, etc). The difference between selling measured in BTC and in USD gives a reasonable idea of whether miners are selling to make a profit or to stay solvent.
CREDITS
The idea for using the ratio of miner outflows to reserves comes from the "Bitcoin Miner Sell Pressure" script by the pioneering capriole_charles.
The two request.security calls are identical. Another similarity is that you have to sum the outflows to make it make sense. But it doesn't make much difference, it turns out from testing, to use an average of the reserves, so I didn't. All other code is different.
The script from capriole_charles uses Bollinger bands to highlight periods when sell pressure is high, uses a rolling 30-day sum, and only uses the BTC metrics.
My script uses a configurable 2-6 week rolling sum (there's nothing magical about one month), uses different calculations, and uses BTC, USD, and composite metrics.
INPUTS
Rolling Time Basis : Determines how much data is rolled up. At the lowest level, daily data is too volatile. If you choose, e.g., 1 week, then the indicator displays the relative selling on a weekly basis. Longer time periods, obviously, are smoother but delayed, while shorter time periods are more reactive. There is no "real" time period, only an explicit interpretation.
Show Data > Outflows : Displays the relative selling data, along with a long-term moving average. You might use this option if you want to compare the "real" heights of peaks across history.
Show Data > Delta (the default): Only the difference between the relative selling and the long-term moving average is displayed, along with an average of *that*. This is more signal and less noise.
Base Currency : Configure whether the calculations use BTC or USD as the metric. This setting doesn't use the BTC price at all; it switches the data requested from INTOTHEBLOCK.
If you choose Composite (the default), the script combines BTC and USD together in a relative way (you can't simply add them, as USD is a much bigger absolute value).
In Composite mode, the peaks are coloured red if BTC selling is higher than USD, which usually indicates forced selling, and green if USD is higher, which usually indicates profit-taking. This categorisation is not perfectly accurate but it is interesting insomuch as it is derived from block data and not Bitcoin price.
In BTC or USD mode, a gradient is used to give a rough visual idea of how far from the average the current value is, and to make it look pretty.
USAGE NOTES
Because of the long-term moving averages, the length of the chart does make a difference. I recommend running the script on the longest Bitcoin chart, ticker BLX.
To use it to compare selling with pivots in crypto equities, use a split chart: one BLX with the indicator applied, and one with the equity of your choice. Sync Interval, Crosshair, Time, and Date Range, but not Symbol.

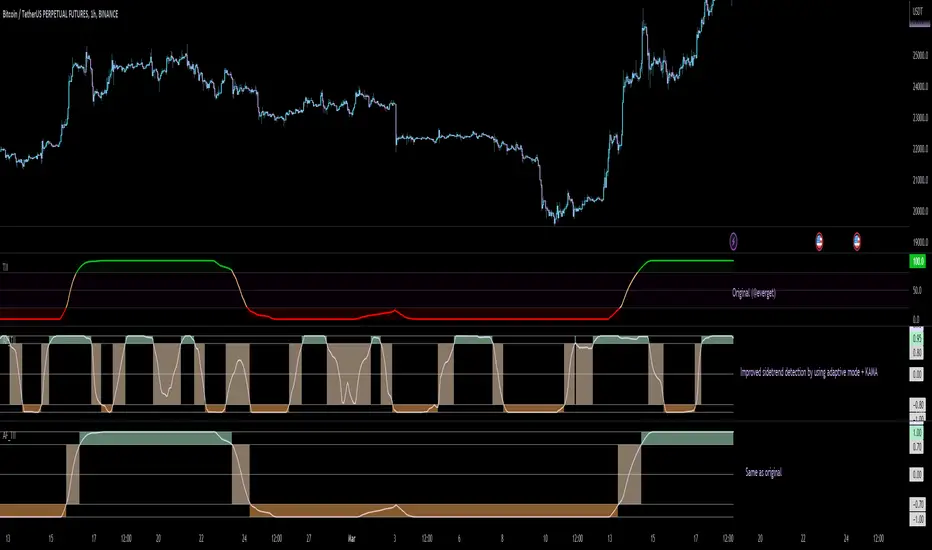
Adaptive Fisherized Trend Intensity Index Introduction
Here, I modified the script "Trend Intensity Index" (TII) of @everyget.
TTI was developed by M.H. Pee, who also published other trend analysis indicators like the Trend Trigger/Continuation Factor
It helps to determine how strong the current trend is.
The stronger the trend, the higher the chance the price may continue moving in the current direction.
Features
Adaptive mode (based on Ehlers dominant cycle determination) => automatically determines the length
Inverse Fisher Transform => gives sharper signals
Customizable MA Types => discover the impact of different ma bases
Hann Window and NET smoothing => state-of-the-art smoothing
Trend Visualization => shows you the up/down/side trend
Usage
This indicator here offers a perfect trend filtering system. It is capable of up/down/side trend detection.
There are a lot of trend indicators which don't respect sidetrends, which makes this indicator pretty useful.
A lot of traders use trend-following trading systems.
A trader will usually make his/her entry in the market during a strong trend and ride it, until the TII provides an indication of a reversal.
For mean-revertive trading systems, you could use TII to just trade in side trend.
A lot of mean-revertive signal emitters like Bollinger Bands or RSI work most of the times better in side trend.
Furthermore, every timeframe could be used, but higher timeframes have more impact because trends are stronger there.
Signals
Green zone (Top) => Etablished bullish trend
"Peachy" Zone (Middle) => Sidetrend/flat market
Red Zone (Bottom) => Etablished bearish trend
Enjoy guys!
(Let me know your opinions!)
--
Credits to:
@blackcat1402
@DasanC
@cheatcountry
@everget
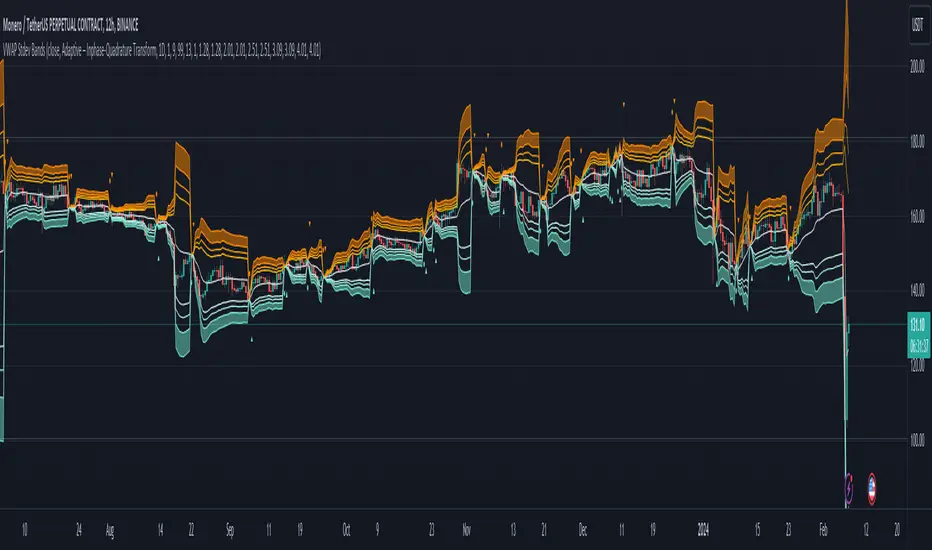
Adaptive VWAP Stdev BandsIntroduction
Heyo, here are some adaptive VWAP Standard Deviation Bands with nice colors.
I used Ehlers dominant cycle theories and ZLSMA smoothing to create this indicator.
You can choose between different algorithms to determine the dominant cycle and this will be used as reset period.
Everytime bar_index can be divided through the dominant cycle length and the result is zero VWAP resets if have chosen an adaptive mode in the settings.
The other reset event you can use is just a simple time-based event, e.g. reset every day.
Usage
I think people buy/sell when it reaches extreme zones.
Enjoy!
---
Credits to:
@SandroTurriate - VWAP Stdev Bands
@blackcat1402 - Dominant Cycle Analysis
@DasanC - Dominant Cycle Analysis
@veryfid - ZLSMA
(Sry, too lazy for linking)
I took parts of their code. Ty guys for your work! Just awesome.
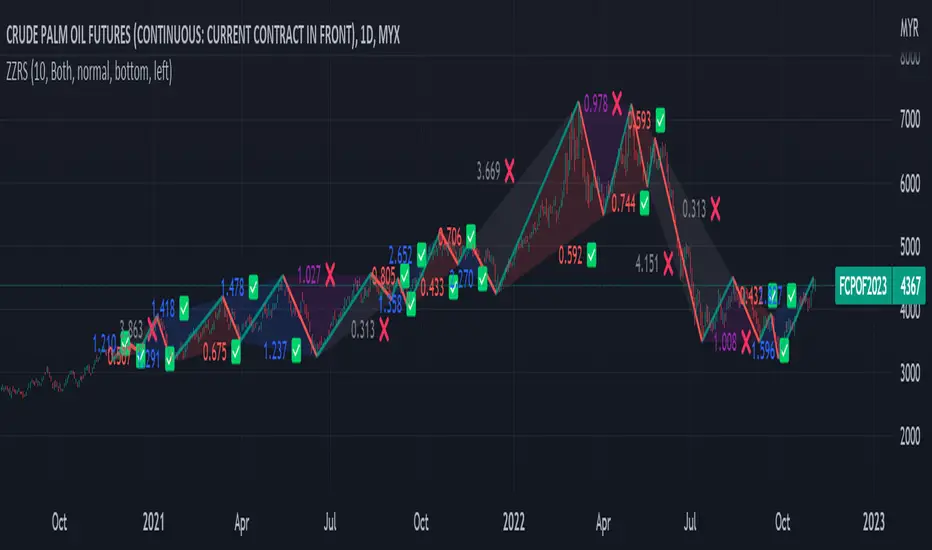
Zig Zag Ratio Simplified█ OVERVIEW
This indicator was to show ratio between zig zag. Ideally to find Fibonacci Retracement / Projection, Harmonic Patterns, ABCD, Elliot Wave and etc.
█ CREDITS
LonesomeTheBlue
█ FEATURES
Table can positioned by any position and font size can be resized.
█ USAGE / TIPS EXAMPLES (Description explained in each image)
Volatility Stop with Vwap StrategyFirst the credits goes to @TradingView for their release of the volatility stop mtf indicator.
I have took it, and inside I have added a weekly vwap for a better trend direction and at the same time I have added a dynamic risk managment which is calculated from the distance between the volatility line to the close of the candle.
The rules for entry are simple:
For long:We enter when our close of the candle is above the volatility stop line and at the same time the close of the candle is above weekly vwap
For short we enter when our close of the candle is below the volatility stop line and at the same time the close of the candle is below weekly vwap.
We exit when we either have a reverse signal than the one we enterred, or based on the TP/SL which is calculated with the distance from vwap to the close of the candle.
If you have any questions please let me know !

USD Liquidity Conditions Index Swing Stock Strategy Original credits goes to @ElDoggo22 www.tradingview.com
I looked in the post created by him, of USD liquidity and I have noticed that if you are going to apply a percentile top and bottom to it, can become an interesting swing strategy for US Stocks.
So in this case I decided to create a 99th percentile for top and 4th percentile for bot with a big length, preferably 100+ candles, for this example i took 150.
Rules for entry :
Long : either bot or top lines are ascending
We exit long either the top line is descending, or we have sudden cross of the moving average with both top and bot within the same candle
Short: we enter short when we have a sudden cross down of the moving average with both top and bot within the same candle
We exit short when we have a cross over of the moving average with both top and bot within the same candle ( or we have a long entry condition)
If there are qny questions, please let me know !

Coral Trend Pullback Strategy (TradeIQ)Description:
Strategy is taken from the TradeIQ YouTube video called "I Finally Found 80% Win Rate Trading Strategy For Crypto".
Check out the full video for further details/clarification on strategy entry/exit conditions.
The default settings are exactly as TradeIQ described in his video.
However I found some better results by some tweaking settings, increasing R:R ratio and by turning off confirmation indicators.
This would suggest that perhaps the current confirmation indicators are not the best options. I'm happy to try add some other optional confirmation indicators if they look to be more effective.
Recommended timeframe: 1H
Strategy incorporates the following features:
Risk management:
Configurable X% loss per stop loss
Configurable R:R ratio
Trade entry:
Based on strategy conditions below
Trade exit:
Based on strategy conditions below
Backtesting:
Configurable backtesting range by date
Trade drawings:
Each entry condition indicator can be turned on and off
TP/SL boxes drawn for all trades. Can be turned on and off
Trade exit information labels. Can be turned on and off
NOTE: Trade drawings will only be applicable when using overlay strategies
Alerting:
Alerts on LONG and SHORT trade entries
Debugging:
Includes section with useful debugging techniques
Strategy conditions
Trade entry:
LONG
C1: Coral Trend is bullish
C2: At least 1 candle where low is above Coral Trend since last cross above Coral Trend
C3: Pullback happens and price closes below Coral Trend
C4: Coral Trend colour remains bullish for duration of pullback
C5: After valid pullback, price then closes above Coral Trend
C6: Optional confirmation indicators (choose either C6.1 or C6.2 or NONE):
C6.1: ADX and DI (Single indicator)
C6.1.1: Green line is above red line
C6.1.2: Blue line > 20
C6.1.3: Blue trending up over last 1 candle
C6.2: Absolute Strengeh Histogram + HawkEye Volume Indicator (Two indicators combined)
C6.2.1: Absolute Strengeh Histogram colour is blue
C6.2.2: HawkEye Volume Indicator colour is green
SHORT
C1: Coral Trend is bearish
C2: At least 1 candle where high is below Coral Trend since last cross below Coral Trend
C3: Pullback happens and price closes above Coral Trend
C4: Coral Trend colour remains bearish for duration of pullback
C5: After valid pullback, price then closes below Coral Trend
C6: Optional confirmation indicators (choose either C6.1 or C6.2 or NONE):
C6.1: ADX and DI (Single indicator)
C6.1.1: Red line is above green line
C6.1.2: Blue line > 20
C6.1.3: Blue trending up over last 1 candle
C6.2: Absolute Strengeh Histogram + HawkEye Volume Indicator (Two indicators combined)
C6.2.1: Absolute Strengeh Histogram colour is red
C6.2.2: HawkEye Volume Indicator colour is red
NOTE: All the optional confirmation indicators cannot be overlayed with Coral Trend so feel free to add each separately to the chart for visual purposes
Trade exit:
Stop Loss: Calculated by recent swing low over previous X candles (configurable with "Local High/Low Lookback")
Take Profit: Calculated from R:R multiplier * Stop Loss size
Credits
Strategy origin: TradeIQ's YouTube video called "I Finally Found 80% Win Rate Trading Strategy For Crypto"
It combines the following indicators for trade entry conditions:
Coral Trend Indicator by @LazyBear (Main indicator)
Absolute Strength Histogram | jh by @jiehonglim (Optional confirmation indicator)
Indicator: HawkEye Volume Indicator by @LazyBear (Optional confirmation indicator)
ADX and DI by @BeikabuOyaji (Optional confirmation indicator)

Stablecoin Dominance (USDT, USDC & BUSD) Credits to lysergikUsed lysergik script and replaced DAI to BUSD, results will be practically the same.

Simple and Profitable Scalping Strategy (ForexSignals TV)Strategy is based on the "SIMPLE and PROFITABLE Forex Scalping Strategy" taken from YouTube channel ForexSignals TV.
See video for a detailed explaination of the whole strategy.
I'm not entirely happy with the performance of this strategy yet however I do believe it has potential as the concept makes a lot of sense.
I'm open to any ideas people have on how it could be improved.
Strategy incorporates the following features:
Risk management:
Configurable X% loss per stop (default to 1%)
Configurable R:R ratio
Trade entry:
Based on stratgey conditions outlined below
Trade exit:
Based on stratgey conditions outlined below
Backtesting:
Configurable backtesting range by date
Trade drawings:
Each entry condition indicator can be turned on and off
TP/SL boxes drawn for all trades. Can be turned on and off
Trade exit information labels. Can be turned on and off
NOTE: Trade drawings will only be applicable when using overlay strategies
Debugging:
Includes section with useful debugging techniques
Strategy conditions
Trade entry:
LONG
C1: On higher timeframe trend EMAs, Fast EMA must be above Slow EMA
C2: On higher timeframe trend EMAs, price must be above Fast EMA
C3: On current timeframe entry EMAs, Fast EMA must be above Medium EMA and Medium EMA must be above Slow EMA
C4: On current timeframe entry EMAs, all 3 EMA lines must have fanned out in upward direction for previous X candles (configurable)
C5: On current timeframe entry EMAs, previous candle must have closed above and not touched any EMA lines
C6: On current timeframe entry EMAs, current candle must have pulled back to touch the EMA line(s)
C7: Price must break through the high of the last X candles (plus price buffer) to trigger entry (stop order entry)
SHORT
C1: On higher timeframe trend EMAs, Fast EMA must be below Slow EMA
C2: On higher timeframe trend EMAs, price must be below Fast EMA
C3: On current timeframe entry EMAs, Fast EMA must be below Medium EMA and Medium EMA must be below Slow EMA
C4: On current timeframe entry EMAs, all 3 EMA lines must have fanned out in downward direction for previous X candles (configurable)
C5: On current timeframe entry EMAs, previous candle must have closed above and not touched any EMA lines
C6: On current timeframe entry EMAs, current candle must have pulled back to touch the EMA line(s)
C7: Price must break through the low of the last X candles (plus price buffer) to trigger entry (stop order entry)
Trade entry:
Calculated position size based on risk tolerance
Entry price is a stop order set just above (buffer configurable) the recent swing high/low (long/short)
Trade exit:
Stop Loss is set just below (buffer configurable) trigger candle's low/high (long/short)
Take Profit calculated from Stop Loss using R:R ratio
Credits
"SIMPLE and PROFITABLE Forex Scalping Strategy" taken from YouTube channel ForexSignals TV

SSL + Wave Trend StrategyStrategy incorporates the following features:
Risk management:
Configurable X% loss per stop loss
Configurable R:R ratio
Trade entry:
Based on strategy conditions below
Trade exit:
Based on strategy conditions below
Backtesting:
Configurable backtesting range by date
Trade drawings:
Each entry condition indicator can be turned on and off
TP/SL boxes drawn for all trades. Can be turned on and off
Trade exit information labels. Can be turned on and off
NOTE: Trade drawings will only be applicable when using overlay strategies
Alerting:
Alerts on LONG and SHORT trade entries
Debugging:
Includes section with useful debugging techniques
Strategy conditions
Trade entry:
LONG
C1: SSL Hybrid baseline is BLUE
C2: SSL Channel crosses up (green above red)
C3: Wave Trend crosses up (represented by pink candle body)
C4: Entry candle height is not greater than configured threshold
C5: Entry candle is inside Keltner Channel (wicks or body depending on configuration)
C6: Take Profit target does not touch EMA (represents resistance)
SHORT
C1: SSL Hybrid baseline is RED
C2: SSL Channel crosses down (red above green)
C3: Wave Trend crosses down (represented by orange candle body)
C4: Entry candle height is not greater than configured threshold
C5: Entry candle is inside Keltner Channel (wicks or body depending on configuration)
C6: Take Profit target does not touch EMA (represents support)
Trade exit:
Stop Loss: Size configurable with NNFX ATR multiplier
Take Profit: Calculated from Stop Loss using R:R ratio
Credits
Strategy is based on the YouTube video "This Unique Strategy Made 47% Profit in 2.5 Months " by TradeSmart.
It combines the following indicators to determine trade entry/exit conditions:
Wave Trend: Indicator: WaveTrend Oscillator by @LazyBear
SSL Channel: SSL channel by @ErwinBeckers
SSL Hybrid: SSL Hybrid by @Mihkel00
Keltner Channels: Keltner Channels Bands by @ceyhun
Candle Height: Candle Height in Percentage - Columns by @FreeReveller
NNFX ATR: NNFX ATR by @sueun123

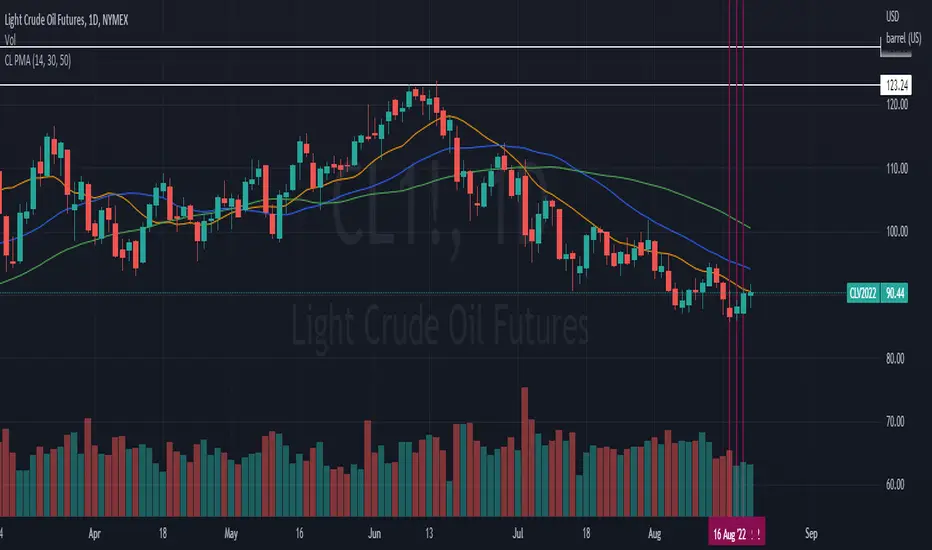
CL PMAPivot moving averages useing SMA's. This study is just a tweak from the study already done by @QUANTCT. I just cleaned it up and used SMAs instead of EMAs so he deserves most credit.
Alternative MTF Table█ OVERVIEW
This indicator is an educational indicator which was stripped down from Regression Channel Alternative MTF to display 3 timeframes based on timeframe scenarios.
The timeframe scenarios are defined based on Position, Swing and Intraday Trader.
█ INSPIRATION
It is possible to use array.new_bool, array.indexof and switch to get this outcome. Credits to TradingView .
DateNow█ OVERVIEW
Library "DateNow"
TODO: Provide today's date based on UNIX time
█ INSPIRATIONS
Use pinescript v4 functions such as year(), month() and dayofmonth().
Use pinescript v5 function such as switch.
Export as string variables.
Not using any match function such as math.floor.
█ CREDITS
RicardoSantos
█ KNOWN ISSUES
Date for Day display incorrectly by shortage 1 value especially Year equal to or before 1984
Timezone issue. Example : I using GMT+8 for my timezone, try using other GMT will not work. Al least, GMT+2 to GMT+13 is working. GMT-0 to GMT+1 is not working, although already attempt using UTC-10 to UTC-1.
dateNow()
: DateNow
Parameters:
: : _timezone
Returns: : YYYY, YY, M, MM, MMM, DD

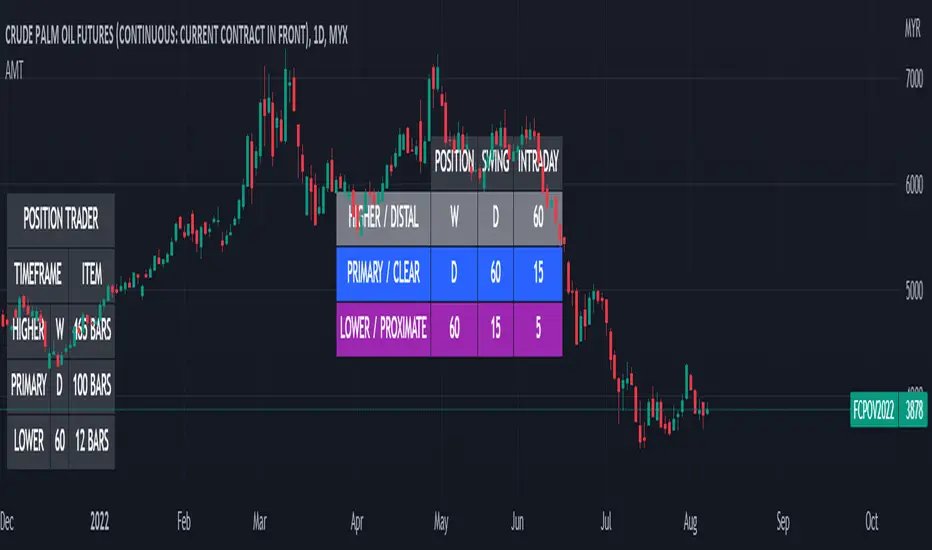
Regression Channel Alternative MTF█ OVERVIEW
This indicator displays 3 timeframes of parallel channel using linear regression calculation to assist manual drawing of chart patterns.
This indicator is not true Multi Timeframe (MTF) but considered as Alternative MTF which calculate 100 bars for Primary MTF, can be refer from provided line helper.
The timeframe scenarios are defined based on Position, Swing and Intraday Trader.
█ INSPIRATIONS
These timeframe scenarios are defined based on Harmonic Trading : Volume Three written by Scott M Carney.
By applying channel on each timeframe, MW or ABCD patterns can be easily identified manually.
This can also be applied on other chart patterns.
█ CREDITS
Scott M Carney, Harmonic Trading : Volume Three (Reaction vs. Reversal)
█ TIMEFRAME EXPLAINED
Higher / Distal : The (next) longer or larger comparative timeframe after primary pattern has been identified.
Primary / Clear : Timeframe that possess the clearest pattern structure.
Lower / Proximate : The (next) shorter timeframe after primary pattern has been identified.
Lowest : Check primary timeframe as main reference.
█ EXAMPLE OF USAGE / EXPLAINATION
