Bollinger Bands With User Selectable MABollinger Bands with user selection options to calculate the moving average basis and bands from a variety of different moving averages.
The user selects their choice of moving average, and the bands automatically adjust. The user may select a MA that reacts faster to volatility or slower/smoother.
Added additional options to color the bands or basis based on the current trend and alternate candle colors for band touches. Options:
REACT SLOW/SMOOTH TO VOLATILITY
simple moving average (Regular Bollinger Bands)
REACT SMOOTH TO VOLATILITY
exponential moving average (EMA Bollinger Bands)
weighted moving average (Weighted MA Bollinger Bands)
exponential hull moving average (Hull Bollinger Bands with better smoothing)
HIGHLY ADJUSTABLE TO VOLATILITY
Arnaud Legoux Moving average (ALMA Bollinger Bands)
Note: 0.85 ALMA default for more smoothing, set offset=1 to turn off smoothing
REACT HARSH TO VOLATILITY
least squares moving average (Least Squares Bollinger Bands)
REACT VERY FAST TO VOLATILITY
hull moving average (Hull Bollinger Bands or Hullinger Bands)
VALUE ADDED: This script is unique in that no other Bollinger Bands indicator offers a user selection for moving average, and some of the options do not exist yet as Bollinger Bands indicators.
Definitions:
Bollinger Bands: A Bollinger Band® is a technical analysis tool defined by a set of trendlines plotted two standard deviations (positively and negatively) away from a simple moving average (SMA) of a security's price, but which can be adjusted to user preferences.
Exponential Bollinger Bands: The most important characteristics of the Exponential Bollinger Bands indicator are: When the market is flat, the bands will stay much closer to prices. When the volatility is high, the bands move away from prices faster.
Hull Bollinger Bands: Bollinger Bands calculated by Hull moving average, rather than simple moving average or ema. The Hull Moving Average (HMA), developed by Alan Hull, is an extremely fast and smooth moving average. In fact, the HMA almost eliminates lag altogether and manages to improve smoothing at the same time.
Exponential Hull Bollinger Bands: Bollinger Bands calculated by Exponential Hull moving average, rather than simple moving average or ema. The Exponential Hull Moving Average is similar to the standard Hull MA, but with superior smoothing. The standard Hull Moving Average is derived from the weighted moving average (WMA). As other moving average built from weighted moving averages it has a tendency to exaggerate price movement.
Weighted Moving Average Bollinger Bands: A Weighted Moving Average (WMA) is similar to the simple moving average (SMA), except the WMA adds significance to more recent data points.
Arnaud Legoux Moving Average Bollinger Bands: ALMA removes small price fluctuations and enhances the trend by applying a moving average twice, once from left to right, and once from right to left. At the end of this process the phase shift (price lag) commonly associated with moving averages is significantly reduced. Zero-phase digital filtering reduces noise in the signal. Conventional filtering reduces noise in the signal, but adds a delay.
Least Squares Bollinger Bands: The indicator is based on sum of least squares method to find a straight line that best fits data for the selected period. The end point of the line is plotted and the process is repeated on each succeeding period.
在腳本中搜尋"TRENDLINES"

RobocanThis script is equipped with
🔵 Robo 2
It offers strategic trading entry and exit points. Truly unique tool for technical analysis for the financial market as it includes calculation of specific metrics like MACD, ATR and RSI.
🔵 Bull & Bear
The signal can be a fairly valuable tool. Momentum is one of those aspects of the market that is crucial to understanding price movements, yet it is so hard to get a solid grip on. It can be used in some instances to generate quality signals but much like with any signal generating indicator, it should be used with caution.
When indicator gives you " Bull " signal , short term momentum is now rising faster than the long term momentum. This can present a bullish buying opportunity.
When indicator gives you "Bear " signal, short term momentum is now falling faster then the long term momentum. This can present a bearish selling opportunity.
🔵 Robo's Cloud
The indicator inspired from Ichimoku CLoud, it uses an unique formula to generate clouds on its own system!
" BUY or ENTER "when the price breaks the Cloud in the direction of the breakout (UP ) and the cloud turns to green colour. Stay in the market until the cloud turns to red colour. Let's assume that You are a swing trader and use 1D candles as long as The candle is above the "green " cloud , you should continue with a trend! No need to hurry to sell until you see the " red " cloud.
🔵 Super Robo
It can perform greatly in a bull and bear market
It's unique algorithm find profitable coins based on "Early Bird + Buy 2 + Volume "gives you ENTRY and EXIT ideas
It works perfectly on the 1W - 3D - 1D charts
🔵 Hell & Moon
When the “Moon or Hell “closes below top of the closing price, a Moon - Buy signal is generated
It works perfectly on the 1W - 1D - 3H charts
🔵 Early Bird Signals
Being an early bird rather than a night owl will naturally lead you to become more successful in trading. There is no secret magic formula to success; this is something you must accept. Trading success is the result of a ‘simple’ list made up of four things: hard work, timing, persistence , and a good dose of Early Bird signals.
it provides high risk & high reward opportunities.
Dont use more than 3 Robo signals at the same time on the chart. Why?
Example, Robo 2 already included 3 different indicators in the formula.
Robo 2 : Truly unique tool for technical analysis for the financial market as it includes calculation of specific metrics like SAR + MACD + Price Movement that gives you ENTRY and EXIT ideas ( Buy 2 & Sell 2 )
If you use more than 3 robo signals, you try to use around " 10 - 12 " different indicators at the same time!
DON'T DO IT!
To get maximum results from your robo advisors, follow the advice below ;
A ) 3 robo signals
B ) 3 robo signals + 1 side strategy
A or B + Pick one bonus below
Dynamic Support Resistance,
Fibonacci Levels
Pivot Support Resistance
Robo signals :
Robo 1
Robo 2
Super EngineeringRobo
Robo 3
Robo 4
Bull & Bear
Hell & Moon
Early Bird
EngineeringRobo's cloud
Ultimate MA crossover strategy
Side strategies :
McGinley Dynamic
Bollinger Bands Strategy
MA 20 & MA 50
MA 50 & MA 200
EMA Trendlines
Robo ( 2 + 3 ) shows you that if the signals are covering each other. So, It is good to keep open it when you use Robo 2 and Robo 3 at the same time.
If you are following any signals, you should always wait for the candle close before buying or selling.
The signal can come and go anytime during the live candle. ALL indicators do that, that is not considered repainting.
Repainting is when a signal appears, the candle is closed, and when you refresh the chart it disappeared. It is logical that until the candle is closed the signal is not decided yet, hence the alert setup as Once per bar Close.
Deluxe never repaints! Yes, you heard it right: you will never have to worry about signal changing after the candle is closed.
________________________________________________________________________Timeframes_____________________________________________________________________
Our recommendations to get the best results:
Swing Trading Crypto : Use 1D Time Frame Candles
Swing Trading Stocks : Use 1W Time Frame Candles
Swing Trading Commodities : Use 1W Time Frame Candles
Day Trading Crypto : Use 3H Time Frame Candles
Day Trading Stocks : Use 1D Time Frame Candles
Day Trading Commodities : Use 1D Time Frame Candles
Not recommended any other time frames.
It gives you all the tools and information you need for day-to-day trading and investing, while also keeping a great buy and sell signals! No excuse to lose in any financial market anymore! Try now!
How can you add the algorithm into your chart?
1. Login to TradingView.com
2. From the homepage, click on ‘Chart’ in the top navigation bar
3. Select “Indicators” on the top-center-middle panel
4. In the indicator library, type "Robocan "
5. Use the website link below to obtain access to this indicator

Trend lines + Pivot Levels + Candlestick PatternsThis is a pure PRICE ACTION indicator that will show you possible trend lines, pivot lines and candlestick patterns at once.
it has been designed to determine upper and lower trend lines in the chart and you can set candlestick patterns on them with alerts!
it means that you add the indicator to the chart and set the alert and done!
whenever a pinbar or engulf or breakout(in both directions) happens, you will be notified by alerts.
you also have pivot lines on the chart by this indicator. you can set the candlesticks on pivots instead of trend lines, so if you are a fan of support and resistance you can have this one, it depends on you.
all of the pivots and trend lines and also the candle sticks are customizable, so you can exactly select the pinbar, engulfing or breakout candle that matches with your mindset. for example you can set a pinbar that long shadow is 4 times or 3 times greater than the body, it's on you.
you can also customize trendlines or pivot lines, if you are scalper you can set it to small trend lines and if you are day trader or long term trader you can set it to the number that fits with your strategy.
trends and pivots will be updated automatically and there is no need to set it every time.
Be PROFITABLE!
$kMagician /*

On-Balance Volume Oscillator with Divergence and PivotsThis is On-Balance Volume recalculated to be an Oscillator, a Divergence hunter was added, also Pivot Points and Alerts.
On-Balance Volume, or OBV is considered a "leading indicator" - in contrast to a "lagging indicator" just as Moving Averages it does not show a confirmation what already happened, but it shows what can happen in the future. For example: The chart is climbing while the OBV oscillator is slowly declining, gets weaker and weaker, maybe even prints bearish divergences? That means that a reversal might be occurring soon. Leading indicators are best paired with Stop and Resistance Lines, general Trendlines, Fib Retracements etc...Your chart is approaching a very important Resistance Trendline but the OBV shows a very positive signal? That means there is a high probability that the Resistance is going to be pushed though and becomes Support in the future.
What are those circles?
-These are Divergences. Red for Regular-Bearish. Orange for Hidden-Bearish. Green for Regular-Bullish. Aqua for Hidden-Bullish.
What are those triangles?
- These are Pivots. They show when the OBV oscillator might reverse, this is important to know because many times the price action follows this move.
Please keep in mind that this indicator is a tool and not a strategy, do not blindly trade signals, do your own research first! Use this indicator in conjunction with other indicators to get multiple confirmations.

Marked Highs - Support & Resistance [LevelUp]This indicator mimics the functionality of marked highs/lows in MarketSmith, a charting tool available from Investor's Business Daily. Marked highs/lows, sometimes referred to as pivot highs/lows, can be used to locate areas of support and resistance. These same points can also be helpful when drawing trendlines and channels.
I've added several customization options that add to the flexibility and overall usefulness of this technical indicator.
Custom Ranges for Marked Highs/Lows
In MarketSmith, a marked high is the highest high going back nine bars and forward nine bars. The number of required bars with lower highs on each side of the high is referred to as the period. The default for the indicator is a nine bar period, however, you can configure the period to fit with your trading style.
View Marked Highs/Lows on Any Timeframe
MarketSmith only supports marked highs/lows on daily charts. With this indicator you can view marked highs/lows on any timeframe.
Suggestions
■ Draw horizontal rays from the most recent marked high and low to help visualize areas of support and resistance.
■ Create a channel to show the current trading range. Draw a trendline across marked highs and a separate trendline across marked lows.
■ Increase the marked high/low periods to find more significant highs and lows.

Bonfire 2021 by CaptBlackBeardSee original (balanced scale) chart here:
See a local price version squared to the start of this cycle.
Published chart is focusing on the squaring feature of Bonfire.
Updates to Pinescript have allowed some additional options that allow a better experience.
If you are unfamiliar with squaring price and time or finding 1:1 ratios , you should look into the subject along with the (45 degree) concept creator (W.D. Gann).
Squaring price/time is just the very first steps in setting up your Bonfire chart.
Once you have properly scaled the chart to your liking -> Right Click the scale on the left -> Click Lock Scale to preserve the price time squaring .
Here you see just how natural the price is to 45 degrees. Now adding additional drawings such as Gann and Fibonacci tools along with symmetry based geometry are a breeze.
Once you have your chart setup, there are endless possibilities in building your prediction models.
Again, this is just the first step and showing one feature of Bonfire. There's arguably more powerful and unique features included with the next layer of advanced indicators once zoomed in.
I'm working hard to build and release a website, forum, detailed information, guides and videos for all of Bonfire's features as well as my other indictors so stay tuned.
Just a few of the advantages of Bonfire squaring
Unique square offsets and settings capture common time pivots and price level ratios that help you to align price/time 1:1 (from major pivots or the event of your choice ).
When the price is square you have a greater chance of being accurate with trend predictions, targets, price levels, Gann tools and geometry.
When the price and trends are truly square you have built-in confluence for your current system and indicators.
One factor not considered by most is the massive variable of scaling charts. Finding 45 degrees is just your opinion unless you scale a chart properly. Using a static square is not enough.
Many people find that having a structured and consistent method for visualizing an asset helps them understand the state of the asset faster but also provides a stable way to compare assets quickly.
Aside from finding the true 45 degree trends,90 degree pivots, 0 degree levels, you can use the corners, midlines, and tangents from any and all squares to add some very powerful trendlines and pivots.
This is the newest version of Bonfire with updates to make it easier to customize and adjust inputs/settings to your preference. The key is to allow adjustments while maintaining the core Bonfire parameters.
Some new features:
-Lightmode and Darkmode switch. * Recommend a plain white or black background.
-More Bonfire specific built-in sizing options
-Display options = Squares Only | Indicators Only | Both
-User preferances = Square line thickness

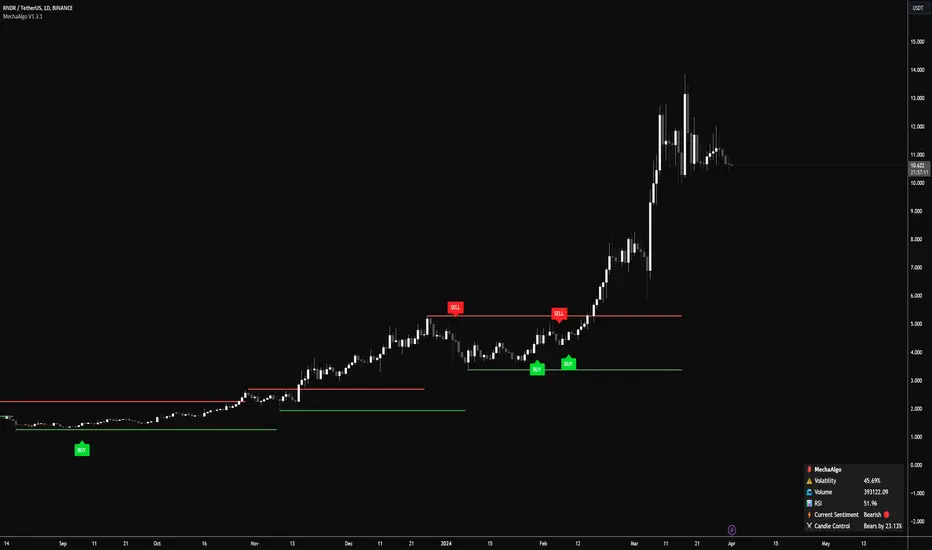
MechaAlgoWhat is MechaAlgo?
MechaAlgo was created to assist any type of trader on a day to day basis. Our intelligent and accurate algorithms turn complex charts into profitable plays, minimizing losses and maximizing profits. We hope that you will find use in the tools and resources we provide, and we will continue to improve on our products in order to take your trading to new heights!
Any Time, Any Market
Our indicators work with real time data on any market. This means that any kind of trader will find our tools useful, regardless of what you are trading.
Feature List
Multiple Signal Modes
Numerous Candle Coloring Modes
Reversal Cloud Overlay
Auto Support & Resistance
Auto Trendlines
Auto Profit Targets
Real Time Informational Dashboard
Multi-Timeframe Trend Panel
Future Trend Projection
Many More Features to Come!
By using this script you acknowledge that MechaAlgo cannot guarantee you profit, and that this product was only created in attempt to benefit traders. You also acknowledge that past performance is not indicative of future results, and that the experience of other users or what you see online may not always be your experience.
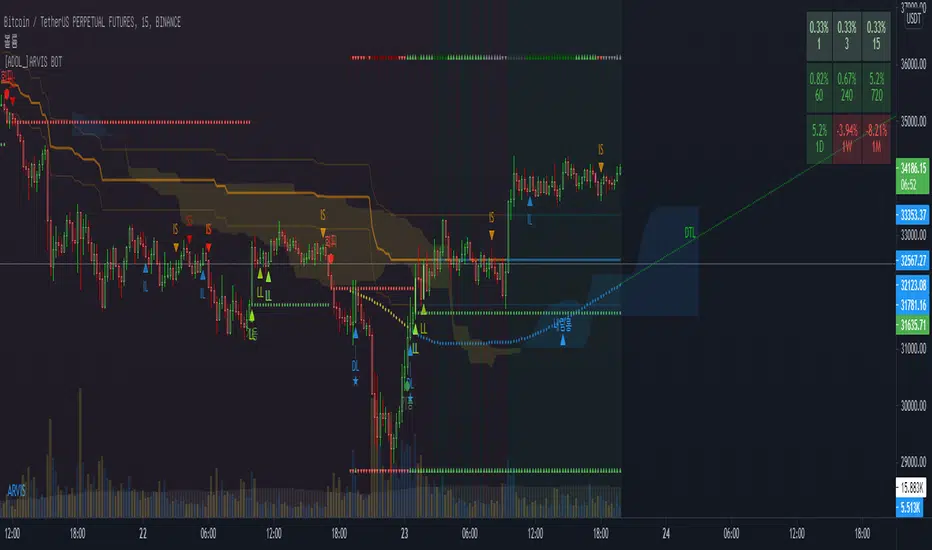
[ADOL_]Trend Break Pro ARVIS BOTENG) Trend Break Pro Version : ARVIS BOT
It automatically draws trend lines and signals signals based on sophisticated standards.
It is an indicator that can be used as a tool for trading. from scalping
It was made as an all-round player that can even use the swing.
It contains all the signals of a breakout of the basic trend line,
By applying a new logic, signals that are faster than the breakout point of the basic trend line and
I made it to produce a better value while catching the signal of the press.
principle)
Basic trendline features:
It reflects the concepts of HH and LL.
Trendlines are created using the basic construction method, connecting highs and highs and lows and lows.
The 3 candles prior to the breakout of the trend line are the triggers to create a ready-to-prepare base signal.
What is HH? It is an abbreviation of Higher High, which means to raise the high.
What is LL? An abbreviation of Lower Low, which means to lower the low.
Features of the new core logic:
This is a quick way to find a reversal of a trend, taking into account candle patterns, volume, and moving averages.
The candle pattern that is reversed when the trading volume increases and then disappears is processed by subdividing and digitizing the pattern.
generate a signal. At the turning point of the trend, it triggers a long and short reversal signal.
For trading volume, obv was utilized. Overlaid elements allow you to find signals that are slightly faster than the trend line.
What is obv? OBV = An abbreviation of On Balance Volume. It is a secondary indicator showing the cumulative total of trading volume.
The background is a notation of the section where the trend is reversing.
option)
The degree of freedom to set options according to scalping, single stroke, swing, and bot implementation is given.
A volatility warning notification has been included. The function of TD setup is included.
You can set the range of candles as an option. The backtesting value is printed.
The backtesting value is calculated as the average of the opening and closing prices.
Volatility warnings are displayed in yellow.
TD Setup: Numbers floating on the candle, in ascending and descending order (=sequence) from 1 to 9.
The reason for writing up to 9 is based on statistics, and the more fundamental principle is the theory of the Fibonacci sequence.
The Fibonacci sequence is the number in the golden ratio that makes up nature, 1.1.2.3.5.8.13.21.34.55.89...
The sum of the nth and n+1th numbers becomes n+2th.
A note on odds of winning. Even if the win rate is 33%, if the profit-loss stop-loss ratio is 3 to 1, the profit exceeds 2, so cumulative profits are generated.
In other words, it is decided by considering both the win rate and profit/loss ratio, not just the win rate. The logic of a short stop loss and a long profit trend is reflected.
time frame)
Applicable to any timeframe.
Scalping: 1 minute, 3 minute, 5 minute / Danta: 15 minute, 1 hour / Swing: 4 hour, daily
Recommended time frame: 3, 15 minutes
alarm)
Various alert functions are available. based on the alert signal
When trading, various signals help to set specific conditions.
- Basic long and short alerts
- Volatility warning alert
- Filtered long and short alerts
- Long and short alerts occur Next peak alerts
- Uptrend line, downtrend line breakout alert
- Alerts about bot start and end when bot is running
- Filtered uptrend line, downtrend line breakout alert
- Alerts for rising and falling 1 setup and rising and falling 9 setups respectively
trading method)
1. For the trend line breakout signal, when the signal overlaps more than 3 times, the breakout probability increases.
It reflects the concept below.
One touch of support/resistance: The first touch sees longs at support and shorts at resistance.
2 touches of support/resistance line: Confirm the position once more in the stage of building support/resistance line (compacting). We see longs at support and shorts at resistance.
3 touches of the ground/resistance line: This is a section with a high possibility of both directions.
Support/resistance line 4 (over) touch: Used as a breakout reference line. When breaking through, short at support and long at resistance.
When the support/resistance line breaks through the closing price, support becomes resistance and resistance becomes support.
2. Trade support/resistance lines using the trend line breakout and signal as an important reference bar.
example)
3-1. Entry criteria/stop loss criteria (when trading hands and bots)
- entry criteria; Follow the signal.
- Stop loss criteria;
Use fixed stop loss: Set 1% fixed stop loss section from signal generation. (% is set individually)
Use Candle Stop Loss: Set a stop loss when the low or high point of the signal generating bar collapses.
Use flow stop loss: Set the stop loss considering the flow of the wave.
3-2. Entry criteria/stop loss criteria (in case of signal-based bot trading)
- Approach with a low magnification (more than 10 times is not recommended) to prevent the risk of liquidation of the largest drop,
There is an opposite signal after entering without setting stop loss separately.
4. Note
You are solely responsible for any trading decisions you make.
5. How to use
It is set to be available only to invited users. When invited,
Tap Add Indicator to Favorites at the bottom of the indicator.
If you click the indicator at the top of the chart screen and look at the left tab, there is a Favorites tab.
Add an indicator by clicking the indicator name in the Favorites tab.
KOR) Trend Break Pro버전 : ARVIS BOT ; 아비스 봇 입니다.
추세선을 자동으로 작도해주며, 정교화된 기준으로 시그널을
발생시켜 매매에 도구로써 활용가능한 지표입니다. 스캘핑부터
스윙까지 활용가능한 올라운드 플레이어로 만들어졌습니다.
기본 추세선 돌파의 시그널들을 모두 포함하고 있으며,
새로운 로직을 적용하여 기본 추세선 돌파시점보다 빠른 신호와
눌림의 신호까지 잡아내면서, 더 나은 값을 산출하도록 만들었습니다.
원리)
기본 추세선 기능 :
HH와 LL의 개념을 반영합니다.
추세선은 고점과 고점, 저점과 저점을 잇는 기본 작도 방법으로 만들어집니다.
추세선 돌파의 3개 이전 캔들부터 신호발생으로 준비를 기본 시그널을 만듭니다.
HH란 ? Higher High의 약자로 고점을 높인다는 의미입니다.
LL란? Lower Low의 약자로 저점을 낮춘다는 의미입니다.
새로운 핵심적인 로직의 기능 :
추세의 반전을 빠르게 찾기 위한 방법으로 캔들패턴, 거래량, 이평선을 고려하여 만들어졌습니다.
거래량이 증가하다가 소멸하는 시점에서 반전되는 캔들패턴을 세분화하고 수치화하여 가공된
신호를 발생시킵니다. 추세의 전환자리에서 롱과 숏의 전환 신호를 발생시키도록 합니다.
거래량에는 obv가 활용되었습니다. 중첩된 요소들을 통해 추세선보다 조금 더 빠른 신호를 찾을 수 있습니다.
obv란 ? OBV = On Blance Volume의 약자로 거래량의 누적합계를 나타내는 보조지표 입니다.
배경은 추세가 전환되는 구간의 표기입니다.
옵션)
스캘핑과 단타, 스윙, 봇의 구현에 맞게 옵션을 설정할 수 있는 자유도를 부여하였습니다.
변동성 경고 알림이 포함되었습니다. TD셋업의 기능이 포함되었습니다.
캔들의 범위를 옵션으로 설정할 수 있습니다. 백테스팅 값이 출력됩니다.
백테스팅 값은 시가와 종가의 평균값으로 산출됩니다.
변동성경고는 yellow 컬러로 표기됩니다.
TD셋업 : 캔들위에 플로팅 되는 숫자로 1~9까지의 오름차순, 내림차순 (=시퀀스)으로 구성됩니다.
9까지 쓰는 이유는 통계기반, 좀 더 근본적인 원리는 피보나치 수열의 이론이 반영되어 있습니다.
피보나치 수열이란 자연을 이루는 황금비율의 숫자로 1.1.2.3.5.8.13.21.34.55.89...
n번째와 n+1번째 숫자의 합이 n+2번째가 됩니다.
원리 예시)
승률에 관한 참고사항. 승률이 33퍼센트의 승률이어도 3대 1의 익절 손절 비율이면 이익이 2를 넘어가니까 누적수익이 발생합니다.
즉, 승률과 손익비를 모두 고려해서 결정하는 것이지, 승률만 봐서는 안됩니다.
손절은 짧게, 수익은 추세대로 길게의 로직이 반영되어 있습니다.
타임프레임)
모든 시간프레임에 적용 가능합니다.
스캘핑 : 1분봉, 3분봉, 5분봉 / 단타 : 15분봉, 1시간봉 / 스윙 : 4시간봉, 일봉
추천타임프레임 : 3, 15분봉
5분봉)
15분봉)
4시간봉)
알람)
다양한 얼러트 기능을 사용할 수 있습니다. 얼러트 신호를 기반으로
매매시 다양한 신호는 구체적 조건 설정에 도움이 됩니다.
- 기본 롱,숏 얼러트
- 변동성 경고 얼러트
- 필터링된 롱,숏 얼러트
- 롱,숏 얼러트 발생 다음봉 얼러트
- 상승추세선, 하락추세선 돌파 얼러트
- 봇구동시 봇의 시작과 종료에 관한 얼러트
- 필터링된 상승추세선, 하락추세선 돌파 얼러트
- 상승,하락1셋업과 상승,하락9셋업 각각에 대한 얼러트
매매방법)
1. 추세선 돌파신호는 신호가 3번이상 중첩될시 돌파확률이 상승합니다.
아래 개념을 반영합니다.
지지/저항선 1터치 : 첫번째 터치에는 지지선에서 롱을, 저항선에서 숏을 봅니다.
지지/저항선 2터치 : 지지/저항선 구축(다지기)의 단계로 한번 더 자리를 확인합니다. 지지선에서 롱을, 저항선에서 숏을 봅니다.
지/저항선의 3터치 : 양방향의 가능성이 높은 구간입니다.
지지/저항선4(이상)터치 : 돌파기준선으로 사용합니다. 돌파할 때, 지지선에서 숏을, 저항선에서 롱을 칩니다.
지지/저항선이 종가로 뚫리면 지지는 저항이 되고, 저항은 지지가 됩니다.
2. 추세선돌파와 시그널이 발생한 봉을 중요한 기준봉으로 활용하여 지지/저항선 매매를 합니다.
예시)
3-1. 진입기준/손절기준(손,봇 매매시)
- 진입기준; 시그널을 따릅니다.
- 손절기준;
고정손절가 이용 : 시그널 발생으로부터 1% 고정 손절가 구간을 설정합니다.(%는 개별로 설정)
캔들손절가 이용 : 시그널 발생봉의 저점이나 고점이 무너지면 손절을 설정합니다.
흐름손절가 이용 : 파동의 흐름을 고려하여 손절을 설정합니다.
3-2. 진입기준/손절기준(신호기반 봇 매매시)
- 저배율(10배이상은 권장하지 않습니다)로 접근해 최대낙폭의 청산위험을 예방하며,
손절가를 따로 설정하지 않고 진입후 반대신호가 뜰때마다 스위칭을 합니다.
4. 참고
귀하가 내리는 모든 거래 결정은 전적으로 귀하의 책임입니다.
5. 사용방법
초대된 사용자만 사용할 수 있도록 설정이 되어있습니다. 초대를 받을 경우,
지표 하단의 즐겨찾기에 인디케이터 넣기를 누릅니다.
차트화면 상단에 지표를 눌러서 왼쪽탭에 보면 즐겨찾기 탭이 있습니다.
즐겨찾기 탭에서 지표이름을 눌러서 지표를 추가합니다.
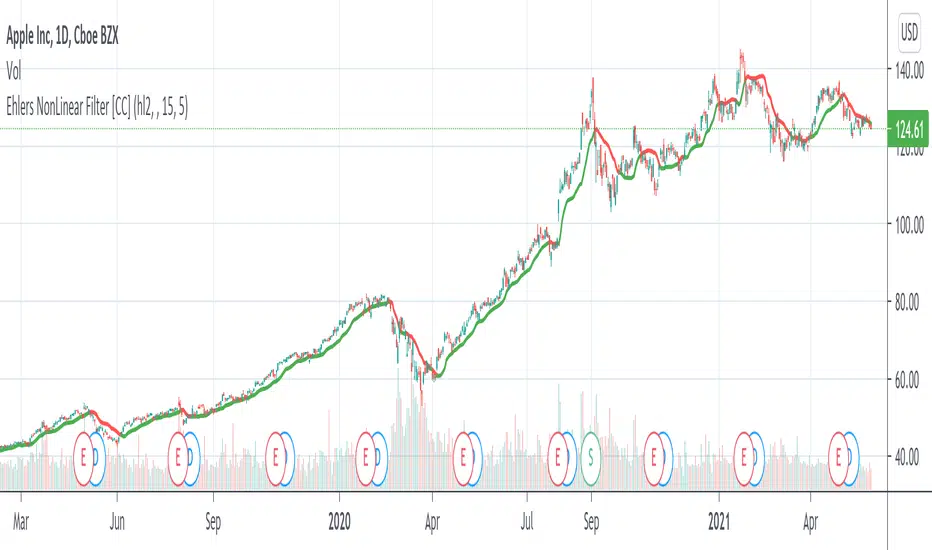
Ehlers NonLinear Filter [CC]The NonLinear Filter was created by John Ehlers and this one of his more unknown filters that work very well as a trendline and moving average. This is one of my favorites along with the instantenous trendlines that he created. Buy when the line turns green and sell when it turns red.
Let me know if there are any other indicators you would like to see me publish scripts for!
Overlay Indicators (EMAs, SMAs, Ichimoku & Bollinger Bands)This is a combination of popular overlay indicators that are used for dynamic support and resistance, trade targets and trend strength.
Included are:
-> 6 Exponential Moving Averages
-> 6 Simple Moving Averages
-> Ichimoku Cloud
-> Bollinger Bands
-> There is also a weekend background marker ideal for cryptocurrency trading
Using all these indicators in conjunction with each other provide great confluence and confidence in trades and price targets.
An explanation of each indicator is listed below.
What Is an Exponential Moving Average (EMA)?
"An exponential moving average (EMA) is a type of moving average (MA) that places a greater weight and significance on the most recent data points. The exponential moving average is also referred to as the exponentially weighted moving average. An exponentially weighted moving average reacts more significantly to recent price changes than a simple moving average (SMA), which applies an equal weight to all observations in the period.
What Does the Exponential Moving Average Tell You?
The 12- and 26-day exponential moving averages (EMAs) are often the most quoted and analyzed short-term averages. The 12- and 26-day are used to create indicators like the moving average convergence divergence (MACD) and the percentage price oscillator (PPO). In general, the 50- and 200-day EMAs are used as indicators for long-term trends. When a stock price crosses its 200-day moving average, it is a technical signal that a reversal has occurred.
Traders who employ technical analysis find moving averages very useful and insightful when applied correctly. However, they also realize that these signals can create havoc when used improperly or misinterpreted. All the moving averages commonly used in technical analysis are, by their very nature, lagging indicators."
Source: www.investopedia.com
Popular EMA lookback periods include fibonacci numbers and round numbers such as the 100 or 200. The default values of the EMAs in this indicator are the most widely used, specifically for cryptocurrency but they also work very well with traditional.
EMAs are normally used in conjunction with Simple Moving Averages.
" What Is Simple Moving Average (SMA)?
A simple moving average (SMA) calculates the average of a selected range of prices, usually closing prices, by the number of periods in that range.
Simple Moving Average vs. Exponential Moving Average
The major difference between an exponential moving average (EMA) and a simple moving average is the sensitivity each one shows to changes in the data used in its calculation. More specifically, the EMA gives a higher weighting to recent prices, while the SMA assigns an equal weighting to all values."
Source: www.investopedia.com
In this indicator, I've included 6 popular moving averages that are commonly used. Most traders will find specific settings for their own personal trading style.
Along with the EMA and SMA, another indicator that is good for finding confluence between these two is the Ichimoku Cloud.
" What is the Ichimoku Cloud?
The Ichimoku Cloud is a collection of technical indicators that show support and resistance levels, as well as momentum and trend direction. It does this by taking multiple averages and plotting them on the chart. It also uses these figures to compute a "cloud" which attempts to forecast where the price may find support or resistance in the future.
The Ichimoku cloud was developed by Goichi Hosoda, a Japanese journalist, and published in the late 1960s.1 It provides more data points than the standard candlestick chart. While it seems complicated at first glance, those familiar with how to read the charts often find it easy to understand with well-defined trading signals."
More info can be seen here: www.investopedia.com
I have changed the default settings on the Ichimoku to suit cryptocurrency trading (as cryptocurrency is usually fast and thus require slightly longer lookbacks) to 20 60 120 30.
Along with the Ichimoku, I like to use Bollinger Bands to not only find confluence for support and resistance but for price discovery targets and trend strength.
" What Is a Bollinger Band®?
A Bollinger Band® is a technical analysis tool defined by a set of trendlines plotted two standard deviations (positively and negatively) away from a simple moving average (SMA) of a security's price, but which can be adjusted to user preferences.
Bollinger Bands® were developed and copyrighted by famous technical trader John Bollinger, designed to discover opportunities that give investors a higher probability of properly identifying when an asset is oversold or overbought."
This article goes into great detail of the complexities of using the Bollinger band and how to use it.
=======
This indicator combines all these powerful indicators into one so that it is easier to input different settings, turn specific tools on or off and can be easily customised.

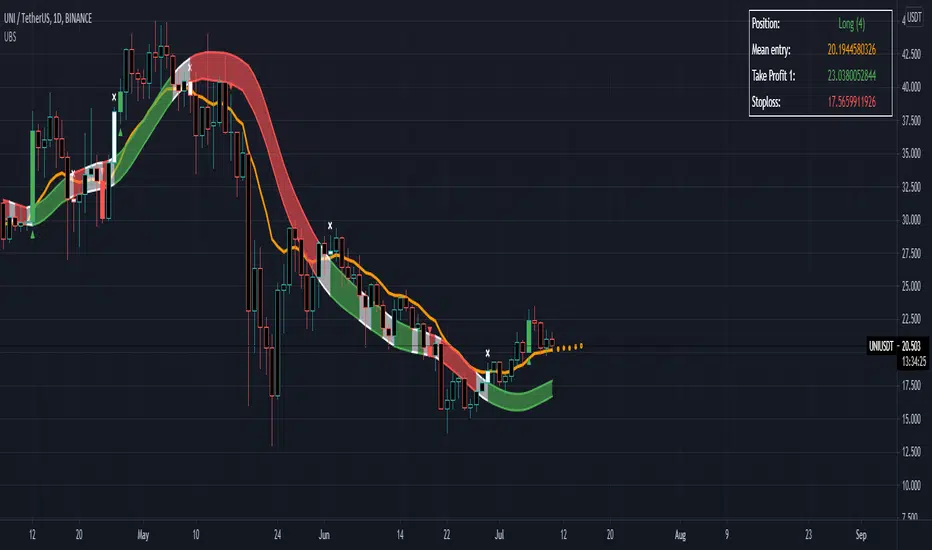
B1rd's Moving AverageThis special moving average is supported by many filters such as the RSI, CCI, Waddah attar, Ichimoku cloud, DMF, TSI and ATR. Combining these indicators will acts as a powerful tool to help us find the direction in trend.
With this indicator, we aim to provide you the best trend trading strategy that includes take profit and stop loss levels.
The fast moving average is named the base line, the slow moving channel is called the secondairy baseline.
Basic instructions:
The strategy prints signals in the form of a green circle in the case of a LONG signal, a red circle in the case of a SHORT signal and white cross above the candle in the case of an exit signal.
Regarding Baselines
There are two Baselines, the primary orange baseline and the secondary which changes color. Both these trendlines are used to determine price trend.
The secondary Baseline consists of a Keltner Channel which is an average True Range of the secondary baseline moving average. The color red on the secondary baseline indicates a bearish trend and the green color indicates a bullish trend. A white secondary baseline indicates a NO TRADE ZONE
Regarding Signals
When price is above both baselines, a LONG signal may be printed by the strategy depending on further verification by other internal calculations.
The LONG signal indicates a bullish trend and allows you to open a long trade. The most optimal way to long the asset is when price is near or at the primary baseline. The qualifier zone also satisfies this criterion, especially when dealing with high momentum in price.
Trend continuation Signals are the color of the relative Trend and they have a diamond shape. They indicate continuation of the trend.
In the case of a SHORT signal, price must be below both baselines. A SHORT signal indicates a bearish trend and indicates opening a short trade. Regarding when to short the position, the same criteria for a long position apply. Namely when price is near or at the baseline or in the qualifier zone.
When an Exit Signal prints, a white cross above the candle for a Long and below the candle for a short, closing of the position in question is recommended.
Regarding stoploss, profit, closing of the trade
The plot tp/sl lines is used to indicate a hard stoploss and take profit level based on an average true range of price.
When a candle closes below both baselines after an active LONG signal or above both baselines after an active SHORT signal, closing the trade is recommended. These criteria serve as secondary exit indicators.
Settings:
The initial setting allows us to select a template from a list of already tested settings. We can change the Template with this setting, make sure to use the corresponding chart and timeframe to get accurate results. More template settings will be updated in the future. Choosing any template setting but custom will override any other setting within the indicator.
Second, we have settings that allow us to input the Smoothing Type and Length on both baselines.
This also manipulates the Keltner Channel surrounding the Secondairy Base Line.
Below this you can find the exit signal option, which will cause the indicator to print exit signals.
The next setting will call upon a forecast on the primary baseline, which could help you determine future support levels based on the selected moving average.
The show Qualifier line option will plot the Entry Qualifier. It will automatically determine trend based on close relative to the Base Line, however you can Override this with the boolean option.
Finally we can enable the Take Profit and Stop Loss options. By default, these will not plot. If you desire to see recommended Take Profit and Stop Loss Levels, you can enable the checkbox in this section.
Strategy
The primary function of this indicator is to detect changes in trend. But it can also be used to supply entry levels, take profit levels and stop loss levels.
Larry Williams Strategies IndicatorThis indicator is a trend following indicator. It plots some of the trend following strategies described by Larry Williams in his book 'Long Term Secrets to Short Term Trading'. Below are types of trend following strategies you can trade using this indicator. These are notes taken directly from Larry Williams' book.
Short Term Low Strategy
Short Term Low - Any daily low with higher lows on each side of it.
Intermediate Term Low – Any short term low with higher short term lows on each side of it.
Long Term Low – Any intermediate term low with higher intermediate term lows on each side of it.
Conceptual pattern for best buying opportunity is when forming an intermediate term low higher than the last intermediate term low.
This setup can be used on all time frames. However since Larry Williams usually trades the daily chart, the daily chart is probably the best timeframe to trade using this strategy.
Entry point – High of the day that has a higher high on the right side of it.
(My interpretation: price crossing above the high of the previous day is the buy signal)
Target – Markets have a strong tendency to rally above the last intermediate term high by the same amount it moved from the last intermediate term high to the lowest point prior to advancing to new highs.
Trailing Stop – Set stop to most recent short term low, move up as new short term lows are formed. Can also use formation of next intermediate term high as an exit point.
A 'run' to the upside is over when price fails to move higher the next day and falls below the prior day's low.
Short Term High Strategy
Short Term High - Any daily high with lower highs on each side of it.
Intermediate Term High – Any short term high with lower short term highs on each side of it.
Long Term High – Any intermediate term high with lower intermediate term highs on each side of it.
Conceptual pattern for best selling opportunity is when forming an intermediate term high lower than the last intermediate term high.
This setup can be used on all time frames. However since Larry Williams usually trades the daily chart, the daily chart is probably the best timeframe to trade using this strategy.
Entry point – Low of the day that has a lower low on the right side of it.
(My interpretation: price crossing below the low of the previous day is the sell short signal)
Target – Markets have a strong tendency to fall below the last intermediate term low by the same amount it moved from the last intermediate term low to the highest point prior to declining to new lows.
Trailing Stop – Set stop to most recent short term high, move down as new short term highs are formed. Can also use formation of next intermediate term low as an exit point.
A 'run' to the downside is over when price fails to move lower the next day and rises above the prior day's high.
Trend Reversals
A trend change from down to up occurs when a short term high is exceeded on the upside, a trend change from up to down is identified by price going below the most recent low.
Can take these signals to make trades, but it is best to filter them with a confirmation or edge such as Trading Day of the Week, Trading Day of the Month, trendlines, etc. to cut down on false signals.
Three Bar High/Low System
Calculate a three bar moving average of the highs and a three bar moving average of the lows.
Strategy is to buy at the at the price of the three bar moving average of the lows - if the trend is positive according to the swing point trend identification technique - and take profits at the three bar moving average of the highs.
Selling is just the opposite. Sell short at the three bar moving average of the highs and take profits at the three bar moving average of the lows, using the trend identification technique above for confirmation.
This strategy can work on any timeframe, but was described as a daytrading system by Larry Williams.

Companion::InsurgentCompanion::Insurgent is a combined indicators strategy. Performances are pretty good on 1D, 4H and 1H timeframes and it can be used on Bitcoin and Altcoin markets.
Mainly, it is a trategy based on Ehlers formulas.
Used indicators:
- Ehlers Instantaneous Trend: trendline analysis;
- Ehlers Super Bandpass Filter: momentum detection;
- EMA: Long/Short time selector.
What the script does:
- determines trendlines combining mulitple indicators;
- automaticlally calculates Take profit and Stop Loss levels;
- permits automation generating Autoview signals (create an alert with {{strategy.order.alert_message}} in message text field to trap Autoview commands;
- supports for margin trading. Spot trading will be added in the future.
BACKTESTING
Backtest is not leveraged. Defaults are set as follow:
Capital: 10000
Percent of equity used for trades: 10%
Commission: 0.18% this is Bitfinex commission on orders
Change them accordingly on how you trade to get a more realistic backtest results.

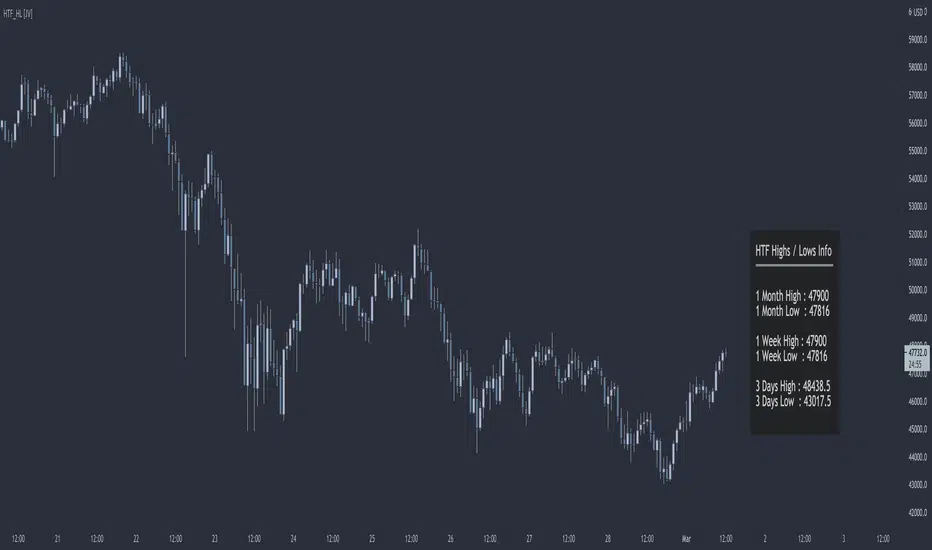
HTF Highs Lows [JV]█ OVERVIEW
This script presents a label with an overview of higher timeframe highs and lows. This can be useful information as we all know that price likes to revisit previous highs and lows area, specially on the higher timeframe.
█ CONCEPTS
This information can be relevant and valuable for various reasons:
Finding horizontal Support and Resistance
Get a better view on Market Structure
Provide some information about Order Flow
TrendLines
...
█ FEATURES
Plots
This script provides the option to show information about 3 timeframes
Each timeframe can be separately shown or hidden
The Y position of the info label can be user defined, based on high or low of the chosen timeframe
The X offset of the info label can be adjusted to the user's liking and the chart resolution
The label color and text color can be user defined
The info label's size can be user defined
█ NOTES
Caveat
The timeframes must be chosen in order of size. Meaning that the highest timeframe should be on top. This is title as such on the info label, but I want to mention it again as it's something to pay attention to.
Repainting
The question that pops up all the time is: Does it repaint ?
I will quote PineCoders on this:
We're pretty sure Wilder was not asked very often if RSI repainted. Why? Because it wasn't in fashion—and largely unnecessary—to ask that sort of question in the 80's. Many traders back then used daily charts only, and indicator values were calculated at the day's close, so everybody knew what they were getting. Additionally, indicator values were calculated by generally reputable outfits or traders themselves, so data was pretty reliable. Today, almost anybody can write a simple indicator, and the programming languages used to write them are complex enough for some coders lacking the caution, know-how or ethics of the best professional coders, to get in over their heads and produce code that does not work the way they think it does.
Briefly: yes, it repaints and no it does not matter.
Simple because we are working with highs and lows on a higher timeframe. So if we get a new high or low within a certain time frame, we want this new high or low to be displayed and, for me, it's not relevant if this information appears when it happens or when the candle closes.
Questions & Suggestions
Questions, suggestions or even a word of thanks are always welcomed in the comments section. I usually answer within the same day.
█ THANKS
A word of thanks to, and I hope I am allowed to use hyperlinks here, LonesomeTheBlue for being an inspiration on coding style and his work on arrays in Pine Script and to lmatl for his support, words of advice and letting me borrow his brain now and then.
DR by Caco MaiaCreated by Brazilian trader Caco Maia,this indicator signals an entry when the price breaks through both a slow and fast average while the TRIX and Stochastic are going in the same direction.
Must be used in conjunction with the market context,e.g. Trendlines,Fibonacci Retracements/Extensions or other indicators.
Filter 1 : The Fast Average must be going up/down.
Filter 2 : There`s a limit to the Slow Average inclination,only allowing entries if the Slow Average is "flat" or in the same direction of the signal.
Filter 3 : Uses both Filters.

Fibonacci Trendlines 20, 50, 100, 200 (SMA)Dört tane simple moving average bir arada. 20, 50, 100, 200 (SMA) hareketli ortalamaları içerir

Price Action - Support & Resistance by DGTSᴜᴘᴘᴏʀᴛ ᴀɴᴅ Rᴇꜱɪꜱᴛᴀɴᴄᴇ , is undoubtedly one of the key concepts of technical analysis
█ Sᴜᴘᴘᴏʀᴛ ᴀɴᴅ Rᴇꜱɪꜱᴛᴀɴᴄᴇ Dᴇꜰɪɴɪᴛɪᴏɴ
Support and Resistance terms are used by traders to refer to price levels on charts that tend to act as barriers, preventing the price of an financial instrument from getting pushed in a certain direction.
A support level is a price level where buyers are more aggressive than sellers. This means that the price is more likely to "bounce" off this level rather than break through it. However, once the price has breached this level it is likely to continue falling until meeting another support level.
A resistance level is the opposite of a support level. It is where the price tends to find resistance as it rises. Again, this means that the price is more likely to "bounce" off this level rather than break through it. However, once the price has breached this level it is likely to continue rising until meeting another resistance level.
A previous support level will sometimes become a resistance level when the price attempts to move back up, and conversely, a resistance level will become a support level as the price temporarily falls back.
█ Iᴅᴇɴᴛɪꜰʏɪɴɢ Sᴜᴘᴘᴏʀᴛ ᴀɴᴅ Rᴇꜱɪꜱᴛᴀɴᴄᴇ
Support and resistance can come in various forms, and the concept is more difficult to master than it first appears. Identification of key support and resistance levels is an essential ingredient to successful technical analysis.
If the price stalls and reverses in the same price area on minimum of two different occasions, then a horizontal line is drawn to show that the market is struggling to move past that area. Those areas are static barriers, one of the most popular forms of support/resistance and are highlighted with horizontal lines.
Repeated test , the more often a support/resistance level is "tested" over an extended period of time (touched and bounced off by price), the more significance is given to that specific level
High volume , the more buying and selling that has occurred at a particular price level, the stronger the support or resistance level is likely to be
Market psychology , plays a major role as traders and investors remember the past and react to changing conditions to anticipate future market movement.
Psychological levels , is a price level that significantly affects the price of an underlying financial instrument. Typically, near round numbers often serve as support and resistance
The following support and resistance related topics are beyond the scope of this study, so they will be mentioned roughly only as a reference for support and resistance concept
Trendlines , Support and resistance levels in trends are dynamic. Throughout an uptrend, levels of support tend to look like a trendline, usually clustering around higher lows. As the price rises, the price where buyers consider the stock to be “too cheap” also changes, which creates new support levels on the way up. The same is also true for resistance levels. In an uptrend, a stock is continuously breaking through perceived resistance levels and making new highs
Moving Averages , is a constantly changing line that smooths out past price data while also allowing the trader to identify support and resistance. In the example Notice how the price of the asset finds support at the moving average when the trend is up, and how it acts as resistance when the trend is down
The Fibonacci Retracement/Extension tool , is a favorite among many short-term traders because it clearly identifies levels of potential support and resistance
Pivot Point Calculations , is another common technical analysis technique, where pivot point is calculated based on the high, low, and closing prices of previous trading session/day and support & resistance levels are projected based on the pivot point, different calculation techniques are available, as presented in this example of an pivot point indicator : PVTvX by DGT
█ Tʀᴀᴅɪɴɢ Bᴀꜱᴇᴅ ᴏɴ Sᴜᴘᴘᴏʀᴛ ᴀɴᴅ Rᴇꜱɪꜱᴛᴀɴᴄᴇ
Once an area or "zone" of support or resistance has been identified, those price levels can serve as potential entry or exit points because, as a price reaches a point of support or resistance, it will do one of two things—bounce back away from the support or resistance level (trading ranges), or violate the price level and continue in its direction (trading breakouts) —until it hits the next support or resistance level
The basic trading method for using support and resistance is to buy near support in uptrends or the parts of ranges or chart patterns where prices are moving up and to sell/sell short near resistance in downtrends or the parts of ranges and chart patterns where prices are moving down. Buying near support or selling near resistance can pay off, but there is no assurance that the support or resistance will hold. Therefore, consider waiting for some confirmation that the market is still respecting that area
Trading breakouts, a breakout is a potential trading opportunity that occurs when an asset's price moves above a resistance level or moves below a support level on increasing volume. The first step in trading breakouts is to identify current price trend patterns along with support and resistance levels in order to plan possible entry and exit points. Once the asset trades beyond the price barrier, volatility tends to increase and prices usually trend in the breakout's direction. Breakouts are such an important trading strategy since these setups are the starting point for future volatility increases, large price swings and, in many circumstances, major price trends. When trading breakouts, it is important to consider the underlying asset's support and resistance levels. The more times an asset price has touched these areas, the more valid these levels are and the more important they become. At the same time, the longer these support and resistance levels have been in play, the better the outcome when the asset price finally breaks out. Asset prices will often move slightly further than we expect them to. This doesn't happen all the time, but when it does it is called a false breakout. Therefore it is important to consider waiting for some confirmation while trading breakouts. It’s also popular for traders to sell 50% of their positions at the resistance level, and hold the rest in anticipation of a breakout above resistance
█ Pʀɪᴄᴇ Aᴄᴛɪᴏɴ - Sᴜᴘᴘᴏʀᴛ & Rᴇꜱɪꜱᴛᴀɴᴄᴇ ʙʏ DGT Sᴛᴜᴅʏ
This experimental study attempts to identify the support and resistance levels. Assumes a simple logic to discover moments where the price is rising or falling consecutively for minimum 3 bars with the condition volume increases on each bar and the last bar’s volume should be bigger than the long term volume moving average. A line will be drawn at the end of the move (highest or lowest, depending on the move direction), the line will be drawn at minimum on the 3rd bar and if condition holds for other consecutive bars the line will switch to 4th, 5th etc bar.
Lines will not be deleted so the historical ones will remain and will emphasis the levels significance when they overlap in feature. Strong levels are more likely to hold and cause the price to move in the other direction, whereas the minor levels may only cause the price to pause and keep moving in the same direction. Determining future levels of support and resistance can drastically improve the returns of a short-term investing strategy
Bar colors will be painted based on the volume of the specific bar to its long term volume moving average. This will help identifying the support and resistance levels significance and emphasis the sings of breakouts
Finally, Volume spikes will be marked on top of the price chart. A high volume usually indicates more interest in the security and the presence of institutional traders. However, a rapidly rising price in an uptrend accompanied by a huge volume may be a sign of exhaustion. Traders usually look for breaks of support and resistance to enter positions. When security break critical levels without volume , you should consider the breakout suspect and prime for a reversal off the highs/lows. Volume spikes are often the result of news-driven events. Volume spike will often lead to sharp reversals since the moves are unsustainable due to the imbalance of supply and demand
A good example with many support and resistance concepts observed on a stock chart and detected by the study
Settings:
Length of volume moving average, where volume moving average is used to detect support and resistance levels, is used as reference to compare with threshold values for volume spikes and colors of the bars
Hint, to get more historical lines scrolling chart to left will enable visualization of them. Please note they may appear to much all 500 line limit is used 😉
Special thanks to @HEMANT Telegram user, for his observations and suggestions
Disclaimer:
Trading success is all about following your trading strategy and the indicators should fit within your trading strategy, and not to be traded upon solely
The script is for informational and educational purposes only. Use of the script does not constitute professional and/or financial advice. You alone have the sole responsibility of evaluating the script output and risks associated with the use of the script. In exchange for using the script, you agree not to hold dgtrd TradingView user liable for any possible claim for damages arising from any decision you make based on use of the script

CroSel Indicator ToolboxA value-packed or all-in-one indicator. The main one is probably the algorithmic signal. I have noticed a few trading groups that rely solely on their algo trading signals. I have derived my own using MACD . I find that it works better or just as good as what I have seen. The others indicators are also very powerful and could even be used on a stand alone basis. There are different variations included. I wanted to provide 10x the value at whatever price I would put on this. However I think I've provided at least 20x the expected value. What I like about this is that with more signals, we can visually see confluence. In turn, that should give us traders confidence. The follow is a list of all the indicators I've included so far:
How to use (for all indicators): I suggest using these trade signals as confluence for the main algorithmic trade signals. Aside from MACD and RSI , there are a limited number of signals, but they will all show up within the most recent bars that have passed. Buy when green/lime and sell when red/fuchsia. I suggest experimenting with the the different modes to see what you believe works best for your trading style.
I prefer to use the last signal provided, but I also like to rely on looking at signals as a group, if they are all rising, I'm bullish ; if they are all falling, I'm bearish .
Note on Color Scheme: Red/Fuchsia color means to short/sell and green/lime color means to long/buy.
- Algorithmic signal - provides trade signals. How to use: When there is a green arrow up, it means you should go long. When there is a red arrow down, it means you should exit your long or short sell. If the arrow is lime colored, it means the stock is trending upwards and if the arrow is fuchsia, it means the stock is trending downwards.
- Band and hit count - provides bands to track volatility , as well as tracks the number of times the price hits the upper or lower bands. It also provides candle-to-candle slope as a %. How to use: You can use this to play the odds in your favor. For example: if a stock hits the upper bands 13 times during the morning, and then hits the lower bands 4 times afterwards and then moves upwards away from the lower bands towards the middle of the bands, from here we may be able to say that since 13 is greater than 4, that the stock price may rise again and start hitting the upper bands. Another way I like to use this indicator, is if a stock hits the upper bands more than 16 to 20 times, I like to exit the trade before it has a chance to drop. Lastly, there are zones where a stock price will go above or below 100% or 0% respectively. For example, a stock starts to hit the 110% area of the bands. This could be an excellent time to sell/short the stock.
- Volume surge - provides signals of when volume is increasing/decreasing depending on the color and direction. How to use: Gives you confidence that the price will rise higher/lower.
- EMA 5 & 10 - It is the exponential moving average of the past 5 or 10 bars. It will be either be red or green depending on the slope. How to use: I like to use it as if it were a trend line (which I like to call slanted support/resistance ). For example, if I buy a stock and it falls below EMA 10 I will generally sell the stock, and if it rises past EMA 5 I will generally buy the stock.
- Background color - Background color shows whether the stock is bullish or bearish . If it is green/red, it is slightly bullish / bearish respectively. If it is lime/fuchsia, it is very bullish / bearish respectively. How to use: Take long positions if the background color is greenish(i.e. green/lime) and take short position if the background color is reddish (i.e.red/fuchsia). Please bear in mind, background color will look slightly different if you are already coloring the extended hour session backgrounds.
- Channel Breakout Lines - These lines show the rigid channel that the stock will travel through. How to use: Watch a stock that is in a channel, if it is going up, watch the red dotted line which extends into the future,
if it the stock falls below that previous red dotted line you should sell/short the stock. If a stock is going down, watch the green dotted line, and if the stock goes past the previous green dotted line, you should buy.
- MACD - Moving Average Convergence and Divergence provides trade signals. How to use: 1 turns it off. 2 provides the classic, buy and sell signals based on when the MACD line crosses over or under the signal line. 3 provides faster trade
signals. 4 provides the algorithmic signals. All variations can change according to Algo sensitivity and Algo Signal speed since the algo uses MACD as it's base.
- RSI - Relative Strength Index provides trade signals. How to use: 1 turn it off, 2 turns on and provides the buy and sell signals for above 70 and below 30 RSI respectively. 3 and 4 provide slow and fast RSI trade signals respectively.
4 is my favorite and can be used to provide confluence.
- VWAP - Volume Weighted Average Price . a 2 value is the regular vwap line. A value of 3 or 4 will show that the VWAP line or fill from line until the close is colored
according to slope of EMA 5. How to use: Buy below the VWAP if it shows some support and sell/Short above if it shows some resistance. When the color is red it will show the
- ROC - Rate of Change trade signals. Take note of the circle shaped symbols. Normal mode shows you when the rate of change has crossed the zero line; this can be a very bullish or bearish signal. 3rd mode will gives signals based on whether ROC has stopped making new highs or new lows. 4th mode gives the fastest signals, making it the least risky.
- MFI - Money Flow Index trade Signals. Take note of the Long arrow symbols. Modes work as described.
- BOP - Balance of power trade signals. Take note of the square symbols. The simple mode provides only the biggest trade signals, and the complex mode provides both the biggest and smallest trade signals.
- OBV - A running total of positive and negative volume . Take note of the diamond shaped symbols. Slow signals are really slow. Fast signals are really fast. Use according to your trading speed preference.
- Stochastics - A momentum oscillator that provides trade signals. Take note of the plus shaped symbols and factor them into your judgement on when to trade.
- CCI - Commodity Channel Index trade signals based on momentum. Take note of the X symbols.
- CMF - Chaikin Money Flow trade signals. Take note of the flag symbols.
- ADX - ADX is a component of the Directional Movement System developed by Welles Wilder. When it says to buy, I suggest that you go long, and then before it says to sell you try to sell. And then you can also try to go long before it says to buy. As soon as I see buy, I want to be in the stock and conversely, when I see sell I want to be out of it.
- Price-Volume Divergence - This indicator is a candle by candle indicator which shows that if volume is rising and price is falling, then there is bullish divergence , Conversely if price is rising and volume is falling there is bearish divergence. This a leading indicator.
- Ichimoku Clouds - This indicator just shows the clouds in the Ichimoku cloud system. It can be used to buy under the clouds and sell over the clouds. It can also be used as a possible support/resistance level during an uptrend/downtrend respectively.
- PSAR - Parabolic Stop and Reverse . Denotes uptrends/downtrends, by multiple dotted lines. You can use it by buying/selling when it breaks out of a downtrend/uptrend respectively. Or you can use it to sell/buy during an uptrend/downtrend respectively. Warning: it is generally slow. I find that it's very reliable from a 5 minute perspective.
- Fibonacci levels - People generally use Fibonacci levels for retracement for when a stock pulls back. I personally like to use it as a predictive tool along with looking at the slope. If the slope is negative/positive and moving away/near from 50% line then, I would be bearish / bullish respectively.
- Moving Average ( EMA and SMA ) lines - Exponential moving average and Smooth moving average lines. EMA lines move faster and SMA lines move slower. I like to use these lines as trend lines which can tell me if there is an uptrend or downtrend. The strength of the trend is shown by the distance away from the slowest EMA / SMA lines. I like to sell when it's far above the trendline, and buy when it's closer to the trendline. Be weary of the price crossing trendlines .
- Information Panel - (Price location, Trend Strength, Volatilty Ratio, Current State, Reversal/Continuation Odds): Mode 2 will give you basic price location info. Mode 3 is my favorite and will give you the most info. and Mode 4 will give you the Schwager volatility ratio which can help with stock selection; the higher the ratio, the more movement can be expected.
- Support & Resistance levels - Horizontal dotted lines which show the stock price and where it experiences support/resistance . Can be used in many ways. I like to use it by counting the number of support/resistance lines provided and if support lines exceed resistance lines, I will be more likely to go long.
- Candle Colors - Overlay a color onto the Candles. Note: I encourage the use of Heiken Ashi which helps a lot with low volume candles. Candles can be colored according to their location within the bands, and also according to a trailing stop loss based on Average True Range . Buy low, sell high for the location mode and for the stop loss mode, selling/buying is encouraged when the bars go completely red/green respectively.
- Linear Regression - Draws a (black) line of best fit, and shows 2 standard deviations away from the line of best fit above(red) and below(green). I suggest buying/selling below/above the line of best fit respectively. Strong buys or sells generally occur below or above the standard deviation lines respectively.

Hullk Autobot
HULLK AUTOBOT
• Long entry positions
• Profit targets
• Stop loss targets
Description
The Fast Signal Line is an extremely fast and smooth moving average indicator, designed to eliminate
the lag typically associated with traditional moving average indicators.
When the price is trending upward the Fast Signal Line is colored light grey then turns orange when
price is trending downward.
How to Trade
It is good practice to assess multiple timeframes to ensure you are mindful of the larger picture. The
15 minute and 4-hour charts are worthy of note.
In addition to displaying the current macro trend, the Fast Signal Line can also be used for judging
entries and exits from trades.
Aggressive traders may choose to trade based on the first touch of the Fast Signal Line whereas
conservative traders may wait for the signal line to be broken and established as a line of support or
resistance before taking action.
Indicator Configuration
The Fast Signal Line’s display and colors can be changed by modifying the ‘Fast Signal’ options in
the indicator’s style settings;
Volume Line
Description
The Volume Line uses short-term historic volume data to determine the balance between demand
and supply.
When volume is supporting price the Volume Line is colored yellow then turns red when the volume is
rejecting the price.
How to Trade
While the Volume Line can indicate support and resistance levels, it is best used to confirm bias
when using the Fast Trend Line indicator to enter or exit trades and can also be used by traders for
stop-loss or take profit entries.
Indicator Configuration
The Volume Line’s display and colors can be changed by modifying the ‘Volume’ options in the
indicator’s style settings;
Trend Line
Description
The Trend Line is a Weighted Moving Average indicator based on a fixed period and is used to
identify the current trend of the market.
When supporting the price, the Trend Line is colored green then turns red when rejecting the price.
How to Trade
Timeframes of 4H and above are best used to determine the current trends, while shorter timeframes
can be used for entering and exiting trades when the trendline is turning in the relevant direction.
Indicator Configuration
The Trend Line’s display and colors can be changed by modifying the ‘Volume’ options in the
indicator’s style settings;
Whales Volume Line
Description
The Whales Volume Line uses long-term historic volume data to determine the balance between
demand and supply dictated by large/institutional traders in the market.
When volume is supporting price the Volume Line is colored yellow then turns red when the volume is
rejecting the price.
How to Trade
While the Whale Volume Line can indicate support and resistance levels, it is best used to confirm
bias when using the Fast Trend Line indicator to enter or exit trades and can also be used by traders
for stop loss or take profit entries.
Indicator Configuration
The Whales Volume Line’s display and colors can be changed by modifying the ‘Whales Volume’
options in the indicator’s style settings;
Trendline Direction Line
Description
The Direction Line is a Weighted Moving Average indicator based on a longer period than the Trend
Line and is used to identify the current direction of the market.
The Direction Line indicator is colored purple when the market direction is up trending and red when
downtrend.
How to Trade
Timeframes of 4H and above are best used to determine current trend, while shorter timeframes
can be used for entering and exiting trades when the trendline is turning in the relevant direction.
Indicator Configuration
The Trendline Direction’s display and colors can be changed by modifying the ‘Trendline Direction’
options in the indicator’s style settings;
Channel Line
Description
The Channel Line is a Least Squares Moving Average indicator based on a fixed period and is used as
a crossover signal to identify bullish or bearish trends ahead of traditional simple or exponential
moving averages.
The Channel Line indicator is colored cyan when the market direction is up trending and red when
downtrend.
How to Trade
When the Channel Line changes to an uptrend along with a recovery in price, traders can use this as a
signal to enter a long position. If the signal changes to a downtrend along with a fall in price, traders
can use this to enter a short position.
Indicator Configuration
The Channel Line’s display and colors can be changed by modifying the ‘Channel’ options in the
indicator’s style settings;
Dip & Pop Signals
Description
Dip and Pop signals occur when the price is likely to make a counter-trend movement before continuing
its direction.
In a bullish trend, a Dip signal suggests that price will move down to test support before continuing,
whereas a Pop signal suggests that price will move up. In a bearish trend, a Pop signal suggests that
price will move up to test resistance before continuing, whereas a Dip signal would suggest price is
likely to continue the trend.
How to Trade
Dip and Pop signals should be used as notification for preparation rather than a call to action as the price
can move unpredictably during volatility.
Indicator Configuration
The Dip & Pop’s display and colors can be changed by modifying the ‘PoP’ & ‘DIP’ options in the
indicator’s style settings;
Entry & Exit Signals
Description
Entry and Exit Signals are indications of when to open and close trades but should be used in
conjunction with other indicators to interpret their meaning.
How to Trade
While Entry and Exit signals can be interpreted as simple long and short entries, their meaning does
change based on trend circumstance. An Entry signal is typically printed price is starting to see a
positive reaction after a drop.
When the Fast Signal, Trend, and Trend Direction lines are indicating an upward trend an Entry signal
signifies a good place to enter a long or exit a short position. However, if the lines are not suggesting
an upward trend then a long signal indicates that any long order should be exited as any new long
orders in this scenario are risky as you would be opening a position at resistance.
Likewise, when indicator lines are indicating a downward trend and an Exit signal is received this
signifies a good place to enter a short or exit a long position. However, if the signal is against the
trendlines then this is a riskier short into support.
Indicator Configuration
The Entry & Exit’s display and colors can be changed by modifying the ‘Entry’ & ‘Exit’ options in the
indicator’s style settings;
If you have any questions or are looking for access please send me a private message.
Thx for your time and support

DMT 369 DRAGRONFLY StudyDragonfly Study version plus statistics panel
Successful traders trade with a fixed plan and without emotion, but this a lot harder than many new traders think. Many never master this skill and suffer continual drawdowns on their accounts as they overtrade high leverage positions in volatile markets.
ĐΜŦ Autobot resolves this issue by taking the human element out of the equation, allowing full automation of trades using TradingView alerts to trigger your favourite trading bot, such as Alertatron or 3Commas.
Being a Trend Reversal Indicator based on Volatility & Average True Range , ĐΜŦ Autobot is designed to identify spots in the market that offer suitable scalp and swing trade opportunities.
Due to popular demand we have expanded our ĐΜŦ Autobot product line to include the new ĐΜŦ Autobot Dragonfly 3-6-9 Edition which combines DMT with 3-6-9 Vortex mathematics, our Titan indicator and a multi-ladder scalping strategy to ensure you maintain a preferable average entry when price action moves against your position.
Indicator View
It its default state the DMT Autobot Dragonfly indicator displays key signal information, such as:
• Support & resistance range lines
• Titan Body Small & Large Time Frame lines
• Long & Short entry positions
• Long & Short position ladders
• Profit targets
Dragonfly displays a range between resistance (upper line) and support (lower line) on the chart.
Once the price is granted support in the range the lower line will turn green. As price action develops it will make repeated attempts to test support. If support holds price will attempt to test the resistance line (red).
When resistance is broken and the price is above the upper line, the line will turn blue confirming the bullish momentum and provide a potential buy opportunity.
Price action will make attempts to test the upper line as support and will keep rising while support is granted.
Once support is lost the upper line will become red once more. As price action develops it will make repeated attempts to test resistance. If resistance holds, the price will attempt to test the support line (green).
When support is broken and the price goes below the lower line, the line will turn red confirming the bearish momentum and provide a potential selling opportunity.
Price action will make attempts to test the lower line as resistance and will keep dropping while resistance is granted.
Titan Body
The Titan Body Small & Large time frame options in the indicator add additional trendlines to the chart to provide further clarity and confirmation to the Support & Resistance range indication.
Once price is granted support by the Small Time Frame trend line the line will turn green. As price action develops it will make repeated attempts to test the Small Time Frame support. Once the price is below the Small Time Frame trend line , the line will turn red and can act as resistance in a trend reversal.
When price is granted support by the Large Time Frame trend line the line will turn cyan. As price action develops it will make repeated attempts to test the Large Time Frame support. Once the price is below the Large Time Frame trend line , the line will turn orange and can act as resistance in a trend reversal.
The Titan Body enabled and customized in the indicator’s style settings,
Alert indicators
DMT Autobot Dragonfly Edition generates signals that can be used to scalp trade a volatile asset.
Signals are enabled and customized in the indicator’s input settings Additional options can be found in the options, but it is recommended that these are left at the default, as shown below. The indicator generates many
Entry and Profit levels can be disabled or customized in the indicator’s style settings,
Tradingview Alerts
Using Tradingview alerts, DMT Autobot Dragonfly signals can be used to trigger a trading bot.
To trigger a long or short position, set the Tradingview Alert Condition to DMT 369 Dragonfly and select the long or short option.
It is recommended that long or short positions are configured to trigger Once Per Bar Close
Ladders can also be triggered using alerts. To trigger a ladder order, set the Tradingview Alert Condition to DMT 369 Dragonfly and select the appropriate Long or Short ADD option that is to be triggered by the relevant values defined in the indicator’s configuration.
It is recommended that ladder orders are configured to trigger Once Per Bar,
To trigger a take profit order, set the Tradingview Alert Condition to DMT 369 Dragonfly and select the Long or Short TP option that is to be triggered by the relevant values defined in the indicator’s configuration.
Take profit orders can be configured as Once Per Bar Close or Once Per Minute.
If you wish to trigger a take profit signal immediately when the indicator’s defined take profit value is achieved, then use the Once Per Bar option.
Selecting Once Per Bar Close to generate a take profit signal is a gamble as the candle may close far away from the defined profit target – positive or negative.
While stops can be used, they are not applicable to the recommended ladder strategy.
Ladder Strategy
The DMT Autobot Dragonfly indicator always turns an underwater position into a win by utilizing a ladder strategy.
By using the recommended defaults, the indicator will trigger ladder orders at 3%, 6% & 9% using increasing order sizes,
Order sizes increase exponentially to ensure a good average price is maintained. If you are not using DMT Autobot Dragonfly signals to trigger ladder or take profit orders, please ensure your trading bot is configured to recalculate the new ladder entry and profit target based on the new average position entry price as each ladder is filled.
If you are using DMT Autobot Dragonfly on a leveraged asset, please ensure the leverage position is configured suitably so that your position is not liquidated if the price rapidly moves against you.
If u are looking for more information or access to the script please private msg me in trading view chat thx for support

DMT 369 DRAGRONFLY STRATSuccessful traders trade with a fixed plan and without emotion, but this a lot harder than many new traders think. Many never master this skill and suffer continual drawdowns on their accounts as they overtrade high leverage positions in volatile markets.
ĐΜŦ Autobot resolves this issue by taking the human element out of the equation, allowing full automation of trades using TradingView alerts to trigger your favourite trading bot, such as Alertatron or 3Commas.
Being a Trend Reversal Indicator based on Volatility & Average True Range, ĐΜŦ Autobot is designed to identify spots in the market that offer suitable scalp and swing trade opportunities.
Due to popular demand we have expanded our ĐΜŦ Autobot product line to include the new ĐΜŦ Autobot Dragonfly 3-6-9 Edition which combines DMT with 3-6-9 Vortex mathematics, our Titan indicator and a multi-ladder scalping strategy to ensure you maintain a preferable average entry when price action moves against your position.
Indicator View
It its default state the DMT Autobot Dragonfly indicator displays key signal information, such as:
• Support & resistance range lines
• Titan Body Small & Large Time Frame lines
• Long & Short entry positions
• Long & Short position ladders
• Profit targets
Dragonfly displays a range between resistance (upper line) and support (lower line) on the chart.
Once the price is granted support in the range the lower line will turn green. As price action develops it will make repeated attempts to test support. If support holds price will attempt to test the resistance line (red).
When resistance is broken and the price is above the upper line, the line will turn blue confirming the bullish momentum and provide a potential buy opportunity.
Price action will make attempts to test the upper line as support and will keep rising while support is granted.
Once support is lost the upper line will become red once more. As price action develops it will make repeated attempts to test resistance. If resistance holds, the price will attempt to test the support line (green).
When support is broken and the price goes below the lower line, the line will turn red confirming the bearish momentum and provide a potential selling opportunity.
Price action will make attempts to test the lower line as resistance and will keep dropping while resistance is granted.
Titan Body
The Titan Body Small & Large time frame options in the indicator add additional trendlines to the chart to provide further clarity and confirmation to the Support & Resistance range indication.
Once price is granted support by the Small Time Frame trend line the line will turn green. As price action develops it will make repeated attempts to test the Small Time Frame support. Once the price is below the Small Time Frame trend line, the line will turn red and can act as resistance in a trend reversal.
When price is granted support by the Large Time Frame trend line the line will turn cyan. As price action develops it will make repeated attempts to test the Large Time Frame support. Once the price is below the Large Time Frame trend line, the line will turn orange and can act as resistance in a trend reversal.
The Titan Body enabled and customized in the indicator’s style settings,
Alert indicators
DMT Autobot Dragonfly Edition generates signals that can be used to scalp trade a volatile asset.
Signals are enabled and customized in the indicator’s input settings Additional options can be found in the options, but it is recommended that these are left at the default, as shown below. The indicator generates many
Entry and Profit levels can be disabled or customized in the indicator’s style settings,
Tradingview Alerts
Using Tradingview alerts, DMT Autobot Dragonfly signals can be used to trigger a trading bot.
To trigger a long or short position, set the Tradingview Alert Condition to DMT 369 Dragonfly and select the long or short option.
It is recommended that long or short positions are configured to trigger Once Per Bar Close
Ladders can also be triggered using alerts. To trigger a ladder order, set the Tradingview Alert Condition to DMT 369 Dragonfly and select the appropriate Long or Short ADD option that is to be triggered by the relevant values defined in the indicator’s configuration.
It is recommended that ladder orders are configured to trigger Once Per Bar,
To trigger a take profit order, set the Tradingview Alert Condition to DMT 369 Dragonfly and select the Long or Short TP option that is to be triggered by the relevant values defined in the indicator’s configuration.
Take profit orders can be configured as Once Per Bar Close or Once Per Minute.
If you wish to trigger a take profit signal immediately when the indicator’s defined take profit value is achieved, then use the Once Per Bar option.
Selecting Once Per Bar Close to generate a take profit signal is a gamble as the candle may close far away from the defined profit target – positive or negative.
While stops can be used, they are not applicable to the recommended ladder strategy.
Ladder Strategy
The DMT Autobot Dragonfly indicator always turns an underwater position into a win by utilizing a ladder strategy.
By using the recommended defaults, the indicator will trigger ladder orders at 3%, 6% & 9% using increasing order sizes,
Order sizes increase exponentially to ensure a good average price is maintained. If you are not using DMT Autobot Dragonfly signals to trigger ladder or take profit orders, please ensure your trading bot is configured to recalculate the new ladder entry and profit target based on the new average position entry price as each ladder is filled.
If you are using DMT Autobot Dragonfly on a leveraged asset, please ensure the leverage position is configured suitably so that your position is not liquidated if the price rapidly moves against you.
If u are looking for more information or access to the script please private msg me in trading view chat thx for support

Companion::DivergentCompanion::Divergent is a combined indicators strategy optimized for Bitcoin Markets and tested on Bitfinex.
Mainly, it is an Ichimoku based strategy.
Used indicators:
- Ichimoku (displayed on chart): trendline analysis;
- Double Hull MA (displayed on chart): trendline analysis;
- MACD (not displayed): confirmative/momentum detection;
- CCI (not displayed): confirmative/momentum detection;
- ATR: used toghether with Ichimoku to determine Stop Loss/Take Profit levels;
- VWMA: For implementing trailing stop orders based on volumes.
What the script does:
- determines trendlines combining mulitple indicators;
- automaticlally calculates Take profit and Stop Loss levels;
- permits automation generating Autoview signals;
- supports for margin trading. Spot trading will be added in the future.
It can be used on 1D or 1H timeframes but it can be adapted for other time frames tweaking the parameters. I used it a lot on Bitfinex on 1H timeframes. Please check parameters: if you will use the strategy on D or higher timeframes, the "Legacy Chikou analysis" option should be checked.
BACKTESTING
Backtest is not leveraged. Defaults are set as follow:
Capital: 10000
Percent of equity used for trades: 10%
Commission: 0.18% this is Bitfinex commission on orders
Change them accordingly on how you trade to get a more realistic backtest results.

Aggregate CandlesThis script creates candles based on an aggregated Index price from various exchange tickers. A lot of exchanges have specific flash crash wicks, missing data, erraticness compared to other exchanges particularly in their first few months, this is an attempt to clean up the price history, be it for TA ( trendlines , S/R etc.) or use in algos or other indicators, without reliance on one exchange. It uses the new Array functionality to generate median and averages, and is entirely original work. This particular version is a generic version of the BTC version. Please read the header before use, and if you do wish to use the code, please ask permission first.
