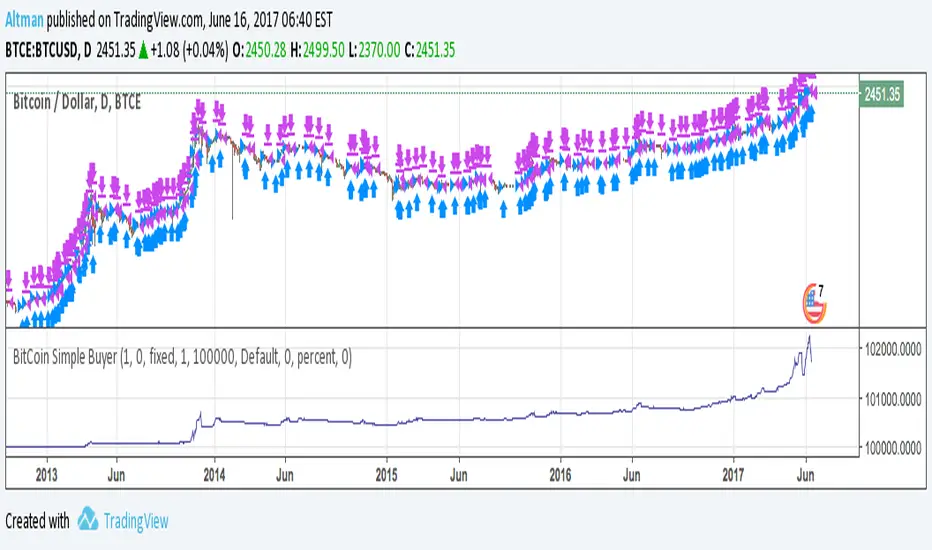
BitCoin Simple BuyerMany people asking me: How to find the right time to exit BitCoin long position? First, that comes to mind is Do Not use simple Buy-and-Hold strategy, but make short-term trades. Here is the simple algorithm for D1 or 4H timeframes.
在腳本中搜尋"bitcoin"
Bitcoin Halving Strategy
A systematic, data-driven trading strategy based on Bitcoin's 4-year halving cycles. This strategy capitalizes on historical price patterns that emerge around halving events, providing clear entry and exit signals for both accumulation and profit-taking phases.
🎯 Strategy Overview
This automated trading system identifies optimal buy and sell zones based on the predictable Bitcoin halving cycle that occurs approximately every 4 years. By analyzing historical data from all previous halvings (2012, 2016, 2020, 2024), the strategy pinpoints high-probability trading opportunities.
📊 Key Features
Automated Signal Generation: Buy signals at halving events and DCA zones, sell signals at profit-taking peaks
Multi-Phase Analysis: Tracks Accumulation, Profit Taking, Bear Market, and DCA phases
Visual Dashboard: Real-time performance metrics, phase countdown, and position tracking
Backtesting Enabled: Comprehensive historical performance analysis with configurable parameters
Risk Management: Built-in position sizing, slippage control, and optional short trading
⚙️ Strategy Logic
Buy Signals:
At halving event (Week 0)
DCA zone entry (Week 135 post-halving)
Sell Signals:
Profit-taking zone (Week 80 post-halving)
Optional short position entry for advanced traders
📈 Performance Highlights
Captures major bull run profits while avoiding prolonged bear markets
Clear visual indicators for all phases and transitions
Customizable timing parameters for personalized risk tolerance
Professional dashboard with live P&L, win rate, and drawdown metrics
🛠️ Customization Options
Adjustable phase timing (profit start/end, DCA timing)
Position sizing control
Enable/disable short trading
Visual customization (colors, labels, zones)
Table positioning and transparency
⚠️ Risk Disclosure
Past performance does not guarantee future results. This strategy is based on historical halving cycle patterns and should be used as part of a comprehensive trading plan. Always conduct your own research and consider your risk tolerance before trading.
💡 Ideal For
Long-term Bitcoin investors seeking systematic entry/exit points
Swing traders capitalizing on multi-month trends
Portfolio managers implementing cycle-based allocation strategies

Bitcoin CME-Spot Z-Spread - Strategy [presentTrading]This time is a swing trading strategy! It measures the sentiment of the Bitcoin market through the spread of CME Bitcoin Futures and Bitfinex BTCUSD Spot prices. By applying Bollinger Bands to the spread, the strategy seeks to capture mean-reversion opportunities when prices deviate significantly from their historical norms
█ Introduction and How it is Different
The Bitcoin CME-Spot Bollinger Bands Strategy is designed to capture mean-reversion opportunities by exploiting the spread between CME Bitcoin Futures and Bitfinex BTCUSD Spot prices. The strategy uses Bollinger Bands to detect when the spread between these two correlated assets has deviated significantly from its historical norm, signaling potential overbought or oversold conditions.
What sets this strategy apart is its focus on spread trading between futures and spot markets rather than price-based indicators. By applying Bollinger Bands to the spread rather than individual prices, the strategy identifies price inefficiencies across markets, allowing traders to take advantage of the natural reversion to the mean that often occurs in these correlated assets.
BTCUSD 8hr Performance
█ Strategy, How It Works: Detailed Explanation
The strategy relies on Bollinger Bands to assess the volatility and relative deviation of the spread between CME Bitcoin Futures and Bitfinex BTCUSD Spot prices. Bollinger Bands consist of a moving average and two standard deviation bands, which help measure how much the spread deviates from its historical mean.
🔶 Spread Calculation:
The spread is calculated by subtracting the Bitfinex spot price from the CME Bitcoin futures price:
Spread = CME Price - Bitfinex Price
This spread represents the difference between the futures and spot markets, which may widen or narrow based on supply and demand dynamics in each market. By analyzing the spread, the strategy can detect when prices are too far apart (potentially overbought or oversold), indicating a trading opportunity.
🔶 Bollinger Bands Calculation:
The Bollinger Bands for the spread are calculated using a simple moving average (SMA) and the standard deviation of the spread over a defined period.
1. Moving Average (SMA):
The simple moving average of the spread (mu_S) over a specified period P is calculated as:
mu_S = (1/P) * sum(S_i from i=1 to P)
Where S_i represents the spread at time i, and P is the lookback period (default is 200 bars). The moving average provides a baseline for the normal spread behavior.
2. Standard Deviation:
The standard deviation (sigma_S) of the spread is calculated to measure the volatility of the spread:
sigma_S = sqrt((1/P) * sum((S_i - mu_S)^2 from i=1 to P))
3. Upper and Lower Bollinger Bands:
The upper and lower Bollinger Bands are derived by adding and subtracting a multiple of the standard deviation from the moving average. The number of standard deviations is determined by a user-defined parameter k (default is 2.618).
- Upper Band:
Upper Band = mu_S + (k * sigma_S)
- Lower Band:
Lower Band = mu_S - (k * sigma_S)
These bands provide a dynamic range within which the spread typically fluctuates. When the spread moves outside of these bands, it is considered overbought or oversold, potentially offering trading opportunities.
Local view
🔶 Entry Conditions:
- Long Entry: A long position is triggered when the spread crosses below the lower Bollinger Band, indicating that the spread has become oversold and is likely to revert upward.
Spread < Lower Band
- Short Entry: A short position is triggered when the spread crosses above the upper Bollinger Band, indicating that the spread has become overbought and is likely to revert downward.
Spread > Upper Band
🔶 Risk Management and Profit-Taking:
The strategy incorporates multi-step take profits to lock in gains as the trade moves in favor. The position is gradually reduced at predefined profit levels, reducing risk while allowing part of the trade to continue running if the price keeps moving favorably.
Additionally, the strategy uses a hold period exit mechanism. If the trade does not hit any of the take-profit levels within a certain number of bars, the position is closed automatically to avoid excessive exposure to market risks.
█ Trade Direction
The trade direction is based on deviations of the spread from its historical norm:
- Long Trade: The strategy enters a long position when the spread crosses below the lower Bollinger Band, signaling an oversold condition where the spread is expected to narrow.
- Short Trade: The strategy enters a short position when the spread crosses above the upper Bollinger Band, signaling an overbought condition where the spread is expected to widen.
These entries rely on the assumption of mean reversion, where extreme deviations from the average spread are likely to revert over time.
█ Usage
The Bitcoin CME-Spot Bollinger Bands Strategy is ideal for traders looking to capitalize on price inefficiencies between Bitcoin futures and spot markets. It’s especially useful in volatile markets where large deviations between futures and spot prices occur.
- Market Conditions: This strategy is most effective in correlated markets, like CME futures and spot Bitcoin. Traders can adjust the Bollinger Bands period and standard deviation multiplier to suit different volatility regimes.
- Backtesting: Before deployment, backtesting the strategy across different market conditions and timeframes is recommended to ensure robustness. Adjust the take-profit steps and hold periods to reflect the trader’s risk tolerance and market behavior.
█ Default Settings
The default settings provide a balanced approach to spread trading using Bollinger Bands but can be adjusted depending on market conditions or personal trading preferences.
🔶 Bollinger Bands Period (200 bars):
This defines the number of bars used to calculate the moving average and standard deviation for the Bollinger Bands. A longer period smooths out short-term fluctuations and focuses on larger, more significant trends. Adjusting the period affects the responsiveness of the strategy:
- Shorter periods (e.g., 100 bars): Makes the strategy more reactive to short-term market fluctuations, potentially generating more signals but increasing the risk of false positives.
- Longer periods (e.g., 300 bars): Focuses on longer-term trends, reducing the frequency of trades and focusing only on significant deviations.
🔶 Standard Deviation Multiplier (2.618):
The multiplier controls how wide the Bollinger Bands are around the moving average. By default, the bands are set at 2.618 standard deviations away from the average, ensuring that only significant deviations trigger trades.
- Higher multipliers (e.g., 3.0): Require a more extreme deviation to trigger trades, reducing trade frequency but potentially increasing the accuracy of signals.
- Lower multipliers (e.g., 2.0): Make the bands narrower, increasing the number of trade signals but potentially decreasing their reliability.
🔶 Take-Profit Levels:
The strategy has four take-profit levels to gradually lock in profits:
- Level 1 (3%): 25% of the position is closed at a 3% profit.
- Level 2 (8%): 20% of the position is closed at an 8% profit.
- Level 3 (14%): 15% of the position is closed at a 14% profit.
- Level 4 (21%): 10% of the position is closed at a 21% profit.
Adjusting these take-profit levels affects how quickly profits are realized:
- Lower take-profit levels: Capture gains more quickly, reducing risk but potentially cutting off larger profits.
- Higher take-profit levels: Let trades run longer, aiming for bigger gains but increasing the risk of price reversals before profits are locked in.
🔶 Hold Days (20 bars):
The strategy automatically closes the position after 20 bars if none of the take-profit levels are hit. This feature prevents trades from being held indefinitely, especially if market conditions are stagnant. Adjusting this:
- Shorter hold periods: Reduce the duration of exposure, minimizing risks from market changes but potentially closing trades too early.
- Longer hold periods: Allow trades to stay open longer, increasing the chance for mean reversion but also increasing exposure to unfavorable market conditions.
By understanding how these default settings affect the strategy’s performance, traders can optimize the Bitcoin CME-Spot Bollinger Bands Strategy to their preferences, adapting it to different market environments and risk tolerances.

Bitcoin Leverage Sentiment - Strategy [presentTrading]█ Introduction and How it is Different
The "Bitcoin Leverage Sentiment - Strategy " represents a novel approach in the realm of cryptocurrency trading by focusing on sentiment analysis through leveraged positions in Bitcoin. Unlike traditional strategies that primarily rely on price action or technical indicators, this strategy leverages the power of Z-Score analysis to gauge market sentiment by examining the ratio of leveraged long to short positions. By assessing how far the current sentiment deviates from the historical norm, it provides a unique lens to spot potential reversals or continuation in market trends, making it an innovative tool for traders who wish to incorporate market psychology into their trading arsenal.
BTC 4h L/S Performance
local
█ Strategy, How It Works: Detailed Explanation
🔶 Data Collection and Ratio Calculation
Firstly, the strategy acquires data on leveraged long (**`priceLongs`**) and short positions (**`priceShorts`**) for Bitcoin. The primary metric of interest is the ratio of long positions relative to the total of both long and short positions:
BTC Ratio=priceLongs / (priceLongs+priceShorts)
This ratio reflects the prevailing market sentiment, where values closer to 1 indicate a bullish sentiment (dominance of long positions), and values closer to 0 suggest bearish sentiment (prevalence of short positions).
🔶 Z-Score Calculation
The Z-Score is then calculated to standardize the BTC Ratio, allowing for comparison across different time periods. The Z-Score formula is:
Z = (X - μ) / σ
Where:
- X is the current BTC Ratio.
- μ is the mean of the BTC Ratio over a specified period (**`zScoreCalculationPeriod`**).
- σ is the standard deviation of the BTC Ratio over the same period.
The Z-Score helps quantify how far the current sentiment deviates from the historical norm, with high positive values indicating extreme bullish sentiment and high negative values signaling extreme bearish sentiment.
🔶 Signal Generation: Trading signals are derived from the Z-Score as follows:
Long Entry Signal: Occurs when the BTC Ratio Z-Score crosses above the thresholdLongEntry, suggesting bullish sentiment.
- Condition for Long Entry = BTC Ratio Z-Score > thresholdLongEntry
Long Exit/Short Entry Signal: Triggered when the BTC Ratio Z-Score drops below thresholdLongExit for exiting longs or below thresholdShortEntry for entering shorts, indicating a shift to bearish sentiment.
- Condition for Long Exit/Short Entry = BTC Ratio Z-Score < thresholdLongExit or BTC Ratio Z-Score < thresholdShortEntry
Short Exit Signal: Happens when the BTC Ratio Z-Score exceeds the thresholdShortExit, hinting at reducing bearish sentiment and a potential switch to bullish conditions.
- Condition for Short Exit = BTC Ratio Z-Score > thresholdShortExit
🔶Implementation and Visualization: The strategy applies these conditions for trade management, aligning with the selected trade direction. It visualizes the BTC Ratio Z-Score with horizontal lines at entry and exit thresholds, illustrating the current sentiment against historical norms.
█ Trade Direction
The strategy offers flexibility in trade direction, allowing users to choose between long, short, or both, depending on their market outlook and risk tolerance. This adaptability ensures that traders can align the strategy with their individual trading style and market conditions.
█ Usage
To employ this strategy effectively:
1. Customization: Begin by setting the trade direction and adjusting the Z-Score calculation period and entry/exit thresholds to match your trading preferences.
2. Observation: Monitor the Z-Score and its moving average for potential trading signals. Look for crossover events relative to the predefined thresholds to identify entry and exit points.
3. Confirmation: Consider using additional analysis or indicators for signal confirmation, ensuring a comprehensive approach to decision-making.
█ Default Settings
- Trade Direction: Determines if the strategy engages in long, short, or both types of trades, impacting its adaptability to market conditions.
- Timeframe Input: Influences signal frequency and sensitivity, affecting the strategy's responsiveness to market dynamics.
- Z-Score Calculation Period: Affects the strategy’s sensitivity to market changes, with longer periods smoothing data and shorter periods increasing responsiveness.
- Entry and Exit Thresholds: Set the Z-Score levels for initiating or exiting trades, balancing between capturing opportunities and minimizing false signals.
- Impact of Default Settings: Provides a balanced approach to leverage sentiment trading, with adjustments needed to optimize performance across various market conditions.

Bitcoin Futures vs. Spot Tri-Frame - Strategy [presentTrading]Prove idea with a backtest is always true for trading.
I developed and open-sourced it as an educational material for crypto traders to understand that the futures and spot spread may be effective but not be as effective as they might think. It serves as an indicator of sentiment rather than a reliable predictor of market trends over certain periods. It is better suited for specific trading environments, which require further research.
█ Introduction and How it is Different
The "Bitcoin Futures vs. Spot Tri-Frame Strategy" utilizes three different timeframes to calculate the Z-Score of the spread between BTC futures and spot prices on Binance and OKX exchanges. The strategy executes long or short trades based on composite Z-Score conditions across the three timeframes.
The spread refers to the difference in price between BTC futures and BTC spot prices, calculated by taking a weighted average of futures prices from multiple exchanges (Binance and OKX) and subtracting a weighted average of spot prices from the same exchanges.
BTCUSD 1D L/S Performance
█ Strategy, How It Works: Detailed Explanation
🔶 Calculation of the Spread
The spread is the difference in price between BTC futures and BTC spot prices. The strategy calculates the spread by taking a weighted average of futures prices from multiple exchanges (Binance and OKX) and subtracting a weighted average of spot prices from the same exchanges. This spread serves as the primary metric for identifying trading opportunities.
Spread = Weighted Average Futures Price - Weighted Average Spot Price
🔶 Z-Score Calculation
The Z-Score measures how many standard deviations the current spread is from its historical mean. This is calculated for each timeframe as follows:
Spread Mean_tf = SMA(Spread_tf, longTermSMA)
Spread StdDev_tf = STDEV(Spread_tf, longTermSMA)
Z-Score_tf = (Spread_tf - Spread Mean_tf) / Spread StdDev_tf
Local performance
🔶 Composite Entry Conditions
The strategy triggers long and short entries based on composite Z-Score conditions across all three timeframes:
- Long Condition: All three Z-Scores must be greater than the long entry threshold.
Long Condition = (Z-Score_tf1 > zScoreLongEntryThreshold) and (Z-Score_tf2 > zScoreLongEntryThreshold) and (Z-Score_tf3 > zScoreLongEntryThreshold)
- Short Condition: All three Z-Scores must be less than the short entry threshold.
Short Condition = (Z-Score_tf1 < zScoreShortEntryThreshold) and (Z-Score_tf2 < zScoreShortEntryThreshold) and (Z-Score_tf3 < zScoreShortEntryThreshold)
█ Trade Direction
The strategy allows the user to specify the trading direction:
- Long: Only long trades are executed.
- Short: Only short trades are executed.
- Both: Both long and short trades are executed based on the Z-Score conditions.
█ Usage
The strategy can be applied to BTC or Crypto trading on major exchanges like Binance and OKX. By leveraging discrepancies between futures and spot prices, traders can exploit market inefficiencies. This strategy is suitable for traders who prefer a statistical approach and want to diversify their timeframes to validate signals.
█ Default Settings
- Input TF 1 (60 minutes): Sets the first timeframe for Z-Score calculation.
- Input TF 2 (120 minutes): Sets the second timeframe for Z-Score calculation.
- Input TF 3 (180 minutes): Sets the third timeframe for Z-Score calculation.
- Long Entry Z-Score Threshold (3): Defines the threshold above which a long trade is triggered.
- Short Entry Z-Score Threshold (-3): Defines the threshold below which a short trade is triggered.
- Long-Term SMA Period (100): The period used to calculate the simple moving average for the spread.
- Use Hold Days (true): Enables holding trades for a specified number of days.
- Hold Days (5): Number of days to hold the trade before exiting.
- TPSL Condition (None): Defines the conditions for taking profit and stop loss.
- Take Profit (%) (30.0): The percentage at which the trade will take profit.
- Stop Loss (%) (20.0): The percentage at which the trade will stop loss.
By fine-tuning these settings, traders can optimize the strategy to suit their risk tolerance and trading style, enhancing overall performance.

Crypto Volatility Bitcoin Correlation Strategy Description:
The Crypto Volatility Bitcoin Correlation Strategy is designed to leverage market volatility specifically in Bitcoin (BTC) using a combination of volatility indicators and trend-following techniques. This strategy utilizes the VIXFix (a volatility indicator adapted for crypto markets) and the BVOL7D (Bitcoin 7-Day Volatility Index from BitMEX) to identify periods of high volatility, while confirming trends with the Exponential Moving Average (EMA). These components work together to offer a comprehensive system that traders can use to enter positions when volatility and trends are aligned in their favor.
Key Features:
VIXFix (Volatility Index for Crypto Markets): This indicator measures the highest price of Bitcoin over a set period and compares it with the current low price to gauge market volatility. A rise in VIXFix indicates increasing market volatility, signaling that large price movements could occur.
BVOL7D (Bitcoin 7-Day Volatility Index): This volatility index, provided by BitMEX, measures the volatility of Bitcoin over the past 7 days. It helps traders monitor the recent volatility trend in the market, particularly useful when making short-term trading decisions.
Exponential Moving Average (EMA): The 50-period EMA acts as a trend indicator. When the price is above the EMA, it suggests the market is in an uptrend, and when the price is below the EMA, it suggests a downtrend.
How It Works:
Long Entry: A long position is triggered when both the VIXFix and BVOL7D indicators are rising, signaling increased volatility, and the price is above the 50-period EMA, confirming that the market is trending upward.
Exit: The strategy exits the position when the price crosses below the 50-period EMA, which signals a potential weakening of the uptrend and a decrease in volatility.
This strategy ensures that traders only enter positions when the volatility aligns with a clear trend, minimizing the risk of entering trades during periods of market uncertainty.
Testing and Timeframe:
This strategy has been tested on Bitcoin using the daily timeframe, which provides a longer-term perspective on market trends and volatility. However, users can adjust the timeframe according to their trading preferences. It is crucial to note that this strategy does not include comprehensive risk management, aside from the exit condition when the price crosses below the EMA. Users are strongly advised to implement their own risk management techniques, such as setting appropriate stop-loss levels, to safeguard their positions during high volatility periods.
Utility:
The Crypto Volatility Bitcoin Correlation Strategy is particularly well-suited for traders who aim to capitalize on the high volatility often seen in the Bitcoin market. By combining volatility measurements (VIXFix and BVOL7D) with a trend-following mechanism (EMA), this strategy helps identify optimal moments for entering and exiting trades. This approach ensures that traders participate in potentially profitable market moves while minimizing exposure during times of uncertainty.
Use Cases:
Volatility-Based Entries: Traders looking to take advantage of market volatility spikes will find this strategy useful for timing entry points during market swings.
Trend Confirmation: By using the EMA as a confirmation tool, traders can avoid entering trades that go against the trend, which can result in significant losses during volatile market conditions.
Risk Management: While the strategy exits when price falls below the EMA, it is important to recognize that this is not a full risk management system. Traders should use caution and integrate additional risk measures, such as stop-losses and position sizing, to better manage potential losses.
How to Use:
Step 1: Monitor the VIXFix and BVOL7D indicators. When both are rising and the Bitcoin price is above the EMA, the strategy will trigger a long entry, indicating that the market is experiencing increased volatility with a confirmed uptrend.
Step 2: Exit the position when the price drops below the 50-period EMA, signaling that the trend may be reversing or weakening, reducing the likelihood of continued upward price movement.
This strategy is open-source and is intended to help traders navigate volatile market conditions, particularly in Bitcoin, using proven indicators for volatility and trend confirmation.
Risk Disclaimer:
This strategy has been tested on the daily timeframe of Bitcoin, but users should be aware that it does not include built-in risk management except for the below-EMA exit condition. Users should be extremely cautious when using this strategy and are encouraged to implement their own risk management, such as using stop-losses, position sizing, and setting appropriate limits. Trading involves significant risk, and this strategy does not guarantee profits or prevent losses. Past performance is not indicative of future results. Always test any strategy in a demo environment before applying it to live markets.

Bitcoin Liquidity Breakout with ICT StrategiesBitcoin Liquidity Breakout with ICT Strategies
a one of many scripts developed by our engineers .
Check the results for yourself

Bitcoin Exponential Profit Strategy### Strategy Description:
The **Bitcoin Trading Strategy** is an **Exponential Moving Average (EMA) crossover strategy** designed to identify bullish trends for Bitcoin.
1. **Indicators**:
- **Fast EMA (default 9 periods)**: Represents the short-term trend.
- **Slow EMA (default 21 periods)**: Represents the longer-term trend.
2. **Entry Condition**:
- A **bullish crossover** occurs when the Fast EMA crosses above the Slow EMA.
- The strategy enters a **long position** with a user-defined order size (default 0.01 BTC).
3. **Exit Conditions**:
- **Take Profit**: Closes the position when the profit target is reached (default $100).
- **Stop Loss**: Closes the position when the price drops below the stop loss level (default $50).
- **Bearish Crossunder**: Closes the position when the Fast EMA crosses below the Slow EMA.
4. **Visual Signals**:
- **BUY signals**: Displayed when a bullish crossover occurs.
- **SELL signals**: Displayed when a bearish crossunder occurs.
This strategy is optimized for trend-following behavior, ensuring positions are aligned with upward-moving trends while managing risk through clear stop-loss and take-profit levels.

Bitcoin Momentum StrategyThis is a very simple long-only strategy I've used since December 2022 to manage my Bitcoin position.
I'm sharing it as an open-source script for other traders to learn from the code and adapt it to their liking if they find the system concept interesting.
General Overview
Always do your own research and backtesting - this script is not intended to be traded blindly (no script should be) and I've done limited testing on other markets beyond Ethereum and BTC, it's just a template to tweak and play with and make into one's own.
The results shown in the strategy tester are from Bitcoin's inception so as to get a large sample size of trades, and potential returns have diminished significantly as BTC has grown to become a mega cap asset, but the script includes a date filter for backtesting and it has still performed solidly in recent years (speaking from personal experience using it myself - DYOR with the date filter).
The main advantage of this system in my opinion is in limiting the max drawdown significantly versus buy & hodl. Theoretically much better returns can be made by just holding, but that's also a good way to lose 70%+ of your capital in the inevitable bear markets (also speaking from experience).
In saying all of that, the future is fundamentally unknowable and past results in no way guarantee future performance.
System Concept:
Capture as much Bitcoin upside volatility as possible while side-stepping downside volatility as quickly as possible.
The system uses a simple but clever momentum-style trailing stop technique I learned from one of my trading mentors who uses this approach on momentum/trend-following stock market systems.
Basically, the system "ratchets" up the stop-loss to be much tighter during high bearish volatility to protect open profits from downside moves, but loosens the stop loss during sustained bullish momentum to let the position ride.
It is invested most of the time, unless BTC is trading below its 20-week EMA in which case it stays in cash/USDT to avoid holding through bear markets. It only trades one position (no pyramiding) and does not trade short, but can easily be tweaked to do whatever you like if you know what you're doing in Pine.
Default parameters:
HTF: Weekly Chart
EMA: 20-Period
ATR: 5-period
Bar Lookback: 7
Entry Rule #1:
Bitcoin's current price must be trading above its higher-timeframe EMA (Weekly 20 EMA).
Entry Rule #2:
Bitcoin must not be in 'caution' condition (no large bearish volatility swings recently).
Enter at next bar's open if conditions are met and we are not already involved in a trade.
"Caution" Condition:
Defined as true if BTC's recent 7-bar swing high minus current bar's low is > 1.5x ATR, or Daily close < Daily 20-EMA.
Trailing Stop:
Stop is trailed 1 ATR from recent swing high, or 20% of ATR if in caution condition (ie. 0.2 ATR).
Exit on next bar open upon a close below stop loss.
I typically use a limit order to open & exit trades as close to the open price as possible to reduce slippage, but the strategy script uses market orders.
I've never had any issues getting filled on limit orders close to the market price with BTC on the Daily timeframe, but if the exchange has relatively low slippage I've found market orders work fine too without much impact on the results particularly since BTC has consistently remained above $20k and highly liquid.
Cost of Trading:
The script uses no leverage and a default total round-trip commission of 0.3% which is what I pay on my exchange based on their tier structure, but this can vary widely from exchange to exchange and higher commission fees will have a significantly negative impact on realized gains so make sure to always input the correct theoretical commission cost when backtesting any script.
Static slippage is difficult to estimate in the strategy tester given the wide range of prices & liquidity BTC has experienced over the years and it largely depends on position size, I set it to 150 points per buy or sell as BTC is currently very liquid on the exchange I trade and I use limit orders where possible to enter/exit positions as close as possible to the market's open price as it significantly limits my slippage.
But again, this can vary a lot from exchange to exchange (for better or worse) and if BTC volatility is high at the time of execution this can have a negative impact on slippage and therefore real performance, so make sure to adjust it according to your exchange's tendencies.
Tax considerations should also be made based on short-term trade frequency if crypto profits are treated as a CGT event in your region.
Summary:
A simple, but effective and fairly robust system that achieves the goals I set for it.
From my preliminary testing it appears it may also work on altcoins but it might need a bit of tweaking/loosening with the trailing stop distance as the default parameters are designed to work with Bitcoin which obviously behaves very differently to smaller cap assets.
Good luck out there!

Bitcoin - MA Crossover StrategyBefore You Begin:
Please read these warnings carefully before using this script, you will bear all fiscal responsibility for your own trades.
Trading Strategy Warning - Past performance of this strategy may not equal future performance, due to macro-environment changes, etc.
Account Size Warning - Performance based upon default 10% risk per trade, of account size $100,000. Adjust BEFORE you trade to see your own drawdown.
Time Frame - D1 and H4. H4 has a lower profit factor (more fake-outs, and account drawdown), D1 recommended.
Trend Following System - Profitability of this system is dependent on STRONG future trends in Bitcoin (BTCUSD).
Default Settings:
This script was tested on Daily and 4 Hourly charts using the following default settings. Note that 4 Hourly exhibits higher drawdowns and lower profit factor, whilst Daily appears more stable.
Account Size ($): 100,000 (please adjust to simulate your own risk)
Equity Risk (%): 10 (please adjust to simulate your own risk)
Fast Moving Average (Period): 20
Slow Moving Average (Period): 40
Relative Strength Index (Period): 14
Trading Mechanism:
Trend following strategies work well for assets that display the tendency of long-trends. Please do not use this script on financial assets that have a historical tendency for mean reversion. Bitcoin has historically exhibited strong trends, and thus this script is designed to capitalise on that behaviour. It is hoped (but we cannot predict), that Bitcoin will strongly trend in the coming days.
LONG:
Enter Long - When fast moving average (20) crosses ABOVE slow moving average (40)
Exit Long - When fast moving average (20) crosses BELOW slow moving average (40)
SHORT:
Enter Short - When fast moving average (20) crosses BELOW slow moving average (40)
Exit Short - When fast moving average (20) crosses ABOVE slow moving average (40)
Risk Warnings:
Do note that "moving averages" are a lagging indicator, and as such heavy drawdowns could occur when a trade is open. If you are trading this system manually, it is best to avoid emotions and let the system tell you when to enter and exit. Do not panic and exit manually when under heavy drawdown, always follow the system. Do not be emotional. If possible, connect this to your broker for auto-trading. Ensure that your risk per trade (Equity Risk) is SMALL enough that it does not result in a margin-call on your trading account. Equity risk must always be considered relative to your total account size.
Remember: You bear all financial responsibility for your trades, best of luck.

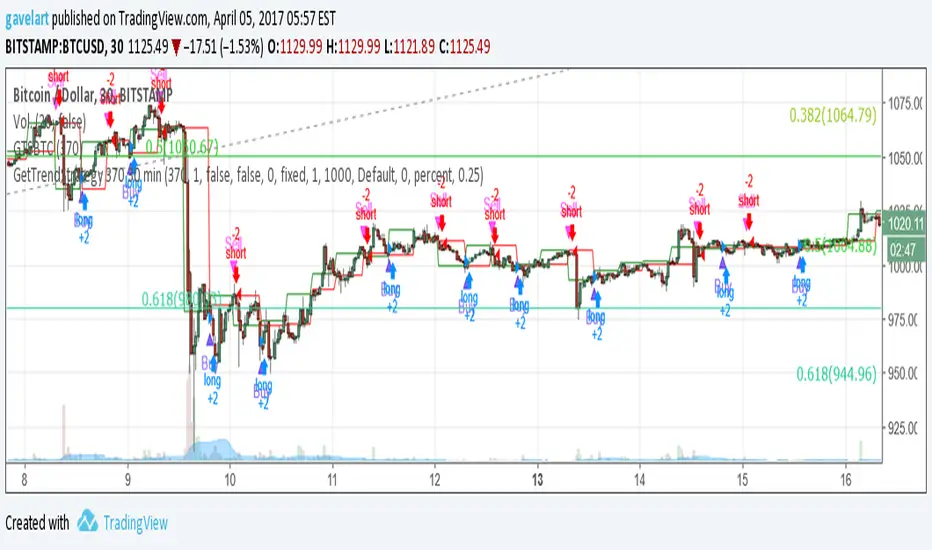
GetTrendStrategy 370 30 minModificación de la estrategia “GetTrendStrategy” optimizada para Bitcoin.
Bitcoin Scalping Strategy (Sampled with: PMARP+MADRID MA RIBBON)
DISCLAIMER:
THE CONTENT WITHIN THIS STRATEGY IS CREATED FROM TWO INDICATORS CREATED BY TWO PINESCRIPTER'S. THE STRATEGY WAS EXECUTED BY MYSELF AND REVERSE-ENGINEERED TO MEET THE CONDITIONS OF THE INTENDED STRATEGY REQUESTOR. I DO NOT TAKE CREDIT FOR THE CONTENT WITHIN THE ESTABLISHED LINES MADE CLEAR BY MYSELF.
The Sampled Scripts and creators:
PMAR/PMARP by @The_Caretaker Link to original script:
Madrid MA RIBBON BAR by @Madrid Link to original script:
Cheat Code's strategy notes:
This sampled strategy (Requested by @elemy_eth) is one combining previously created studies. I reverse-engineered the local scope for the Madrid moving average color plots and set entry and exit conditions for certain criteria met. This strategy is meant to deliver an extremely high hit rate on a daily time frame. This is made possible because of the very low take profit percentage, during the context of a macro downtrend it is made easier to hit 1-3% scalps which is made visible with the strategy using sampled scripts I created here.
How it works:
Entry Conditions:
-Enter Long's if the lime color conditions are met true using the script detailed by Marid's MA
- No re-entry into positions needs to be met true (this prevents pyramiding of orders due to conditions being met true) applicable to both long and short side entries.
- To increase hit rate and prevent traps both the parameters of rsi being sub 80 and no previously engulfing candles need to be met true to enter a long position.
- Enter Short's if the red color conditions of Madrid's moving average are met true.
- Closing Long positions are typically not met within this indicator, however, it still sometimes triggers if necessary. This consists of a pmarp sub 99 and a position size greater than 0.0
- Closing Short positions are typically not met within this indicator, however, it still sometimes triggers if necessary. This consists of a pmarp over 01 and a position size less than 0.0
- Stop Loss: 27.75% Take Profit: 1% (Which does not trigger on ticks over 1% so you will see average trade profits greater than 1%)
BYBIT:BTCUSDT BINANCE:BTCUSDT COINBASE:BTCUSD
Best Of Luck :)
-CheatCode1

Bitcoin trend RVI and Emastrategy with two emas and rvi.
Only long positions when fast ema above slow ema when rvi gives entry.
Only short positions when slow ema above fast ema when rvi gives entry.

Bitcoin 15 min crossover SMA Strategy ScriptIs a very simple script that must be used on the 15 min chart of BTCUSD, and works.
Tested same EA in production since 2016.
Use the 200 and 50 SMA to buy and sell.
Works well!
Enjoi!
Sundays Suck for Bitcoin - Daily StrategyBitcoin tends to have bad Sundays, so this strategy just sells on Saturday, and buys back the next Wednesday if the price is kinda going up!
(Its Jonnys first script, so is this really just published for people looking for simple code to learn from :-)
(The strategy works best if you set your chart time period to 1 day.)

Crypto MVRV ZScore - Strategy [PresentTrading]█ Introduction and How it is Different
The "Crypto Valuation Extremes: MVRV ZScore - Strategy " represents a cutting-edge approach to cryptocurrency trading, leveraging the Market Value to Realized Value (MVRV) Z-Score. This metric is pivotal for identifying overvalued or undervalued conditions in the crypto market, particularly Bitcoin. It assesses the current market valuation against the realized capitalization, providing insights that are not apparent through conventional analysis.
BTCUSD 6h Long/Short Performance
Local
█ Strategy, How It Works: Detailed Explanation
The strategy leverages the Market Value to Realized Value (MVRV) Z-Score, specifically designed for cryptocurrencies, with a focus on Bitcoin. This metric is crucial for determining whether Bitcoin is currently undervalued or overvalued compared to its historical 'realized' price. Below is an in-depth explanation of the strategy's components and calculations.
🔶Conceptual Foundation
- Market Capitalization (MC): This represents the total dollar market value of Bitcoin's circulating supply. It is calculated as the current price of Bitcoin multiplied by the number of coins in circulation.
- Realized Capitalization (RC): Unlike MC, which values all coins at the current market price, RC is computed by valuing each coin at the price it was last moved or traded. Essentially, it is a summation of the value of all bitcoins, priced at the time they were last transacted.
- MVRV Ratio: This ratio is derived by dividing the Market Capitalization by the Realized Capitalization (The ratio of MC to RC (MVRV Ratio = MC / RC)). A ratio greater than 1 indicates that the current price is higher than the average price at which all bitcoins were purchased, suggesting potential overvaluation. Conversely, a ratio below 1 suggests undervaluation.
🔶 MVRV Z-Score Calculation
The Z-Score is a statistical measure that indicates the number of standard deviations an element is from the mean. For this strategy, the MVRV Z-Score is calculated as follows:
MVRV Z-Score = (MC - RC) / Standard Deviation of (MC - RC)
This formula quantifies Bitcoin's deviation from its 'normal' valuation range, offering insights into market sentiment and potential price reversals.
🔶 Spread Z-Score for Trading Signals
The strategy refines this approach by calculating a 'spread Z-Score', which adjusts the MVRV Z-Score over a specific period (default: 252 days). This is done to smooth out short-term market volatility and focus on longer-term valuation trends. The spread Z-Score is calculated as follows:
Spread Z-Score = (Market Z-Score - MVVR Ratio - SMA of Spread) / Standard Deviation of Spread
Where:
- SMA of Spread is the simple moving average of the spread over the specified period.
- Spread refers to the difference between the Market Z-Score and the MVRV Ratio.
🔶 Trading Signals
- Long Entry Condition: A long (buy) signal is generated when the spread Z-Score crosses above the long entry threshold, indicating that Bitcoin is potentially undervalued.
- Short Entry Condition: A short (sell) signal is triggered when the spread Z-Score falls below the short entry threshold, suggesting overvaluation.
These conditions are based on the premise that extreme deviations from the mean (as indicated by the Z-Score) are likely to revert to the mean over time, presenting opportunities for strategic entry and exit points.
█ Practical Application
Traders use these signals to make informed decisions about opening or closing positions in the Bitcoin market. By quantifying market valuation extremes, the strategy aims to capitalize on the cyclical nature of price movements, identifying high-probability entry and exit points based on historical valuation norms.
█ Trade Direction
A unique feature of this strategy is its configurable trade direction. Users can specify their preference for engaging in long positions, short positions, or both. This flexibility allows traders to tailor the strategy according to their risk tolerance, market outlook, or trading style, making it adaptable to various market conditions and trader objectives.
█ Usage
To implement this strategy, traders should first adjust the input parameters to align with their trading preferences and risk management practices. These parameters include the trade direction, Z-Score calculation period, and the thresholds for long and short entries. Once configured, the strategy automatically generates trading signals based on the calculated spread Z-Score, providing clear indications for potential entry and exit points.
It is advisable for traders to backtest the strategy under different market conditions to validate its effectiveness and adjust the settings as necessary. Continuous monitoring and adjustment are crucial, as market dynamics evolve over time.
█ Default Settings
- Trade Direction: Both (Allows for both long and short positions)
- Z-Score Calculation Period: 252 days (Approximately one trading year, capturing a comprehensive market cycle)
- Long Entry Threshold: 0.382 (Indicative of moderate undervaluation)
- Short Entry Threshold: -0.382 (Signifies moderate overvaluation)
These default settings are designed to balance sensitivity to market valuation extremes with a pragmatic approach to trade execution. They aim to filter out noise and focus on significant market movements, providing a solid foundation for both new and experienced traders looking to exploit the unique insights offered by the MVRV Z-Score in the cryptocurrency market.

MVRV Z Score and MVRV Free Float Z-ScoreIMPORTANT: This script needs as much historic data as possible. Please run it on INDEX:BTCUSD , BNC:BLX or another chart of sufficient length.
MVRV
The MVRV (Market Value to Realised Value Ratio) simply divides bitcoins market cap by bitcoins realized market cap. This was previously impossible on Tradingview but has now been made possible thanks to Coinmetrics providing us with the realized market cap data.
In the free float version, the free float market cap is used instead of the regular market cap.
Z-Score
The MVRV Z-score divides the difference between Market cap and realized market cap by the historic standard deviation of the market cap.
Historically, this has been insanely accurate at detecting bitcoin tops and bottoms:
A Z-Score above 7 means bitcoin is vastly overpriced and at a local top.
A Z-Score below 0.1 means bitcoin is underpriced and at a local bottom.
In the free float version, the free float market cap is used instead of the regular market cap.
The Z-Score, also known as the standard score is hugely popular in a wide range of mathematical and statistical fields and is usually used to measure the number of standard deviations by which the value of a raw score is above or below the mean value of what is being observed or measured.
Credits
MVRV Z Score initially created by aweandwonder
MVRV initially created by Murad Mahmudov and David Puell

The Oracle: Dip & Top Adaptive Sniper [Hakan Yorganci]█ OVERVIEW
The Oracle: Dip & Top Adaptive Sniper is a precision-focused trend trading strategy designed to solve the biggest problem in swing trading: Timing.
Most trend-following strategies chase price ("FOMO"), buying when the asset is already overextended. The Oracle takes a different approach. It adopts a "Sniper" mentality: it identifies a strong macro trend but patiently waits for a Mean Reversion (pullback) to execute an entry at a discounted price.
By combining the structural strength of Moving Averages (SMA 50/200) with the momentum precision of RSI and the volatility filtering of ADX, this script filters out noise and targets high-probability setups.
█ HOW IT WORKS
This strategy operates on a strictly algorithmic protocol known as "The Yorganci Protocol," which involves three distinct phases: Filter, Target, and Execute.
1. The Macro Filter (Trend Identification)
* SMA 200 Rule: By default, the strategy only scans for buy signals when the price is trading above the 200-period Simple Moving Average. This ensures we are always trading in the direction of the long-term bull market.
* Adaptive Switch: A new feature allows users to toggle the Only Buy Above SMA 200? filter OFF. This enables the strategy to hunt for oversold bounces (dead cat bounces) even during bearish or neutral market structures.
2. The Volatility Filter (ADX Integration)
* Sideways Protection: One of the main weaknesses of moving average strategies is "whipsaw" losses during choppy, ranging markets.
* Solution: The Oracle utilizes the ADX (Average Directional Index). It will BLOCK any trade entry if the ADX is below the threshold (Default: 20). This ensures capital is only deployed when a genuine trend is present.
3. The Sniper Entry (Buying the Dip)
* Instead of buying on breakout strength (e.g., RSI > 60), The Oracle waits for the RSI Moving Average to dip into the "Value Zone" (Default: 45) and cross back up. This technique allows for tighter stops and higher Risk/Reward ratios compared to traditional breakout systems.
█ EXIT STRATEGY
The Oracle employs a dynamic dual-exit mechanism to maximize gains and protect capital:
* Take Profit (The Peak): The strategy monitors RSI heat. When the RSI Moving Average breaches the Overbought Threshold (Default: 75), it signals a "Take Profit", securing gains near the local top before a potential reversal.
* Stop Loss (Trend Invalidated): If the market structure fails and the price closes below the 50-period SMA, the position is immediately closed to prevent deep drawdowns.
█ SETTINGS & CONFIGURATION
* Moving Averages: Fully customizable lengths for Support (SMA 50) and Trend (SMA 200).
* Trend Filter: Checkbox to enable/disable the "Bull Market Only" rule.
* RSI Thresholds:
* Sniper Buy Level: Adjustable (Default: 45). Lower values = Deeper dips, fewer trades.
* Peak Sell Level: Adjustable (Default: 75). Higher values = Longer holds, potentially higher profit.
* ADX Filter: Checkbox to enable/disable volatility filtering.
█ BEST PRACTICES
* Timeframe: Designed primarily for 4H (4-Hour) charts for swing trading. It can also be used on 1H for more frequent signals.
* Assets: Highly effective on trending assets such as Bitcoin (BTC), Ethereum (ETH), and high-volume Altcoins.
* Risk Warning: This strategy is designed for "Long Only" spot or leverage trading. Always use proper risk management.
█ CREDITS
* Original Concept: Inspired by the foundational work of Murat Besiroglu (@muratkbesiroglu).
* Algorithm Development & Enhancements: Developed by Hakan Yorganci (@hknyrgnc).
* Modifications include: Integration of ADX filters, Mean Reversion entry logic (RSI Dip), and Dynamic Peak Profit taking.

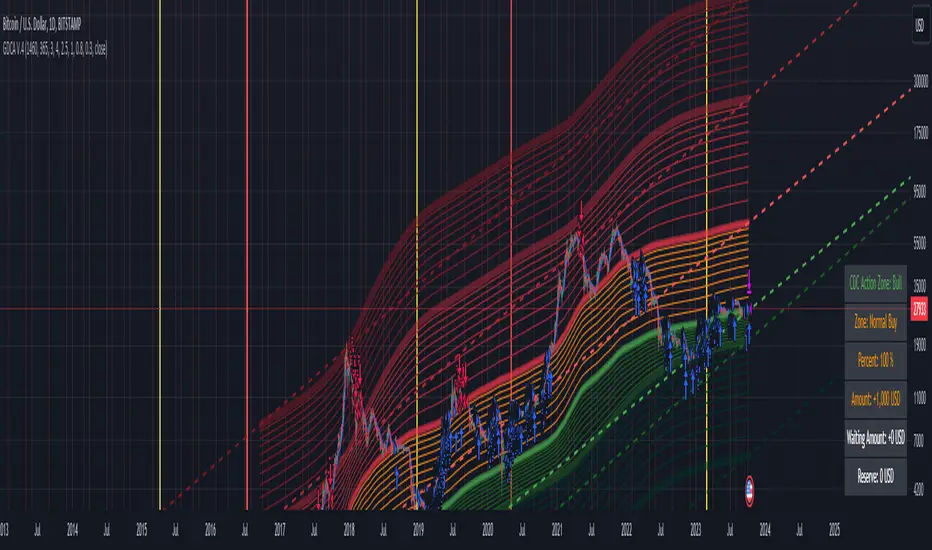
Grospector DCA V.4This is system for DCA with strategy and can trade on trend technique "CDC Action Zone".
We upgrade Grospector DCA V.3 by minimizing unnecessary components and it is not error price predictions.
This has 5 zone Extreme high , high , normal , low , Extreme low. You can dynamic set min - max percent every zone.
Extreme zone is derivative short and long which It change Extreme zone to Normal zone all position will be closed.
Every Zone is splitted 10 channel. and this strategy calculate contribution.
and now can predict price in future.
Idea : Everything has average in its life. For bitcoin use 4 years for halving. I think it will be interesting price.
Default : I set MA is 365*4 days and average it again with 365 days.
Input :
len: This input represents the length of the moving average.
strongLen: This input represents the length of the moving average used to calculate the strong buy and strong sell zone.
shortMulti: This input represents the multiplier * moveing average used to calculate the short zone.
strongSellMulti: This input represents the multiplier used to calculate the strong sell signal.
sellMulti: This input represents the multiplier * moveing average used to calculate the sell zone.
strongBuyMulti: This input represents the multiplier used to calculate the strong sell signal.
longMulti: This input represents the multiplier * moveing average used to calculate the long zone.
*Diff sellMulti and strongBuyMulti which is normal zone.
useDerivative: This input is a boolean flag that determines whether to use the derivative display zone. If set to true, the derivative display zone will be used, otherwise it will be hidden.
zoneSwitch: This input determines where to display the channel signals. A value of 1 will display the signals in all zones, a value of 2 will display the signals in the chart pane, a value of 3 will display the signals in the data window, and a value of 4 will hide the signals.
price: Defines the price source used for the indicator calculations. The user can select from various options, with the default being the closing price.
labelSwitch: Defines whether to display assistive text on the chart. The user can select a boolean value (true/false), with the default being true.
zoneSwitch: Defines which areas of the chart to display assistive zones. The user can select from four options: 1 = all, 2 = chart only, 3 = data only, 4 = none. The default value is 2.
predictFuturePrice: Defines whether to display predicted future prices on the chart. The user can select a boolean value (true/false), with the default being true.
DCA: Defines the dollar amount to use for dollar-cost averaging (DCA) trades. The user can input an integer value, with a default value of 5.
WaitingDCA: Defines the amount of time to wait before executing a DCA trade. The user can input a float value, with a default value of 0.
Invested: Defines the amount of money invested in the asset. The user can input an integer value, with a default value of 0.
strategySwitch: Defines whether to turn on the trading strategy. The user can select a boolean value (true/false), with the default being true.
seperateDayOfMonth: Defines a specific day of the month on which to execute trades. The user can input an integer value from 1-31, with the default being 28.
useReserve: Defines whether to use a reserve amount for trading. The user can select a boolean value (true/false), with the default being true.
useDerivative: Defines whether to use derivative data for the indicator calculations. The user can select a boolean value (true/false), with the default being true.
useHalving: Defines whether to use halving data for the indicator calculations. The user can select a boolean value (true/false), with the default being true.
extendHalfOfHalving: Defines the amount of time to extend the halving date. The user can input an integer value, with the default being 200.
Every Zone: It calculate percent from top to bottom which every zone will be splited 10 step.
To effectively make the DCA plan, I recommend adopting a comprehensive strategy that takes into consideration your mindset as the best indicator of the optimal approach. By leveraging your mindset, the task can be made more manageable and adaptable to any market
Dollar-cost averaging (DCA) is a suitable investment strategy for sound money and growth assets which It is Bitcoin, as it allows for consistent and disciplined investment over time, minimizing the impact of market volatility and potential risks associated with market timing
Bullish Divergence Short-term Long Trade FinderThis script is a Bullish divergence trade finder built to find small periods where Bitcoin will likely rise from. It looks for bullish divergence followed by a higher low as long as the hour RSI value is below the 40 mark, if then it will enter an long. It marks out Buy signals on the RSI if the value dips below 'RSI Bull Condition Minimum' (Default 40) on the current time frame in view. It also marks out Sell signals found when the RSI is above the 'RSI Bearish Condition Minimum' (Default 50). The sell signals are bearish divergence that has occurred recently on the RSI. When a long is in play it will sell if it finds bearish divergence or the time frame in view reaches RSI value higher than the 'RSI Sell Value'(Default 75). You can set your stop loss value with the 'Stop loss Percentage' (default 5).
Available inputs:
RSI Period: relative strength measurement length(Typically 14)
RSI Oversold Level: the bottom bar of the RSI (Typically 30)
RSI Overbought Level: the top bar of the RSI (Typically 70)
RSI Bearish Condition Minimum: The minimum value the script will use to look for a pivot high that starts the Bearish condition to Sell (Default 50)
RSI Bearish Condition Sell Min: the minimum value the script will accept a bearish condition (Default 60)
RSI Bull Condition Minimum: the minimum value it will consider a pivot low value in the RSI to find a divergence buy (Default 40)
Look Back this many candles: the amount of candles thee script will look back to find a low value in the RSI (Default 25)
RSI Sell Value: The RSI value of the exit condition for a long when value is reached (Default 75)
Stop loss Percentage: Percentage value for amount to lose (Default 5)
The formula to enter a long is stated below:
If price finds a lower low and there is a higher low found following a lower low and price has just made another dip and price closes lower than the last divergence and Relative strength index hour value is less than 40 enter a long.
The formula to exit a long is stated below:
If the value drops below the stop loss percentage OR (the RSI value is greater than the value of the parameter 'RSI Sell Value' or bearish divergence is found greater than the parameter 'RSI Bearish Condition Minimum' )
This script was built from much strategy testing on BTC but works with alts (occasionally) also. It is most successful to my knowledge using the 15 min and 7 min time frames with default values. Hope it helps! Follow for further possible updates to this script or other entry or exit strategies.
snapshot:
I only have a Pro trading view account so I cannot share a larger data set about this script because the buy signals happen pretty rarely. The most amount that I could find within a view for me was 40 trades within a viewable time. The suggested/default parameters that I have do not occur very often so it limits the data set. Adjustments can be made to the parameters so that trades can be entered more often. The scripts success is dependent on the values of the parameters set by the user. This script was written to be used for BTC/USD or BTC/USDT trading. I am unable to share a larger dataset without putting out results that are intended to fail or having a premium account so reaching the 100 trade minimum is not possible with my account.

Automated Bitcoin (BTC) Investment Strategy from Wunderbit Automated Bitcoin (BTC) Investment Strategy from Wunderbit Trading
This strategy is designed for the automated long-term investment in Bitcoin. The BTC investment strategy is primarily suitable for long-term investors who want to increase the percentage of their investments through timely trading long-term transactions. The main feature is the difference from the indicator of long-term investment. Based on their statistics, this figure is 2 times less. That is, if we just bought Bitcoin and held it, we would receive 2 times less than if we applied the BTC Investment strategy.
This strategy uses the intersection of the triple exponential moving average and the least squares moving average. We also control the profit you will make during an uptrend by implementing a trailing stop based on the ATR indicator.
This is a spot market-only strategy and can be used primarily for long-term investors. The strategy is designed to create an automatic version of investing using a webhook.
Automation allows you to safely ignore the state of your portfolio and exclude emotions.
In order to create a cryptocurrency bot for this strategy, you need to:
1. Create alerts and link the URL to the webhook.
2. Connect the TradingView strategy with automated trading service.

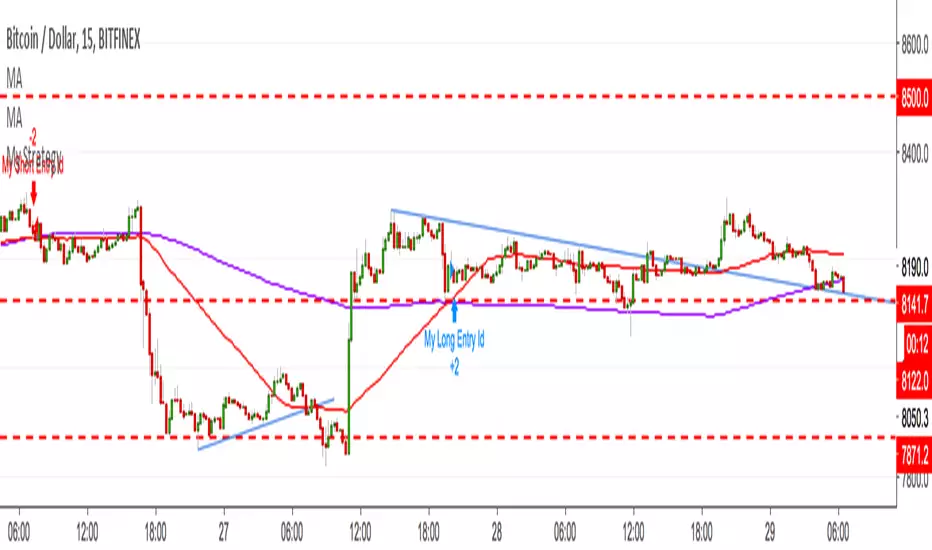
EMA+RSI Pump & Drop Swing Sniper (SL+TP) - StrategyThis is the strategy version of the 'EMA-RSI-Pump-Drop-Swing-Sniper-With-Alerts':
Some additions with this strategy:
~Added Stop loss & Take profit control. In Settings > Inputs if the Stop Loss is at .051 that means it's 5.1% and the Take Profit at .096 is 9.6%. If you wish to remove the TP and SL just change the value to 1.00 and it would be the same as it being 100% TP and SL which is likely to never be hit.
~Added Backtesting by changing the month/date/year in Settings > Inputs
~Added a 2nd EMA line to assist with the long entry signals. I only use this for long entry & exits, though you could use the long exits as Short entries too. I just personally don't do short trading on Bitcoin.
This is using an EMA and RSI with slightly modified settings to give good entry and exit points while looking at Bitcoin. I use this on a 1-hour and 4-hour chart and with other indicators to find good positions to enter a trade or exit if things are turning red.
It's important to know this strategy was made as a request by another user that was using the indicator version. I don't use this as a trading strategy by itself, I use the visuals it gives as a confirmation with other indicators to find the best possible entry and exit positions.
If you click on the EMA line it will color the bars of the chart based on if they are above or below the EMA - This is just visually helpful for me to see the active trend.
Make sure you hover over or click on the EMA line to see the colors of the candles change - it's not visible by default or without doing this.

BTC DCA Risk Metric StrategyBTC DCA Risk Strategy - Automated Dollar Cost Averaging with 3Commas Integration
Overview
This strategy combines the proven Oakley Wood Risk Metric with an intelligent tiered Dollar Cost Averaging (DCA) system, designed to help traders systematically accumulate Bitcoin during periods of low risk and take profits during high-risk conditions.
Key Features
📊 Multi-Component Risk Assessment
4-Year SMA Deviation: Measures Bitcoin's distance from its long-term mean
20-Week MA Analysis: Tracks medium-term momentum shifts
50-Day/50-Week MA Ratio: Captures short-to-medium term trend strength
All metrics are normalized by time to account for Bitcoin's maturing market dynamics
💰 3-Tier DCA Buy System
Level 1 (Low Risk): Conservative entry with base allocation
Level 2 (Lower Risk): Increased allocation as opportunity improves
Level 3 (Extreme Low Risk): Maximum allocation during rare buying opportunities
Buys execute every bar while risk remains below thresholds, enabling true DCA accumulation
📈 Progressive Profit Taking
Sell Level 1: Take initial profits as risk increases
Sell Level 2: Scale out further positions during elevated risk
Sell Level 3: Final exit during extreme market conditions
Sell levels automatically reset when new buy signals occur, allowing flexible re-entry
🤖 3Commas Integration
Fully automated webhook alerts for Custom Signal Bots
JSON payloads formatted per 3Commas API specifications
Supports multiple exchanges (Binance, Coinbase, Kraken, Gemini, Bybit)
Configurable quote currency (USD, USDT, BUSD)
How It Works
The strategy calculates a composite risk metric (0-1 scale):
0.0-0.2: Extreme buying opportunity (green zone)
0.2-0.5: Favorable accumulation range (yellow zone)
0.5-0.8: Neutral to cautious territory (orange zone)
0.8-1.0+: High risk, profit-taking zone (red zone)
Buy Logic: As risk decreases, position sizes increase automatically. If risk drops from L1 to L3 threshold, the strategy combines all three tier allocations for maximum exposure.
Sell Logic: Sequential profit-taking ensures you capture gains progressively. The system won't advance to Sell L2 until L1 completes, preventing premature full exits.
Configuration
Risk Metric Parameters:
All calculations use Bitcoin price data (any BTC chart works)
Time-normalized formulas adapt to market maturity
No manual parameter tuning required
Buy Settings:
Set risk thresholds for each tier (default: 0.20, 0.10, 0.00)
Define dollar amounts per tier (default: $10, $15, $20)
Fully customizable to your risk tolerance and capital
Sell Settings:
Configure risk thresholds for profit-taking (default: 1.00, 1.50, 2.00)
Set percentage of position to sell at each level (default: 25%, 35%, 40%)
3Commas Setup:
Create a Custom Signal Bot in 3Commas
Copy Bot UUID and Secret Token into strategy inputs
Enable 3Commas Alerts checkbox
Create TradingView alert: Condition → "alert() function calls only", Webhook → api.3commas.io
Backtesting Results
Strengths:
Systematically buys dips without emotion
Averages down during extended bear markets
Captures explosive bull run profits through tiered exits
Pyramiding (1000 max orders) allows true DCA behavior
Considerations:
Requires sufficient capital for multiple buys during prolonged downtrends
Backtest on Daily timeframe for most reliable signals
Past performance does not guarantee future results
Visual Design
The indicator pane displays:
Color-coded risk metric line: Changes from white→red→orange→yellow→green as risk decreases
Background zones: Green (buy), yellow (hold), red (sell) areas
Dashed threshold lines: Clear visual markers for each buy/sell level
Entry/Exit labels: Green buy labels and orange/red sell labels mark all trades
Credits
Original Risk Metric: Oakley Wood
Strategy Development & 3Commas Integration: Claude AI (Anthropic)
Modifications: pommesUNDwurst
Disclaimer
This strategy is for educational and informational purposes only. Cryptocurrency trading carries substantial risk of loss. Always conduct your own research and never invest more than you can afford to lose. The authors are not financial advisors and assume no responsibility for trading decisions made using this tool.
