SuperBollingerTrend (Expo)█ Overview
The SuperBollingerTrend indicator is a combination of two popular technical analysis tools, Bollinger Bands, and SuperTrend. By fusing these two indicators, SuperBollingerTrend aims to provide traders with a more comprehensive view of the market, accounting for both volatility and trend direction. By combining trend identification with volatility analysis, the SuperBollingerTrend indicator provides traders with valuable insights into potential trend changes. It recognizes that high volatility levels often accompany stronger price momentum, which can result in the formation of new trends or the continuation of existing ones.
█ How Volatility Impacts Trends
Volatility can impact trends by expanding or contracting them, triggering trend reversals, leading to breakouts, and influencing risk management decisions. Traders need to analyze and monitor volatility levels in conjunction with trend analysis to gain a comprehensive understanding of market dynamics.
█ How to use
Trend Reversals: High volatility can result in more dramatic price fluctuations, which may lead to sharp trend reversals. For example, a sudden increase in volatility can cause a bullish trend to transition into a bearish one, or vice versa, as traders react to significant price swings.
Volatility Breakouts: Volatility can trigger breakouts in trends. Breakouts occur when the price breaks through a significant support or resistance level, indicating a potential shift in the trend. Higher volatility levels can increase the likelihood of breakouts, as they indicate stronger market momentum and increased buying or selling pressure. This indicator triggers when the volatility increases, and if the price is near a key level when the indicator alerts, it might trigger a great trend.
█ Features
Peak Signal Move
The indicator calculates the peak price move for each ZigZag and displays it under each signal. This highlights how much the market moved between the signals.
Average ZigZag Move
All price moves between two signals are stored, and the average or the median is calculated and displayed in a table. This gives traders a great idea of how much the market moves on average between two signals.
Take Profit
The Take Profit line is placed at the average or the median price move and gives traders a great idea of what they can expect in average profit from the latest signals.
-----------------
Disclaimer
The information contained in my Scripts/Indicators/Ideas/Algos/Systems does not constitute financial advice or a solicitation to buy or sell any securities of any type. I will not accept liability for any loss or damage, including without limitation any loss of profit, which may arise directly or indirectly from the use of or reliance on such information.
All investments involve risk, and the past performance of a security, industry, sector, market, financial product, trading strategy, backtest, or individual's trading does not guarantee future results or returns. Investors are fully responsible for any investment decisions they make. Such decisions should be based solely on an evaluation of their financial circumstances, investment objectives, risk tolerance, and liquidity needs.
My Scripts/Indicators/Ideas/Algos/Systems are only for educational purposes!
在腳本中搜尋"bollingerband"

Simple Bollinger Bands Strategy [JoseMetal]============
ENGLISH
============
- Description:
This is a simple strategy based on Bollinger Bands found in "journeymaninvestor.com" by "nealosis" in 15 feb 2021, original strategy and credits to him.
The original strategy:
- Bollinger Bands, 20 length simple moving average and 2 standard deviations.
- Buy when the closing price crosses the lower band up.
- Exit trade when the closing price touches the upper band.
This strategy worked on mayor indices such as SP500 before the current economic crisis, because those indices just retrace to continue up and up. That's why after testing it on the current data and other markets the strategy is NO longer viable and I made some optimizations to it.
The modified strategy:
- Now you can LONG and SHORT, not only LONG, but depending on the asset (mainly bullish like BTC or Indices) is better to just BUY.
- You can customize BB length and deviation, a deviation of 1.5 triggers more trades and is usually better.
- Averaging added, by default you can have up to 7 positions at 1% capital each, but all is customizable.
Other extra stuff:
- Able to pick a date range.
- Able to pick % of capital used on each trade.
- Able to close trades ON PROFIT ONLY.
- Able to increase position ONLY if the price is a certain percentage better than your average.
- Able to pick a leverage.
- Visual:
Bollinger Bands are shown.
On LONG entries you get a green background color, red for SHORTs, olive to close LONG and orange to close SHORT.
Position entries/exists with contract size are shown by TradingView by default as usual.
- Customization:
Everything is customizable, from date range to BB colors.
- Usage and recommendations:
Works better on bigger timeframes, daily is the best.
Enjoy!
============
INGLÉS
============
- Descripción:
Esta es una simple estrategia basada en las Bandas de Bollinger encontrada en "journeymaninvestor.com" por "nealosis" en el 15 de febrero de 2021, estrategia original y créditos a él.
La estrategia original:
- Bandas de Bollinger, media móvil simple de 20 y 2 desviaciones estándar.
- Comprar cuando el precio de cierre cruza la banda inferior hacia arriba.
- Salir de la posición cuando el precio de cierre toca la banda superior.
Esta estrategia funcionaba en índices mayores como el SP500 antes de la crisis económica actual, porque esos índices sólo retroceden para seguir subiendo y subiendo. Por eso después de probarla con los datos actuales y otros mercados la estrategia ya NO es viable y le hice algunas optimizaciones.
La estrategia modificada:
- Ahora puedes operar LONG y SHORT, no solo LONG, pero dependiendo del activo (principalmente alcistas como BTC o Índices) es mejor solo COMPRAR.
- Se puede personalizar la longitud de BB y la desviación, una desviación de 1,5 desencadena más operaciones y suele ser mejor.
- Promedio añadido, por defecto puedes tener hasta 7 posiciones al 1% de capital cada una, pero todo es personalizable.
Otras cosas extra:
- Posibilidad de elegir un rango de fechas.
- Posibilidad de elegir el % de capital utilizado en cada operación.
- Posibilidad de cerrar operaciones SÓLO CON BENEFICIO.
- Posibilidad de aumentar la posición sólo si el precio es un cierto porcentaje mejor que su promedio.
- Posibilidad de elegir un apalancamiento.
- Visual:
Se muestran las Bandas de Bollinger.
En las entradas de LARGO se obtiene un color de fondo verde, rojo para CORTO, oliva para cerrar LARGO y naranja para cerrar CORTO.
Las entradas/existencias de posiciones con tamaño de contrato son mostradas por TradingView por defecto como es habitual.
- Personalización:
Todo es personalizable, desde el rango de fechas hasta los colores de BB.
- Uso y recomendaciones:
Funciona mejor en marcos de tiempo más grandes, diario es el mejor.
¡Que lo disfrutes!

BOLLY BandsThis is a strategy using Bollinger Bands. The strategy is predicated around having low volatility in price action and then looking to capture a move when price starts to trend outside of the Bollinger bands. This strategy has only been backtested for 1 month but it has promising results so I will be sharing it looking for feedback. I run this strategy on the ERUSD 1 min chart.

Channels Strategy [JoseMetal]============
ENGLISH
============
- Description:
This strategy is based on Bollinger Bands / Keltner Channel price "rebounds" (the idea of price bouncing from one band to another).
The strategy has several customizable options, which allows you to refine the strategy for your asset and timeframe.
You can customize settings for ALL indicators, Bollinger Bands (period and standard deviation), Keltner Channel (period and ATR multiplier) and ATR (period).
- AVAILABLE INDICATORS:
You can pick Bollinger Bands or Keltner Channels for the strategy, the chosen indicator will be plotted as well.
- CUSTOM CONDITIONS TO ENTER A POSITION:
1. Price breaks the band (low below lower band for LONG or high above higher band for SHORT).
2. Same as 1 but THEN (next candle) price closes INSIDE the bands.
3. Price breaks the band AND CLOSES OUT of the band (lower band for LONG and higher band for SHORT).
4. Same as 3 but THEN (next candle) price closes INSIDE the bands.
- STOP LOSS OPTIONS:
1. Previous wick (low of previous candle if LONG and high or previous candle if SHORT).
2. Extended band, you can customize settings for a second indicator with larger values to use it as STOP LOSS, for example, Bollinger Bands with 2 standard deviations to open positions and 3 for STOP LOSS.
3. ATR: you can pick average true ratio from a source (like closing price) with a multiplier to calculate STOP LOSS.
- TAKE PROFIT OPTIONS:
1. Opposite band (top band for LONGs, bottom band for SHORTs).
2. Moving average: Bollinger Bands simple moving average or Keltner Channel exponential moving average .
3. ATR: you can pick average true ratio from a source (like closing price) with a multiplier to calculate TAKE PROFIT.
- OTHER OPTIONS:
You can pick to trade only LONGs, only SHORTs, both or none (just indicator).
You can enable DYNAMIC TAKE PROFIT, which updates TAKE PROFIT on each candle, for example, if you pick "opposite band" as TAKE PROFIT, it'll update the TAKE PROFIT based on that, on every single new candle.
- Visual:
Bands shown will depend on the chosen indicator and it's settings.
ATR is only printed if used as STOP LOSS and/or TAKE PROFIT.
- Recommendations:
Recommended on DAILY timeframe , it works better with Keltner Channels rather than Bollinger Bands .
- Customization:
As you can see, almost everything is customizable, for colors and plotting styles check the "Style" tab.
Enjoy!
============
ESPAÑOL
============
- Descripción:
Esta estrategia se basa en los "rebotes" de precios en las Bandas de Bollinger / Canal de Keltner (la idea de que el precio rebote de una banda a otra).
La estrategia tiene varias opciones personalizables, lo que le permite refinar la estrategia para su activo y temporalidad favoritas.
Puedes personalizar la configuración de TODOS los indicadores, Bandas de Bollinger (periodo y desviación estándar), Canal de Keltner (periodo y multiplicador ATR) y ATR (periodo).
- INDICADORES DISPONIBLES:
Puedes elegir las Bandas de Bollinger o los Canales de Keltner para la estrategia, el indicador elegido será mostrado en pantalla.
- CONDICIONES PERSONALIZADAS PARA ENTRAR EN UNA POSICIÓN:
1. El precio rompe la banda (mínimo por debajo de la banda inferior para LONG o máximo por encima de la banda superior para SHORT).
2. Lo mismo que en el punto 1 pero ADEMÁS (en la siguiente vela) el precio cierra DENTRO de las bandas.
3. El precio rompe la banda Y CIERRA FUERA de la banda (banda inferior para LONG y banda superior para SHORT).
4. Igual que el 3 pero ADEMÁS (siguiente vela) el precio cierra DENTRO de las bandas.
- OPCIONES DE STOP LOSS:
1. Mecha anterior (mínimo de la vela anterior si es LONGy máximo de la vela anterior si es SHORT).
2. Banda extendida, puedes personalizar la configuración de un segundo indicador con valores más extensos para utilizarlo como STOP LOSS, por ejemplo, Bandas de Bollinger con 2 desviaciones estándar para abrir posiciones y 3 para STOP LOSS.
3. ATR: puedes elegir el average true ratio de una fuente (como el precio de cierre) con un multiplicador para calcular el STOP LOSS.
- OPCIONES DE TAKE PROFIT:
1. Banda opuesta (banda superior para LONGs, banda inferior para SHORTs).
2. Media móvil: media móvil simple de las Bandas de Bollinger o media móvil exponencial del Canal de Keltner .
3. ATR: se puede escoger el average true ratio de una fuente (como el precio de cierre) con un multiplicador para calcular el TAKE PROFIT.
- OTRAS OPCIONES:
Puedes elegir operar sólo con LONGs, sólo con SHORTs, ambos o ninguno (sólo el indicador).
Puedes activar el TAKE PROFIT DINÁMICO, que actualiza el TAKE PROFIT en cada vela, por ejemplo, si eliges "banda opuesta" como TAKE PROFIT, actualizará el TAKE PROFIT basado en eso, en cada nueva vela.
- Visual:
Las bandas mostradas dependerán del indicador elegido y de su configuración.
El ATR sólo se muestra si se utiliza como STOP LOSS y/o TAKE PROFIT.
- Recomendaciones:
Recomendada para temporalidad de DIARIO, funciona mejor con los Canales de Keltner que con las Bandas de Bollinger .
- Personalización:
Como puedes ver, casi todo es personalizable, para los colores y estilos de dibujo comprueba la pestaña "Estilo".
¡Que lo disfrutes!

SUPER MACD📈 MACD Indicator Update - Version 2
🔹 New Features and Improvements:
1️⃣ New MACD Calculation Options:
Users can now choose from various Moving Averages to calculate the MACD. The default options are SMA (Simple Moving Average) and EMA (Exponential Moving Average), but there are 14 other versions available to experiment with:
SMA (Simple Moving Average)
EMA (Exponential Moving Average)
WMA (Weighted Moving Average)
RMA (Smoothed Moving Average)
HMA (Hull Moving Average)
JMA (Jurik Moving Average)
DEMA (Double Exponential Moving Average)
TEMA (Triple Exponential Moving Average)
LSMA (Least Squares Moving Average)
VWMA (Volume-Weighted Moving Average)
SMMA (Smoothed Moving Average)
KAMA (Kaufman’s Adaptive Moving Average)
ALMA (Arnaud Legoux Moving Average)
FRAMA (Fractal Adaptive Moving Average)
VIDYA (Variable Index Dynamic Average)
2️⃣ Improved Input Visibility and Organization:
We’ve reorganized the inputs so that the most commonly used ones are now placed at the beginning for quicker and more convenient configuration.
3️⃣ Bug Fixes and Code Improvements:
Minor bugs have been fixed, and the code has been optimized for better stability and performance. The code is now cleaner and fully functional in version 6.
4️⃣ Cometreon Public Library Integration:
To lighten the code and improve its modularity, we’ve integrated the Cometreon public library. This makes the code more efficient and reduces the need to duplicate common functions.
☄️ With this update, the MACD indicator becomes even more versatile and user-friendly, offering a wide range of calculation methods and an improved interface!

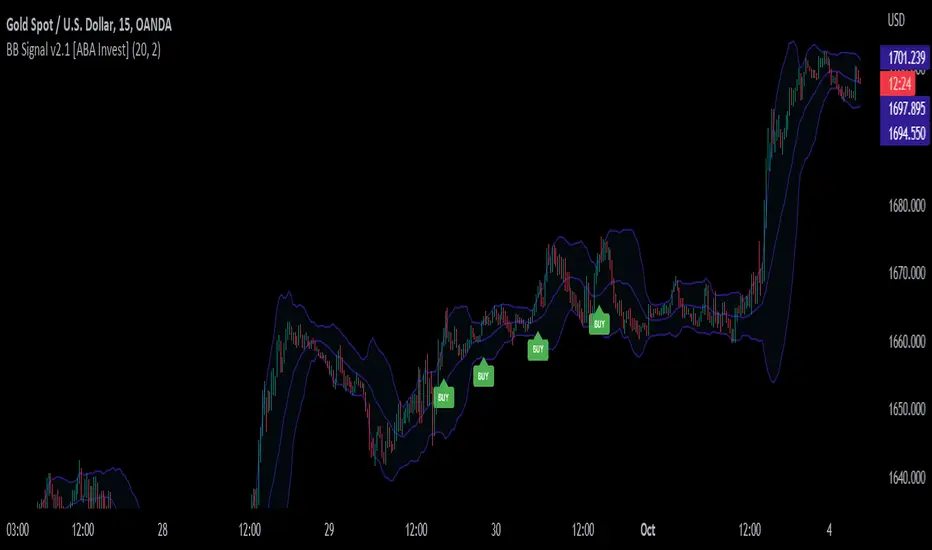
BB Signal v2.1 [ABA Invest]About
This signal appears based on 2nd candle break out of Bollinger Bands (called Momentum) with additional EMA 50 and EMA 200 as trend filters. so the concept is to take advantage of candle breakout by following trends.
How to use
Buy: When signal 'Buy' appears (following trend of upper timeframe)
Recommended stop loss: previous swing low
Sell: When signal 'Sell' appears (following trend of upper timeframe)
Recommended stop loss: previous swing high
Rules
1. use a good risk-reward ratio (minimum 1.5)
2. Please do backtest before using this signal
3. Don't always take every signal (must know when to stop)
Sideways Strategy DMI + Bollinger Bands (by Coinrule)Markets don’t always trade in a clear direction. At a closer look, most of the time, they move sideways. Relying on trend-following strategies all the time can thus lead to repeated false signals in such conditions.
However, before you can safely trade sideways, you have to identify the most suitable market conditions.
The main features of such strategies are:
Short-term trades, with quick entries and quick exits
Slightly contrarian and mean-reversionary
Require some indicator that tells you it’s a sideways market
This Sideways DMI + Bollinger Bands strategy incorporates such features to bring you a profitable alternative when the regular trend-following systems stop working.
ENTRY
1. The trading system requires confirmation for a sideways market from the Directional Movement Index (DMI) before you can start opening any trades. For this purpose, the strategy uses the absolute difference between positive and negative DMI, which must be lower than 20.
2. To pick the right moment to buy, the strategy looks at the Bollinger Bands (BB). It enters the trade when the price crosses over the lower BB.
EXIT
The strategy then exits when the move has been exhausted. Generally, in sideways markets, the price should revert lower. The position is closed when the price crosses back down below the upper BB.
The best time frame for this strategy based on our backtest is the 1-hr. Shorter timeframes can also work well on certain coins that are more volatile and trade sideways more often. However, as expected, these exhibit larger volatility in their returns. In general, this approach suits medium timeframes. A trading fee of 0.1% is taken into account. The fee is aligned to the base fee applied on Binance, which is the largest cryptocurrency exchange.

MadriEsta estrategia fue creada por mi, basándose en el indicador bollinger bands+rsi y una ema , forexstrategiesresources me lo pasó a codigo y despues fue publicado en ChartArt y en la pagina web de forexstrategiesresources.
Ahora este script lo he modificado para optimizarlo para BTC /USDT en la temporalidad de 1 hora, os invito a ir cambiando temporalidades y valores para conseguir la mayor rentabilidad y, al igual que yo lo publico en codigo abierto os invito a que pongáis vuestros ajustes en los comentarios.
Los ajustes que se pueden cambiar para buscar mayor rentabilidad son en primer lugar "lo que se puede cambiar desde el mismo grafico" los valores "A" y "B".
Además, en el codigo el valor "RSIoverSold" y el "RSIoverBought" por mi experencia con menos de 30 no suele ir bien y con mas de 70 tampoco, el rango adecuado es de 29 a 49, incluidos.
Yo no he trasteado mucho pero también os invito a cambiar la fuente de entrada de "close" a "high", "open", "low"...
Recomiendo para la configuración ACTUAL mismo símbolo, mismos valores operar las señales Short cuando el precio este por debajo de la EMA de 900 y operar las Long cuando este por encima.
En otros símbolos la cosa cambia, hay que adaptarlo a cada cosa.

Trend Following with Bollinger BandsThis is a trend following system which uses the Bollinger Bands instead of the Donchian Channels.
Long position:
* Price closes above the middle line.
* The fast EMA (in this case the 40) crosses over or is above the slow one (in this case the 120)
Short position:
* Price closes below the middle line.
* The fast EMA crosses under or is below the slow one.
Stoploss:
* 4 ATRs away from the price.

Bollinger Bands And Aroon Scalping (by Coinrule)Many technical indicators can be profitable in certain market conditions while failing in others. No indicator is perfect alone.
All the best trading strategies involve multiple indicators and leverage the benefit of each of them. The following is an optimised strategy based on Bollinger Bands and the Aroon indicator.
The Bollinger Bands are among the most famous and widely used indicators. They can suggest when an asset is oversold or overbought in the short term, thus provide the best time for buying and selling it.
A strategy buying dips can work well during times of uptrend. Downtrends will result in a drawdown for the P&L of the strategy. The suggested approach minimises the drawdowns, ensuring that the system trades only when it's more likely to close the trade in profit.
The Setup
ENTRY
The price crosses below the basis line of the Bollinger Band indicator
The Aroon Indicator is above 90
EXIT
The price crosses below the upper Bollinger Band
The Aroon Indicator drops below 70
The Aroon Indicator plays a key role in this strategy. It acts as a confirmation that the asset is currently in an uptrend. On the other hand, it acts as a stop if market conditions deteriorate. The strategy uses an Aroon Indicator set to 288 periods to provide a longer-term view on market conditions, not being heavily dependent on short-term volatility.
The best time frame for this strategy based on our backtest is the 4-hr . The 1-hr can work well with three times more trades, on average. As trades increase, the profitability decreases. Yet again, this is the confirmation that trading more does not mean gaining more.
To make the results more realistic, the strategy assumes each order to trade 30% of the available capital. A trading fee of 0.1% is taken into account. The fee is aligned to the base fee applied on Binance, which is the largest cryptocurrency exchange.

Bollinger Band with RSI
Using combination bollinger band and RSI indicator as guide to predict price volatility and the best entry point. The strategy logic is pretty straightforward where we're interested with close price that touches the lower bollinger band ; there are only two scenarios that will happened after the price reaches the lower band; the price might rebound from the lower bollinger band or drop lower and continue downtrend. To confirm the price movement, we use a second indicator which is the RSI to further investigate the price trend. For example, if the price reaches the lower bollinger band but the RSI value is not in the oversold region, we can conclude that the price will go lower and continue downtrend. If the RSI value is in the oversold region, we can use this price area as our entry point.
Stop loss is necessary to avoid losing too much capital if the RSI value lingers too long in the oversold region.
Best take profit area is when the price rebound above the middle bollinger band area/upper bollinger band or when the RSI reaches overbought region; whichever comes first.
Long entry:
RSI < 30 & close price < lower bollinger band
Exit entry:
RSI > 70
Default stop loss: -25%

Sentinel Program - A Bollinger Band Strategy, with alertsThis script plots the Bollinger Bands and confirms entry and exits by using RSI values, Stoch, and ADX Curve. Works on any time-frame.
The scope of the script is to reduce the number of fake breakouts to prevent further declines when entering positions. Often times when using Bollinger bands, a close below the lower band presents a buying opportunity but there is further movent to the downside and vise versa when taking profits.
Entry Conditions
Prior candle low below lower band
RSI above 30
Stochastic crossover above 20
ADX curve greater than 25
Exit Conditions
Prior candle highw above upper band
RSI crosses below 70
Stochastic crossunder above 80
Each of the above values can be adjusted in the inputs menu to fine-tune your entry and exit positions.
Using COINBASE:ETHUSD we can see that the conditions have been met before plotting buy and sell signals.
I have added alerts to help identify possible entry and exits and from there I manually enter or exit / adjust stop-loss. For example, sometimes it will print a sell signal because stochastic crossed over but RSI is still rising so I will adjust a tighter stop-loss to capture further gain if they are there.
Test it out, adjust the settings to see if you can find better results, and let me know!

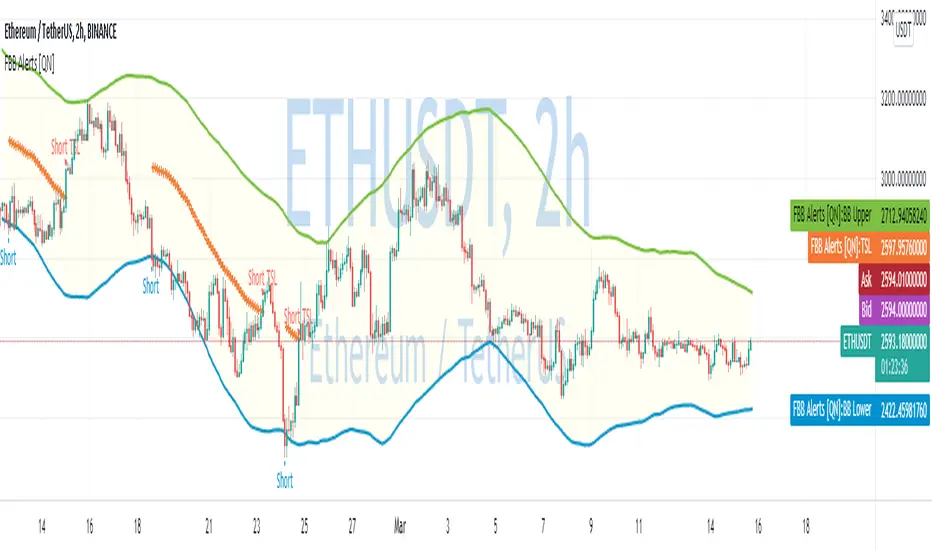
Fibonacci Bollinger Bands Alerts [QuantNomad]These are alerts for my Fibonacci Bollinger Bands Strategy. You can find more details and strategy description in it:
It's a pro indicator, you can have access to it for a small fee. Link to my PRO indicators you can find in my signature.
Disclaimer
Please remember that past performance may not be indicative of future results.
Due to various factors, including changing market conditions, the strategy may no longer perform as good as in historical backtesting.
This post and the script don’t provide any financial advice.
Fibonacci Bollinger Bands Strategy [QuantNomad]This strategy is modified Stanard Bollinger Bands Strategy. Instead of using standard deviation, I use a metric of how big is the range for the last X bars. Also, I’m using Fibonacci levels as multipliers for BB.
In this strategy you have a choice of 3 different Trailing Stop Loss types:
Standard % – standard percent based TSL
Fibonacci Level – close your position on another Fibonacci level or basis line of BB.
Parabolic SAR – Parabolic SAR adapted as trailing stop loss.
For Standard % and Parabolic SAR, you can use the “TSL Offset” parameter to set an initial offset for trailing stop loss.
Parameters
BB Length – Bolinger Bands Length
Fib Entry Level – Entry BB Multiplier level. Can be one of Fibonacci levels: 0.236, 0.382, 0.5, 0.618, 0.786, 1.000
Trailing SL Type – Type of Trailing Stop Loss used to close positions. Can be one of 3 types: “Standard %”, “Fibonacci Level”, “Parabolic SAR”
TSL Offset (%) – Initial offset for TSL. Applicable to “Standard %” and “Parabolic SAR”
TSL Fib Level – Fibonacci level used for “Fibonacci level” type of TSL
TSL PSAR Start / Increment / Maximum – parameters for PSAR type of TSL.
Strategy side – you can choose the side of the strategy. You can require strategy to go only Long, Short to Both sides.
From/To Day/Month/Year – you can use these parameters to set backtesting range to check the performance of your strategy on a specific range
It's a pro indicator, you can have access to it for a small fee. Link to my PRO indicators you can find in my signature.
Disclaimer
Please remember that past performance may not be indicative of future results.
Due to various factors, including changing market conditions, the strategy may no longer perform as good as in historical backtesting.
This post and the script don’t provide any financial advice.

ORTI Bollinger Bands V3 (Static Timeframe Multi-Period)The "ORTI Bollinger Bands V3 (Static Timeframe Multi-Period MA)" is public scrypt, based in a previous study, but with some better functions (“ORTI Bollinger Bands V2 (Static Timeframe Multi-Period MA”).
This is a redesigned and recalculated set of the common plotted lines with the typical two "Standard Deviations" (positively and negatively) away from the original calculation of a "Simple Moving Average" of the security's price.
But now, with the option to convert the "Simple Moving Average" to adapt into 9 different kinds of "Moving Averages", to have a much more robust indicator which in turn would serve both as "Bollinger Bands" and by any of the most used "Moving Averages", a hybrid basically.
The following options to convert the "Simple Moving Average" ( SMA ) to:
• Exponential Moving Average ( EMA )
• Weighted Moving Average ( WMA )
• Arnaud Legoux Moving Average ( ALMA )
• Hull Moving Average ( HMA )
• Volume-weighted Moving Average ( VWMA )
• Least Square Moving Average ( LSMA )
• Smoothed Moving Average ( SMMA )
• Double Exponential Moving Average ( DEMA )
The cherry on the top , for this private version: is when you want to get a predetermined count in "natural temporalities" as minutes, hours or days, in any graph you could get a static average, and this count will be automatically respected. For example, a "Moving Average" could be configurated to know a trend per day, week or month... or whatever comes to mind, and at every single chart that you move through (5m, 15m, 1h, 4h, etc), you will see the same average to make your own "trend analysis" into a micro/macro market view.
As in traditional "Bollinger Bands", the "Standard Deviations" are still a measure of volatility , when markets become more volatile, bands widen, during the less volatile periods, the bands contract.
A common fact in trading is that, prices vary most of the time and there is a lot of truth in this assertion, since the markets consolidate mainly as bullish andbearish . Market trends are sometimes very rare, so trading them may not be as easy as you might think. If we look at prices in this way, we can define the trend as a deviation from the norm (rank).
Usually, most Traders use “Moving Averages” to identify commercial areas and analyze markets. A “Moving Average” helps the Trader isolate the trend a lot and can also indicate when a trend may be receding.
The importance of using any of the “Moving Averages” in the “Bollinger Bands”, becomes a reality and reveals the average price of a marketable instrument in a given period of time. However, there are different ways to calculate the averages, and that is why there are different types of “Moving Averages”. They are called "in motion" because, as the price moves, new data is added to the calculation, thus changing the average.
The base of the “Bollinger Bands” measures and represents the deviation or volatility of the price and this is the reason why they can be very useful to identify a trend. Even the use of two sets of “Bollinger Bands”, one generated with the parameter "one Standard Deviation" and the other with the typical configuration of "two Standard Deviations", can help us to see the price in a different way.
Another great advantage of “Bollinger Bands” is that, they adjust dynamically as volatility increases and decreases. As a result, the “Bollinger Bands” automatically expand and contract in synchronization with the price action, creating an envelope of precise trends.
Note: The previous calculation example is not the default, the parameters can be adjusted according to the criteria of the merchant.
As everyone knows, and as you can find on the internet, the "Moving Averages" are one of the most commonly used technical indicators in Stock, Futures , Forex and Crypto trading. Market analysts and traders, use "Moving Averages" to help identify trends in price fluctuations, smoothing out the noise and short-lived spikes (from news and earnings announcements, for example) for individual securities or indexes.
They are calculated by adding recent closing prices and then dividing that by the number of time periods in the calculation average. A simple, or arithmetic, a "Moving Average" that is calculated by adding the closing price of the security for several time periods and then dividing this total by that same number of periods. Short-term averages respond quickly to changes in the price of the underlying, while long-term averages are slow to react.
There are different types of "Moving Averages", calculated in different ways and over different time periods, which reveal different information for traders. The type of "Moving Average" and measurement period used determine the strategies a trader implements. So, many traders watch for short-term averages to cross above longer-term averages to signal the beginning of an uptrend. Short-term averages can act as levels of support when the price experiences a pullback.
As is usual, traders and market analysts commonly use several periods in creating "Moving Averages" to plot on their charts. For identifying significant, long-term support and resistance levels and overall trends, but they only consider the 50-day, 100-day and 200-day moving averages as the most common. Based on historical statistics, these longer-term moving averages are considered more reliable trend indicators and less susceptible to temporary fluctuations in price.
There is such popular trading patterns that use "Simple Moving Averages" include the “death cross” and a “golden cross”. A “death cross” occurs when the short period "Moving Average" crosses below the long period "Moving Average" and this is considered abearish signal that further losses are in store; the “golden cross” occurs when a short-term "Moving Average" breaks above a long-term moving average, this can signal further gains are in store, that is interpreted as bearish .
The 5-, 10-, 20-, and 50-day moving averages are often used to spot near-term trend changes. Changes in direction by any of these shorter-term "Moving Averages" are watched as possible early clues to longer-term trend changes. Crossovers of the 50-day moving average by either the 10-day or 20-day "Moving Averages" are regarded as significant. The 10-day "Moving Average", plotted on an hourly chart, is frequently used to guide traders in intraday trading.
For more technical information: Investopedia
But why we have to use in our TECHNICAL ANALYSISthe same Moving Averages (10, 20, 30, 50, 100 and 200) for all time frame OHLC charts (1m, 5m, 15m, 1h, 4h, 1d, 1w and 1m)? That does not make any sense.
This is when you must go back to (statistic) basics: reliability and validity are a very important aspects of selecting a survey instrument. Reliability refers to the extent that the instrument yields the same results over multiple trials. Validity refers to the extent that the instrument measures what it was designed to measure.
Content validity measures the extent to which the items that comprise the scale accurately represent or measure the information that is being assessed. Are the real traders answering this question, that are asked representative of the possible data that they are trying to read? Well, I think maybe not.
Such as correlations, to verify the relevance of the “timeframe” questions, we could start at… Operation hours, the first data that has you should find may be is correlated with questions from: Does your trend indicator has a straight relationship of time under your time-analisys examination to determine if validity is present? If the scores are highly correlated, it is called convergent validity, then if convergent validity exists and validity is supported.
Criterion-related validity has to do with how well works the counting from the instrument, as a known outcome they are expected in a real, natural and measurable lapse time. Such as correlations are used to determine if criterion-related validity your counting data, would must be at: minutes, days, weeks, months, etc.
That is when we start with the rhythm, as in music. If your trading day in operation at Forex is made up of 24-hours, during 5-days of the week, there you have your first clue. Now, what did you want and have to measure? Well, first of all you need a daily, weekly and monthly count to begin with all your indicators.
For some reason, there are a lot of questions about time and calendars which all are answered by reference to astrology, because the original purpose of astrology was to create a reliable method of measuring the passage of time, the clock by which we live our lives: 12 Hours. It is very interesting!
Even though there are really 24 hours in a day, but therefore you would think we should have 12-time units in our day, not 24, each of which is twice as long as our current hour. But the only reason we would think like this is because we have forgotten about the way ancient astrology divides the time lapses into smaller units.
And now, the next step is when you should refresh your elementary school classes, those mathematics that I'm pretty sure you so hated: relation of prime numbers, compound numbers, divisible numbers and multiples.
You may think about the relationship that exists between the time period and the operative session, as well as the chart that you are consulting; so then, you must find the ideal configuration of those numbers that are only divisible between themselves and 1, or the numbers that besides being divisible by themselves and the unit and are also divisible by other numbers.
For example: for an hourly chart, if a day is divided into 24-hours in base of the number 12, is because it has a larger number of integer factors: 12/6=2, 12/4=3, 12/3=4, 12/2=6. Son then, all of your other indicators should find this relation.
This is when you must start questioning yourself, if you are really working with an adequate configuration of Moving Averages and Oscillators?
Another example:
• Relative Strength Index (14)
• Stochastic %K (14, 3, 3)
• Commodity Channel Index (20)
• Average Directional Index (14)
• Momentum (10)
• MACD Level (12, 26, 9)
• Stochastic RSI Fast (3, 3, 14, 14)
• Williams Percent Range (14)
• Ultimate Oscillator (7, 14, 28)

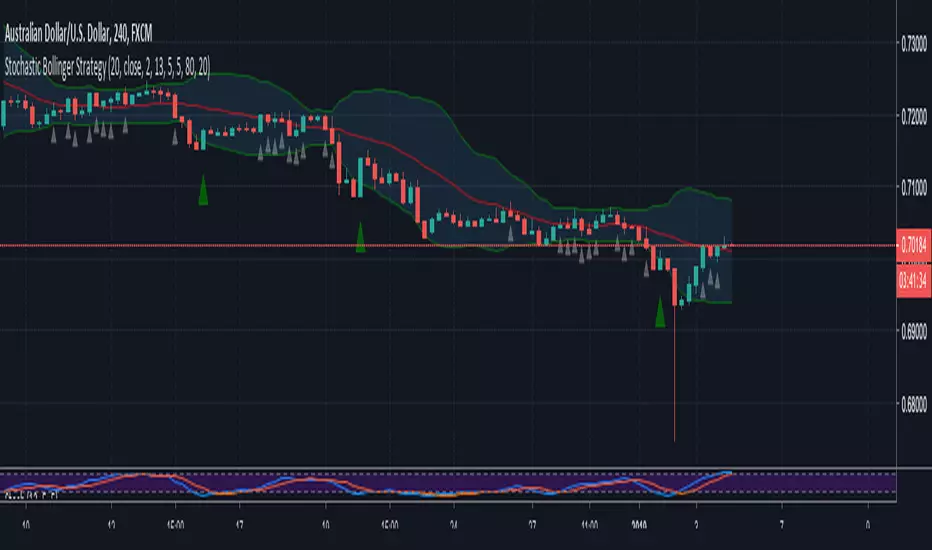
Stochastic Bollinger StrategyBollinger defaults = 20, close, 2
Stochastic defaults = 13, 5, 5
Buy Signal (GREEN triangle):
BULLISH candle formed
Candle OPEN is LESS than LOWER Bollinger Band
Stochastic (K) is LESS than 20
Sell Signal (RED triangle):
BEARISH candle formed
Candle OPEN is GREATER than UPPER Bollinger Band
Stochastic (K) is GREATER than 80
Read more about the strategy and where to set buy stops and sell stops here: swing-trading-strategies.com
4 Bollinger Bands and 2 Exponential Moving Averages This script contains multiple indicators of 3 types for better visibility and without having to select multiple indicators one by one and hence saving your time and energy. Also, minimum number of variables are being used in the script for better calculation speed and implementation .
This script is best suited for beginners who are not using pro version and finding it difficult to implement more than 3 indicators on a single chart layout :)
Indicators used :
1. Hybrid of Simple Moving Average and Bollinger Bands .
In this Indicator user can use total of 4 Moving Averages or 4 Bolinger Bands or both (eg: 3 Bolinger bands and 1 Simple Moving Average).
> How to use :
If you want to use Bollinger Bands simply check the boxes of all the 'Upper' and 'Lower' Bands under indicator format/settings.
Else if you want to use Simple Moving Average simply uncheck the boxes of all the 'Upper' and 'Lower' Bands under indicator format/settings.
Tip : You are free to experiment with the format/settings to use both Simple Moving Average and Bollinger Bands using 'MA Length' and 'StdDev'
(standard deviation).
2. Exponential Moving Average
In this indicator user can use 2 Exponential Moving Averages .
> How to use :
If you want to use 2 Exponential Moving Averages simply check 'Enable 2nd EMA' under format/setting inputs.
Else if you want to use only 1 Exponential Moving Average simply uncheck 'Enable 2nd EMA' under format/setting inputs.
Tip : You are free to experiment with both 'EMA_Length1' and 'EMA_Length2' and change it as per your requirments.
//Feel free to ping/DM me for any explaination on how to use this script as your ultimate trading strategy.

RSI + BB (EMA) + Dispersion (2.0)First version here
Initial data:
1) RSI
2) Bollinger Bands (Basis - EMA )
3) Dispersion (around basis)
Signal for purchase: RSI crosses the dispersion zone upwards
Signal for sale: RSI crosses the dispersion zone downwards
Buffer zone: white area, it is not recommended to make transactions.
--- Add ( 02.10.2018 )
1) RSI lines (overbought / oversold) = 70 / 30. Сan be changed in the settings.
2) Alerts:
• RSI line crossover Dispersion Zone (green)
• RSI line crossunder Dispersion Zone (red)

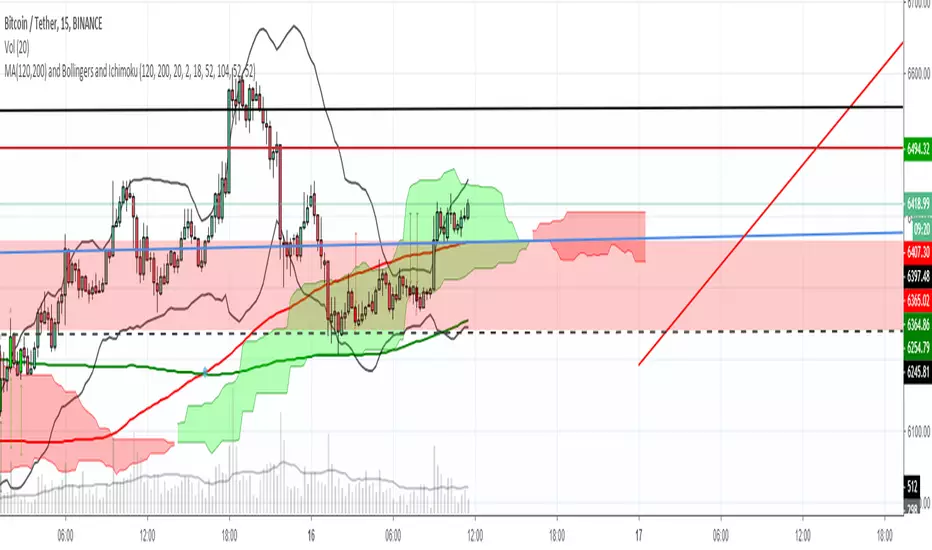
MA(120,200), Bollingers and IchimokuFor you, people who want to put money in trading instead of Tradingview, and still want to have more than 3 indicators ❤
BB and RSI Indicator Alert v0.3 by JustUncleLI have just recently revised this indicator alert for public release. This is for the 60sec Bollinger Band break Binary Option traders.
This indicator alert is a variation of one found in a well known Broker's marketing videos. It uses Bollinger bands, RSI and moving averages. Included is a pre-warning alert condition. The strategy and settings are designed for 1min charts and Binary Options, but it could work for up to 15 min charts.
The default settings are BB(14,2) and RSI(11) with 75/25 Levels boundaries. To be a valid trade the RSI needs to be within 75/25 channel. The optional Market direction filter is enabled by default and is calculated by two EMA (200 and 50):
When 200ema rising and 50ema above 200ema then market going up.
When 200ema falling and 50ema below 200ema then market going down.
A potential Bollinger Break reversal trades identified by shapes: The purple diamond is the pre-warning purple alert and the green and red pointers with the PUT/CALL labels are the trade alerts. Make Binary Option trade in specified direction 60sec (or can also use 120sec trade without Martingale).
* Notes and Hints *
The original videos specified a Martingale money management strategy, be careful using this management. When I use Martingale I recommend go to 3 levels: 10, 25, 65 if no win at 65 stop trading this alert and start next alert back at 10, you should recovery loss by future wins given you are able to get a reasonable ITM rate with this strategy. Alternatively instead of using Martingale use 120sec Binary Option trade.
Be wary of break alerts on a steep Bollinger, they tend to keep running away for awhile, especially if steep on both sides of Bollinger channel.
As with most of this style of indicator the alert conditions will redraw until the candle is closed. For me this is okay, as it is an Alert is only to a potential trade and final decision to trade is made by me.
You need to practise this and be aware of market news, sessions boundaries, slow trading periods etc. Plan your periods of when you should trade, I prefer Asian session before lunch and London sessions.

Simple Bollinger Bands Toolkit™TradeChartist Simple Bollinger Bands Toolkit is a useful set of Bollinger Bands based utilities, which includes 0 mean %B Oscillator , price volatility based BB Width , actual Bollinger Bands and BB Breakout Signals .
===================================================================================================================
™TradeChartist Simple Bollinger Bands Toolkit Features
================================================
Modified %B Oscillator with 0 as its mean
%B Oscillator Over-Bought (typically values > 80/90/100) and Over-Sold zones (typically values < - 80/-90/-100) can be displayed by enabling Show Over-Sold/Over-Bought Zones .
Highs and Lows of the %B Oscillator are displayed to help visualize Divergences.
BB Width as Price Volatility (BB Upper Band - BB Lower Band) can be displayed to visualize BB Squeeze zones.
Actual Bollinger Bands can be plotted by enabling Display Bollinger Bands . To display on main price chart, just move the BB Toolkit to price chart and merge the scales.
Breakout Signals can be displayed by enabling Display Bollinger Bands and Show BB Breakout Signals . This also displays background fill to help visualize the zones since the breakouts of upper/lower bands happened.
The BB Basis/Mean line is colour coded based on the %B Oscillator (%B>0 - Green, %B<0 - Red).
The Toolkit uses Simple Moving Average (SMA) for the basis line.
The default length is 55 and default Standard Deviation is 1. %B Oscillator can be smoothed (default - 5) using EMA to minimize noise. (Use 20 length and 2 standard deviation for classic Bollinger Bands).
Price Bars on the Main Price chart can be coloured by enabling BB Colour Bars .
===================================================================================================================

Bollinger Bands Width and Bollinger Bands %BThis script shows both the Bollinger Band Width(BBW) and %B on the same indicator window.
Both the BBW and %B are introduced by John Bollinger(creator of Bollinger Bands) in 2010.
Default Parameter values: Length = 20, Source = Close, Mult = 2
Bollinger Bands Width (BBW): Color = (Default: Green )
- I consider stocks with "BBW >= 4" are at a volatile state and ready for price contraction, but this depends on the parameter values of your choice.
Bollinger Bands %B (%B): Color = (Default: Blue )
1. %B Above 10 = Price is Above the Upper Band
2. %B Equal to 10 = Price is at the Upper Band
3. %B Above 5 = Price is Above the Middle Line
4. %B Below 5 = Price is Below the Middle Line
5. %B Equal to 0 = Price is at the Lower Band
6. %B Below 0 = Price is Below the Lower Band

Alert// Short+long: SAR+HMA+Bollinger+support/resistanceHello, dear friends.
This script can be used for various strategies. Whether it's a scalp like now or more positional purchases. To determine the minimum and maximum, SAR ,resistance points, support points+HMA+ Bollinger channel are used. The entry occurs when the SAR intersects with the HMA , if it is above or below the support/ resistance levels.
In the settings there is a "back" how many bars to use back to search for these conditions.Also the standard setting is SAR+ multiplier.
The strategy based on these alerts is the same, but the conditions stipulate that the entry into the deal does not occur (while you are in the deal) if the purchase is more expensive than the previous one.
