Short in Bollinger Band Down trend (Weekly and Daily) // © PlanTradePlanMM
// 6/14/2020
// ---------------------------------------------------
// Name: Short in Bollinger Band Down trend (Weekly and Daily)
// ---------------------------------------------------
// Key Points in this study:
// 1. Short in BB Lower band, probability of price going down is more than 50%
// 2. Short at the top 1/4 of Lower band (EMA - Lower line), Stop is EMA, tartget is Lower line; it matches risk:/reward=1:3 naturally
//
// Draw Lines:
// BB Lower : is the Target (Black line)
// BB EMA : is the initial Stop (Black line)
// ShortLine : EMA - 1/4 of (Stop-target), which matches risk:/reward=1:3
// Prepare Zone : between EMA and ShortLine
// shortPrice : Blue dot line only showing when has Short position, Which shows entry price.
// StopPrice : Black dot line only showing when has Short position, Which shows updated stop price.
//
// Add SMA50 to filter the trend. Price <= SMA, allow to short
//
// What (Condition): in BB down trend band
// When (Price action): Price cross below ShortLine;
// How (Trading Plan): Short at ShortLine;
// Initial Stop is EMA;
// Initial Target is BB Lower Line;
// FollowUp: if price moves down first, and EMA is below Short Price. Move stop to EMA, At least "make even" in this trade;
// if Price touched Short Line again and goes down, new EMA will be the updated stop
//
// Exit: 1. Initial stop -- "Stop" when down first, Close above stop
// 2. Target reached -- "TR" when down quickly, Target reached
// 3. make even -- "ME" when small down and up, Exit at Entry Price
// 4. Small Winner -- "SM" when EMA below Entry price, Exit when Close above EMA
//
// --------------
// Because there are too many flags in up trend study already, I created this down trend script separately.
// Uptrend study is good for SPY, QQQ, and strong stocks.
// Downtrend Study is good for weak ETF, stock, and (-2x, -3x) ETFs, such as FAZ, UVXY, USO, XOP, AAL, CCL
// -----------------------------------------------------------------------------------------------------------------
// Back test Weekly and daily chart for SPY, QQQ, XOP, AAL, BA, MMM, FAZ, UVXY
// The best sample is FAZ Weekly chart.
// When SPY and QQQ are good in long term up trend, these (-2x, -3x) ETFs are always going down in long term.
// Some of them are not allowed to short. I used option Put/Put spread for the short entry.
//
在腳本中搜尋"bollingerband"

Buy in Bollinger Band uptrend (Weekly and Daily) // © PlanTradePlanMM 6/14/2020
// ---------------------------------------------------
// Name: Buy in Bollinger Band uptrend (Weekly and Daily)
// ---------------------------------------------------
// Key Points in this study:
// 1. Long in BB Upper band, probability of price going up is more than 50%
// 2. Buy at the bottom 1/4 of upper band (Upper line - EMA), Stop is EMA, tartget is Upper line; it matches risk:reward=1:3;
//
// Draw Lines:
// BB Upper : is the Target (Black line)
// BB EMA : is the initial Stop (Black line)
// BuyLine : EMA20 + 1/4 of (Target-Stop), which matches risk:/reward=1:3 naturally
// Prepare Zone : between EMA and BuyLine
// buyPrice : Blue dot line only showing when has long position, Which shows entry price.
// StopPrice : Black dot line only showing when has long position, Which shows updated stop price.
//
// Add SMA(50) to filter the trend. Price >= SMA, allow to long
//
// What (Condition): in BB uptrend band
// When (Price action): Price cross over BuyLine;
// How (Trading Plan): Buy at BuyLine;
// Initial Stop is EMA;
// Initial Target is BB Upper Line;
//
// FollowUp: if price moves up first, and the EMA is higher than Entry point, Use EMA as new stop. At least "make even" in this trade;
//
// Exit: 1. Initial stop -- "Stop" when down first, close below stop price.
// 2. Target reached -- "TR" when up quickly, Target reached
// 3. make even -- "ME" when small up and down, Exit at entry Price
// 4. Small Winner -- "SM" when EMA above Entry price, Exit when close below EMA, and higher than entry Price
//
// --------------
// Because there are too many flags in up trend study already, I will create a down trend script separately.
// Uptrend study is good for SPY, QQQ, and strong stocks.
// Downtrend Study is good for weak ETF, stock, and (-2x, -3x) ETFs, such as FAZ, UVXY, USO, XOP, AAL, CCL
// -----------------------------------------------------------------------------------------------------------------
// Back test Weekly and daily chart for SPY, QQQ
// If it will be a big Gap down or a big down move, stop at close price could be a big loss; But this way could avoid may noise, to stay in a trending position longer.
// When buy in trending move, the position could be hold for a big range.
// The best samples are SPY and QQQ daily chart.
//
// Better to use another way to verify the long term up trend first.
// For single stock, it is better shows more relative strength than SPY.

Bollinger Bands Strategy - CohenIndicator based on the “Prince of NY” strategy developed by Rodrigo Cohen .
It consists in the use of Bollinger Bands, combined with a coloring rule to indicate places of purchase and sale.
An entry signal is given when a candle close outside the band, where, if the next one closes inside, there is the entrance, looking for the MA or the other band.
Red candle - indicates a sell signal.
Green candle - indicates a buy signal.

Double Bollinger Bands StrategyThe Strategy involves two Bollinger Bands (BB) at a go.
One with Divergence of 1 and another 2.
Strategy:
When the price rides above the inner BB, buy, check if it rides above the second BB. Exit when price falls inside the Outer BB and enters the Inner BB.
When the price rides below the inner BB, buy, check if it rides below the second BB. Exit when price rises inside the Outer BB and enters the Inner BB.
Bollinger Band BreakoutIt is a long only strategy.
1. Buy when price breaks out of the upper band.
2. Exit has two options. Option 1 allows you to exit using lower band. Option 2 allows you to exit using moving average.
3. Option 1 preferred over option 2 if the instrument is highly volatile.
4. Slippage and commissions are not considered in the return calculation.

BBPivotIt can helps you to see BB pivots . It's based on bollinger bands .
Best Settings: (20,3) - (50,2)
Cheers :)

MTF Bollinger Bands - ModifiedModified version of tansancrypto's MTF Bollinger to Pinescript 4 and removed limiters on BB1/BB2 max Sigma values.
Original Script:

Bollinger bands/Lagging span crossHello my dear ambitious traders
I'm working hard this week to publish some great indicators this week and open sourced. Hope you'll enjoy, learn and use them.
This will be my greatest reward but comments showing appreciation are also very welcomed (actually likes too) :)
For today, I'll share a simple indicator but it's coming along with some insightful knowledge ^^
Anyway, I'm not here to ask you to this but to share a very cool indicator I made a few months ago and wanted to share for FREE with the community today
The indicator is related to this educational post : What-a-Bollinger-Bands-Lagging-span-cross-can-tell-us/
This trading technique was invented by Robbytrade, a famous french trader twitter.com
I wanted to have those visual signals on the chart so I coded it.
The advantage of being a developer is that you can litteraly code what you miss and get your life better in the process. The one that will find a way to code a new form of money will be rich... wait.... that guy is called Satoshi Nakamoto...
That's all for me today my friends
PS
Trying to update the Trade Manager shared yesterday with some cool features. More to come in the upcoming days
Enjoy
Dave

BB - Study - CryptoFoudid.comHi everyone,
A new script transformed on a study from QuantNomad.
Based on the Bollinger Bands to catch the range market.
I filtered the consecutive signals to avoid a "funding" issue.
You can configure it as you want based on inputs.
The best way for crypto is to have about 45 to 55 length and 2 to 3.5 in multiplier but it's your choice :)
ENJOY !

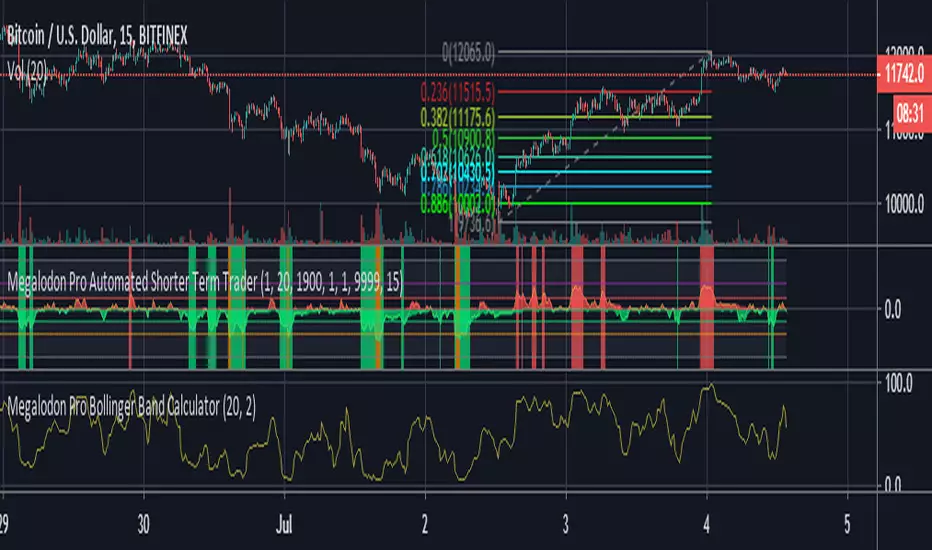
Megalodon Pro Bollinger Band CalculatorHow to use?
It ranges between 0-100. 0 is oversold, 100 is overbought.
It could be a really beneficial tool for timing your day trades in lower time frames.
It is designed for 1 minutes - 15 minutes - 30 minutes - 60 minutes - 240 minutes - 1 Day time frames.
Bollinger Bands Trading SignalsFeatures:
Trading signals based on Bollinger Bands trading strategy.
Powerful filter algorithm helps you avoid counter trade in trending market.
Getting Started:
Replace your Bollinger Bands indicator with this one.
You can see the trading signals and bands at the same time.
Contributing:
You can report bugs or issues under this page.
Any advice would be helpful for improving this indicator's accuracy.
Application:
This is an invite-only indicator.
Bollinger_Bands_Strategy(Add Function) - BB Free (By Wolf)전략 및 지표 얼러트등 파인스크립트 제작 문의 - 트레이딩뷰 메시지
Contact to create strategy and indicators add alert etc - TradingView Message
이름(Name)
Bollinger Bands Strategy (Add Function) (By Wolf)
-해당 전략은 Long & Short 의 신호를 발생시키는 전략입니다.
-The strategy is to generate a signal from Long & Short
기능 추가(Add Function)
-Trade Direction Long
-Trade Direction Short
-Stoploss ($)
-Profit target($)
-Backtest date
해당 전략은 수익률이 높은값으로 임의로 변경해놓았습니다
본인의 투자전략에 맞는 수치로 변경하여 사용하셔도 좋습니다.
*I entered the value with good profits settings for the strategy.
You can use this customarily
소스코드(Source code)
-비공개 (not open to the public)
*모든 전략은 리페인트 코드를 등록하지않았습니다.
-All strategies do not register the repaint code
*모든 전략 및 지표의 백테스트 결과는 BITMEX Fee 0.075% 를 입력한 결과값입니다.
-The back test result for all strategies and indicators is the result of inputting BITEX Fee 0.075%
*모든 거래는 높은 위험을 수반하며, 과거 백테스트 결과가 반드시 현재 및 미래의 결과를 나타내는것은 아닙니다.
가상 또는 시뮬레이션 백테스트 결과는 한계를 가지고 있으며 실제거래와 시장의 변동 및 유동에 따라 똑같지않을
가능성이있으며, 모든 손실에 대한 책임은 본인에게 있습니다.
-All trade involve high risk, and past backtest results do not necessarily represent current and future results.
Virtual or simulated backtest results have limitations and are not consistent with actual transactions and market changes and flows
It is possible and you are responsible for any loss.

BB Filtered AlertsBollinger Band signals filtered with dual RSIs and EMA.
EMA confirms trend.
Signals above EMA are filtered with "Uptrend RSI" filter
Signals below EMA are filtered with "Downtrend RSI" filter
There is no "one size fits all" setting. Settings are very period and name specific, depending on ATR.
EMA Bollinger Bands w/ Breakout Signals (EMA BBs)EMA Bollinger Bands with Signals When Price Exits Either Top or Bottom Bollinger Bands (Marked with either Red or Blue Triangles) (EMA BBs)
EMA BBs work even better for day trading and scalping!
These are Multi Bands,
P.S. Sorry Chart Pictured is a mess Ichimoku Cloud is Turned On
This indicator is Bollinger Bands Only w/ Signals of price exiting of bands

BB and Keltner SqueezeStrategy using the Bollinger band with the Keltner Channels . Watch for the Bollinger bands (blue/red lines) squeezing inside the Keltner Channels (pink dots) for a breakout - this could be up or down so use in conjunction with other indicators.
The blue band is the 2 standard deviation from price, the red is 3 standard deviations. With these, typically if the price bounces off the red then it will retrace a little, (although if there is a massive breakout/down this may not hold). When the bands narrow this is an indicator of consolidation, therefore with a likely upcoming breakup or down.
The pink dots are the Keltner Channels. The strategy says if the bollinger bands come inside the Keltner Channels then this is a strong indicator that the breakout is coming. Sometimes the length of time the squeeze occurs for is indicative of the length/strength of the breakout.
These indicators can be used on all timeframes but higher timeframes will be stronger and more reliable of a trend change.

BB and KeltnerStrategy using the Bollinger band with the Keltner Channels. Watch for the Bollinger bands (blue/red lines) squeezing inside the Keltner Channels (pink dots) for a breakout - this could be up or down so use in conjunction with other indicators.
DepthHouse - ATR BandsDepthHouse ATR Bands works very similar to the well-known Bollinger Bands.
However, these bands are calculated slightly different.
Instead of using the standard deviation formula, ATR Bands determines the size of the bands based on the average range.
How to use:
The bands tighten while the markets’ range becomes lower, and widens as its' range becomes broader. Giving the indicator a loaded spring effect.
A break outside of the bands in either direction usually indicates a breakout.
All 3 bands serve as possible support and/or resistance. Meaning breaks back into the bands could indicate a reversal, or end of the breakout.
This indicator is completely customizable, so compiling multiple sized bands on top of each other may create a strong competitive edge.
This indicator is free until January,1st 2018 – see how to get below
--
DepthHouse's ATR Bands is 1 of 3 indicators that will be available for purchase via subscription come Jan 2018.
This indicator package will come with the following 3 indicators:
:: MaxADX ::
::Premium oscillator to help spot forming trends and reversals.
:: MaxADX Signals ::
::Taking MaxADX a step farther by creating an overlay that show possible trend strengthening and reversals via bar colors and shapes.
:: ATRBands ::
::Like Bollinger Bands , this indicator is uses to help spot breakouts, and overbought/sold areas.
--
How to get:
To qualify for the trial period which ends January, 1st 2018, please go to the link on my profile and click subscribe!
You will then be sent directions for your account to be added to the whitelist.
If you have already subscribed to one of my previous indicators, you will be added to the list shortly
Likes and comments are so very much appreciated!

Moving Average Cross and/or Bbands botHello TradingView and world!
This is one of our latest concepts for an actual bot builder. This script comes with a bunch of features that we're hoping will alleviate a lot of the stress and confusion around using and building strategies here on TV. Especially if the end-goal is to automate the strategies using Autoview.
This is a combination of 2 strategies, and gives you full control of each component within the script.
The 2 strategies are:
2 Moving Averages == if close is greater than moving average and moving average 1 is greater than moving average 2
Bolling Bands == if close is less than lower or greater than upper
Features / Settings included :
- Ability to change settings from a commodity market (default) to an altcoin or forex market.
- Backtest time period selector component
- Heiken Ashi Candles on/off
- Moving Average Strategy on/off
- Bollinger Bands Strategy on/off
- Both Moving Average settings can be adjusted
- Bollinger Bands length and multiplier can be adjusted.
- Pyramiding Greater Than, Equal To, or Less Than
- Trailing Stop with the ability to set a price in which the Trailing Stop activate
- Take Profit on/off and editable
- Stop Loss on/off and editable
- Margin Call on/off dependent on Leverage which is editable
- If pyramiding is used, the strategy will calculate and display your average on the chart
- Profit and Loss visuals added to the chart
You can watch a video here on how all the settings can be used and work together.
www.youtube.com
You can learn more about Autoview here:
autoview.with.pink
Get your invite and join us in slack here:
slack.with.pink


Double Bollinger Bands StrategyDouble Bollinger Strategy. Price crosses inner BB (with increasing outer BB) long is placed. Long is closed when price closes below outer BB. Reversed for short. The numbers are tuned for NZDUSD 15min chart.
Pbin = percent on inner BB
Pbout = percent on outer BB
There are all kinds of other inputs, trailing stop, limit, etc.
Errors, questions, suggestions are wanted, thank you

Bands Vision-XBands Vision-X (BB-Vision-X) – Full Description
Description:
Bands Vision-X is an indicator based on dynamic bands constructed from customizable moving averages and standard deviation, allowing you to visualize potential support and resistance zones, volatility, and market conditions. It uses an adjustable moving average (with multiple options such as SMA, EMA, WMA, JMA, LSMA, DEMA, and TEMA) to define the central line, and upper and lower bands calculated by standard deviation multiplied by an adjustable factor. The bands are smoothed by a Hull Moving Average (HMA) to reduce noise and improve clarity.
How to Use
The bands indicate potential support and resistance levels.
The central line serves as a dynamic price reference.
The distance between bands reflects market volatility.
Touches or breakouts of the bands may signal entry or exit opportunities.
Parameters
Parameter Description Default
Standard Error Band Period Period for moving average and standard deviation 20
Moving Average Type Type of moving average (SMA, EMA, etc.) SMA
Standard Deviation Multiplier Multiplier for standard deviation 2.0
Band Lines Smoothing Period Period for smoothing the bands (HMA) 5
Technical Notes
The JMA function used is not the original Jurik version but an approximate and open implementation based on publicly available TradingView community code.
Developed in Pine Script v6 with optimized and clean code.
Recommendations
Ideal for traders seeking a clear view of volatility and dynamic support/resistance levels.
Should not be used in isolation; it is recommended to combine with volume analysis, price action, or other technical indicators.
Adjust the period and multiplier according to the asset and timeframe for better effectiveness.

Bollinger Bands - Multi Symbol Alert (Miu)This script extends the classic Bollinger Bands indicator with support for up to 8 user-defined symbols and a unique alert system.
Unlike traditional Bollinger Band indicators, it allows traders to configure alerts across multiple assets without keeping the indicator visible on the chart, making it ideal for passive multi-asset monitoring.
What it does:
This script calculates Bollinger Bands using a 100-period simple moving average and a standard deviation multiplier of 3 (or any input you set in the settings panel).
For each selected symbol, the upper and lower bands are retrieved using request.security() and monitored for breakouts.
Alerts are triggered when the closing price of the selected symbol breaks above the upper band (Overbought) or below the lower band (Oversold) — at the bar close.
How to use it:
1) Add the indicator to your chart.
2) Open the settings panel.
3) Select up to 8 symbols to monitor.
4) After setting parameters, click the three dots next to the indicator title and choose "Add Alert on...".
5) Name your alert and confirm.
6) If you don’t wish to keep the indicator visible, you can remove it from the chart — alerts will still function as expected.
Alert message includes:
- Symbol name (e.g., BTC, ETH, LTC)
- (OB) for overbought or (OS) for oversold
- Symbol’s price at the alert moment
Technical note:
This script uses request.security() to fetch Bollinger Band levels and closing prices from up to 8 selected symbols in real time.
Feel free to leave your feedback or suggestions in the comments section below.
Enjoy!
WMB Oscillator | [DeV]The "WMB Oscillator" indicator is a multi-factor momentum and volatility indicator designed to give traders a dynamic edge in identifying trend strength, market pressure, and potential turning points. By combining three powerful tools—Williams %R, Money Flow Index, and Bollinger Band Width—this oscillator presents a single histogram that visually represents the interplay between overbought/oversold levels, volume-weighted pressure, and volatility expansion. Use it to anticipate trend shifts, confirm entries, or avoid traps in ranging markets.
Williams %R:
Williams %R measures the closing price's position relative to the recent high-low range over a defined period. It outputs a value between 0 and -100, where values closer to -100 suggest oversold conditions, and those near 0 indicate overbought. In this oscillator, the raw %R is normalized between your defined overbought and oversold thresholds, allowing it to integrate seamlessly into the combined signal without distortion from price scale differences.
Money Flow Index (MFI):
The MFI gauges buying and selling pressure using both price and volume. It calculates the typical price for each bar, multiplies it by volume, and compares positive versus negative money flows over time. Normalized between your custom thresholds, the MFI component helps highlight when a move is driven by real conviction (volume) rather than weak price fluctuation, enhancing the signal’s reliability.
Bollinger Band Width (BB Width):
BB Width quantifies volatility by measuring the percentage difference between the upper and lower Bollinger Bands relative to their moving average. When volatility contracts, BB Width narrows—often preceding explosive moves. When it expands, volatility is peaking. Here, the raw BB Width is detrended using its moving average and scaled with a user-defined multiplier to reflect its deviation strength.
Why Combine These:
Each of these three metrics captures a unique dimension of market behavior: %R tracks momentum in price extremes, MFI confirms the move’s strength through volume, and BB Width anticipates volatility surges. Combined, they form a balanced oscillator that reacts fluidly to market changes while filtering out noise. The result is a nuanced, multi-angle view of the market's internal dynamics, enabling smarter, more confident trading decisions.
