Custom Session ORB - Extending Past Current CandleCustom Session ORB - Extending Past Current Candle
This indicator plots Opening Range Breakout (ORB) levels for one or two customizable trading sessions directly on your chart. It dynamically tracks the high, low, and midpoint of the defined session(s) and extends these levels beyond the session using a configurable offset.
Features:
Supports two custom sessions.
New York and Asia pre-saved.
Automatically tracks session High, Low, and Mid.
Option to extend ORB levels past the live candle.
Option to display only the most recent ORB for a clean chart.
Configurable line thickness, style, and label size.
Works in Eastern Standard Time (EST) without manual adjustment.
Settings:
Show Labels: Toggle to display ORB values on chart.
Label Font Size: Small, Normal, Large.
Mid Line Style: Solid, Dashed, or Dotted.
ORB Line Thickness: Set line thickness of ORB levels.
Extend Past Current Candle by N Bars: Controls how far the ORB extends visually.
Show Only Current ORB: Cleans chart by removing previous session ORB levels.
Enable Session 1 / 2: Toggle individual sessions on/off.
Session Time: Set the start and end times for each session (automatically in EST).
How It Works:
The indicator monitors the defined session time, records the high, low, and midpoint, and draws lines at those levels. When the session ends, the lines are extended by the specified offset for easy breakout visualization. Labels can optionally show the exact price levels.
在腳本中搜尋"break"

High Volume Breakout DetectorThis indicator is a dedicated volume analysis tool displayed in a separate pane below the price chart. It visually highlights significant volume surges (spikes) by comparing the current bar's volume to a dynamic threshold based on a Simple Moving Average (SMA) of volume.
Key Concepts and Methodology:
- The core calculation uses a user-configurable Simple Moving Average (default: 20 periods) of historical volume to establish a baseline of "normal" trading activity.
- A customizable multiplier (default: 1.50, meaning 150% of the SMA) defines the threshold for a volume spike. When the current bar's volume meets or exceeds this threshold, it is classified as a spike—indicating unusually high participation that often accompanies breakouts, reversals, climaxes, or institutional activity.
- Volume bars are plotted as columns and colored based on two factors:
- Candle direction: Green shades for bullish candles (close ≥ open), red shades for bearish candles (close < open).
- Spike status: Brighter/solid colors for confirmed spikes, muted/translucent colors for normal volume. This candle-matched coloring helps traders quickly assess whether the surge supports buying pressure (green spike on up candle) or selling/distribution (red spike on down candle).
- Optional overlays include the volume SMA line (blue) and the dynamic threshold line (orange, plotted as circles for easy distinction).
Features and Customization:
- Fully adjustable inputs: SMA length, multiplier threshold, colors for up/down/normal/spike bars, and toggles for showing the SMA line, threshold line, or background highlighting on spikes.
- Built-in alert condition triggers reliably on volume spikes (≥ selected multiplier of SMA), with a constant message string including ticker, timeframe, volume value, and threshold reference.
How to Use:
- Add to any chart in a separate pane (overlay=false).
- Look for brighter colored volume bars as potential signals of conviction in price moves. For example:
- Green spikes on up candles may signal strong accumulation or breakout confirmation.
- Red spikes on down candles may indicate distribution or exhaustion selling.
- Combine with price action, support/resistance, or trend indicators for confluence.
- Ideal for day trading, swing trading, or spotting volume climaxes on stocks, forex, crypto, or futures across any timeframe.
The unique combination of candle-direction-matched coloring for spikes, visual threshold plotting, and focused spike highlighting provides clearer, more actionable insight into directional volume pressure compared to standard volume displays.

Zee's A+ MOMO BreakThis just shows an indicator when you have a 5 minute momentum candle that breaks PMH under specific parameters, i.e candle size, wick size, relative volume, time of day, etc. It will plot the PMH with a gold line automatically. Entry would be at the close of the MOMO break. I highly encourage you to back test your results and see how strong this setup is. Any questions feel free to comment or reach out, thanks.

True vs False Breakout (Vol + Body Shape) **Indicator Description: True vs. False Breakout Detector**
This indicator helps identify the quality of a breakout by analyzing price action and volume.
**★ Green Arrow: "True Breakout (Strong Candle)"**
This represents a high-confidence breakout signal.
* **Criteria:** Price Breakout + Volume Surge + Strong Candle Close (minimal to no upper wick).
* **Significance:** Indicates strong bullish momentum.
**● Grey Dot: "Weak Breakout"**
Appears when price breaks resistance but shows signs of weakness.
* **Criteria:** Breakout with low volume OR a long upper wick (rejection).
* **Meaning:** "Price made a new high, but the move is untrustworthy."
* **Action:** Do not chase the long position. Be cautious and look for potential reversals.
**▼ Red Label: "False Breakout (Reversal)"**
* **Signal:** Appears when a Weak Breakout (Grey Dot) is followed by bearish price action.
* **Action:** This indicates a confirmed False Breakout and presents a prime shorting opportunity.
-------------------------------------------------------------------------------------------
★指标描述:真假突破辨别。
★绿色箭头 "真突破 (强K线)":
这是你要的完美信号。
它意味着:价格破位 + 成交量放大 + K线收盘坚决(几乎没有上影线)。
对应刚才的行情: 刚才那根1H大阳线应该会触发这个信号。
灰色圆点 "弱势突破" (新增):
如果价格突破了阻力,但是没量,或者留了长上影线(像你之前描述的那几根15分钟线),指标会标记灰色圆点。
含义: “虽然价格破了新高,但我不信任它”。这时候千万不要追多,反而要准备做空。
红色标签 "假突破 (反转)":
当灰色圆点(弱势突破)出现后,紧接着出现红色标签,就是绝佳的做空点。

Open Range BreakoutOpen Range Breakout (ORB)
The Open Range Breakout (ORB) is a classic intraday strategy used across stocks, indices, FX and futures. It focuses on how price behaves during the first minutes of a major session, when liquidity and volatility are highest.
This indicator fully automates the ORB process with session detection, box drawing, breakout & retest logic, and final Buy/Sell signals.
Multi-Session Support
Choose between the three most important global opens:
Asia (Tokyo) – JPY pairs, Asian indices, gold, crypto
London – FX majors, European indices, strong volatility
New York – US indices, USD pairs, gold, oil, highest volume
The Opening Range is calculated only during the selected session.
ORB Range (5 / 15 / 30 min)
The indicator builds the ORB High/Low from the first X minutes of the session, draws the box, and waits for price action once the range is complete.
How It Works
ORB Window → High/Low of the opening minutes are recorded.
Breakout → Price closes above/below the ORB → “BREAKOUT” label.
Retest → Price returns to the ORB box → “RETEST” label.
Confirmation Levels Freeze → Upper/lower structure set.
Final Signal
Close above frozen upper level → BUY
Close below frozen lower level → SELL
This filters out false breakouts and provides structured continuation signals.
Alerts
Includes built-in alert conditions for:
ORB BUY Signal
ORB SELL Signal
Alerts trigger exactly when the Buy or Sell label appears.
Works On
Stocks & indices
Forex
Futures

SMC N-Gram Probability Matrix [PhenLabs]📊 SMC N-Gram Probability Matrix
Version: PineScript™ v6
📌 Description
The SMC N-Gram Probability Matrix applies computational linguistics methodology to Smart Money Concepts trading. By treating SMC patterns as a discrete “alphabet” and analyzing their sequential relationships through N-gram modeling, this indicator calculates the statistical probability of which pattern will appear next based on historical transitions.
Traditional SMC analysis is reactive—traders identify patterns after they form and then anticipate the next move. This indicator inverts that approach by building a transition probability matrix from up to 5,000 bars of pattern history, enabling traders to see which SMC formations most frequently follow their current market sequence.
The indicator detects and classifies 11 distinct SMC patterns including Fair Value Gaps, Order Blocks, Liquidity Sweeps, Break of Structure, and Change of Character in both bullish and bearish variants, then tracks how these patterns transition from one to another over time.
🚀 Points of Innovation
First indicator to apply N-gram sequence modeling from computational linguistics to SMC pattern analysis
Dynamic transition matrix rebuilds every 50 bars for adaptive probability calculations
Supports bigram (2), trigram (3), and quadgram (4) sequence lengths for varying analysis depth
Priority-based pattern classification ensures higher-significance patterns (CHoCH, BOS) take precedence
Configurable minimum occurrence threshold filters out statistically insignificant predictions
Real-time probability visualization with graphical confidence bars
🔧 Core Components
Pattern Alphabet System: 11 discrete SMC patterns encoded as integers for efficient matrix indexing and transition tracking
Swing Point Detection: Uses ta.pivothigh/pivotlow with configurable sensitivity for non-repainting structure identification
Transition Count Matrix: Flattened array storing occurrence counts for all possible pattern sequence transitions
Context Encoder: Converts N-gram pattern sequences into unique integer IDs for matrix lookup
Probability Calculator: Transforms raw transition counts into percentage probabilities for each possible next pattern
🔥 Key Features
Multi-Pattern SMC Detection: Simultaneously identifies FVGs, Order Blocks, Liquidity Sweeps, BOS, and CHoCH formations
Adjustable N-Gram Length: Choose between 2-4 pattern sequences to balance specificity against sample size
Flexible Lookback Range: Analyze anywhere from 100 to 5,000 historical bars for matrix construction
Pattern Toggle Controls: Enable or disable individual SMC pattern types to customize analysis focus
Probability Threshold Filtering: Set minimum occurrence requirements to ensure prediction reliability
Alert Integration: Built-in alert conditions trigger when high-probability predictions emerge
🎨 Visualization
Probability Table: Displays current pattern, recent sequence, sample count, and top N predicted patterns with percentage probabilities
Graphical Probability Bars: Visual bar representation (█░) showing relative probability strength at a glance
Chart Pattern Markers: Color-coded labels placed directly on price bars identifying detected SMC formations
Pattern Short Codes: Compact notation (F+, F-, O+, O-, L↑, L↓, B+, B-, C+, C-) for quick pattern identification
Customizable Table Position: Place probability display in any corner of your chart
📖 Usage Guidelines
N-Gram Configuration
N-Gram Length: Default 2, Range 2-4. Lower values provide more samples but less specificity. Higher values capture complex sequences but require more historical data.
Matrix Lookback Bars: Default 500, Range 100-5000. More bars increase statistical significance but may include outdated market behavior.
Min Occurrences for Prediction: Default 2, Range 1-10. Higher values filter noise but may reduce prediction availability.
SMC Detection Settings
Swing Detection Length: Default 5, Range 2-20. Controls pivot sensitivity for structure analysis.
FVG Minimum Size: Default 0.1%, Range 0.01-2.0%. Filters insignificant gaps.
Order Block Lookback: Default 10, Range 3-30. Bars to search for OB formations.
Liquidity Sweep Threshold: Default 0.3%, Range 0.05-1.0%. Minimum wick extension beyond swing points.
Display Settings
Show Probability Table: Toggle the probability matrix display on/off.
Show Top N Probabilities: Default 5, Range 3-10. Number of predicted patterns to display.
Show SMC Markers: Toggle on-chart pattern labels.
✅ Best Use Cases
Anticipating continuation or reversal patterns after liquidity sweeps
Identifying high-probability BOS/CHoCH sequences for trend trading
Filtering FVG and Order Block signals based on historical follow-through rates
Building confluence by comparing predicted patterns with other technical analysis
Studying how SMC patterns typically sequence on specific instruments or timeframes
⚠️ Limitations
Predictions are based solely on historical pattern frequency and do not account for fundamental factors
Low sample counts produce unreliable probabilities—always check the Samples display
Market regime changes can invalidate historical transition patterns
The indicator requires sufficient historical data to build meaningful probability matrices
Pattern detection uses standardized parameters that may not capture all institutional activity
💡 What Makes This Unique
Linguistic Modeling Applied to Markets: Treats SMC patterns like words in a language, analyzing how they “flow” together
Quantified Pattern Relationships: Transforms subjective SMC analysis into objective probability percentages
Adaptive Learning: Matrix rebuilds periodically to incorporate recent pattern behavior
Comprehensive SMC Coverage: Tracks all major Smart Money Concepts in a unified probability framework
🔬 How It Works
1. Pattern Detection Phase
Each bar is analyzed for SMC formations using configurable detection parameters
A priority hierarchy assigns the most significant pattern when multiple detections occur
2. Sequence Encoding Phase
Detected patterns are stored in a rolling history buffer of recent classifications
The current N-gram context is encoded into a unique integer identifier
3. Matrix Construction Phase
Historical pattern sequences are iterated to count transition occurrences
Each context-to-next-pattern transition increments the appropriate matrix cell
4. Probability Calculation Phase
Current context ID retrieves corresponding transition counts from the matrix
Raw counts are converted to percentages based on total context occurrences
5. Visualization Phase
Probabilities are sorted and the top N predictions are displayed in the table
Chart markers identify the current detected pattern for visual reference
💡 Note:
This indicator performs best when used as a confluence tool alongside traditional SMC analysis. The probability predictions highlight statistically common pattern sequences but should not be used as standalone trading signals. Always verify predictions against price action context, higher timeframe structure, and your overall trading plan. Monitor the sample count to ensure predictions are based on adequate historical data.

VCP Trendline breakoutThe Signal:
Green Triangles indicate the price is approaching the trendline (Watchlist candidate).
Yellow Triangles indicate the price is very tight against the line (Execution imminent).
The Trigger: When price closes above the Grey Dotted Line, the line stops extending. This is your breakout signal.
Indicator Overview
The The VCP Trendline breakout indicator is a sophisticated technical indicator designed for trend followers and breakout traders (O'Neil, Minervini, Wyckoff styles). This script employs a State Machine logic to identify structural Volatility Contraction Patterns (VCP) in real-time.
It automatically detects valid Bases, tracks the "Right Side" construction, identifies nested handles (contractions), and draws precise supply trendlines—while strictly enforcing structural integrity rules (Higher Lows).
Core Logic & Features
1. Smart Base Detection
Trend Filter: The pattern recognition engine only activates when the price is above the 200 SMA, ensuring you are trading with the primary trend.
Base Validation: It identifies a "Base High" (H1) based on a configurable lookback period. It tracks the depth of the base and automatically invalidates the pattern if the drawdown exceeds the user-defined threshold (default 30%).
2. Recursive Nested Trendlines (VCP)
The indicator is capable of drawing Nested Trendlines (recursive resistance). It doesn't just draw a line from the peak; it identifies internal contractions within the base.
H1 (Primary): The main supply line from the top of the base.
H2, H3 (Internal): Trendlines connecting subsequent lower highs (handles) as volatility contracts.
Smart Fan: Includes a "Clean Fan" mode to show only the most relevant, latest trendline per anchor point.
3. Structural Integrity Enforcement (The "Higher Low" Rule)
This is the standout feature of this script. It performs an Anchor Integrity Check on every bar.
In a valid VCP, every contraction must form a Higher Low.
If the price creates a new pivot (H3) but then crashes lower than the previous contraction's floor (H2), the script identifies this as a Structural Failure.
Auto-Deletion: It immediately retroactively deletes the invalid trendlines associated with that failed contraction, keeping your chart clean and free of "ghost" signals.
4. "Right-Side" Logic
Collision Detection: Trendlines are calculated using "Right-Side Clearance." A line is only drawn if the path from the anchor to the new pivot is unobstructed by price action.
Signal Protection: "Watch" and "Near" signals are suppressed during the decline phase (Left Side). They only appear once the "Bottom" (L1) has been confirmed and price is recovering on the Right Side.
5. Proximity Alerts & Breakouts
Watch Zone (Green Triangle): Appears when the Low of the bar is within 8% (configurable) of a valid trendline.
Near Zone (Yellow Triangle): Appears when the Low of the bar is within 4% (configurable) of a valid trendline.
Breakout Stop: Trendlines are dynamic. The moment a bar closes above a trendline, the line stops extending immediately, marking the exact breakout point.
How to Use This Indicator
The Setup: Look for a stock in an uptrend (Price > 200 SMA).
The Construction: Wait for the script to identify the Base High (H1). As the price corrects and begins to recover, you will see Grey Dotted Lines appear, connecting the highs.
The Contraction: Watch for Nested Trendlines. If you see a second or third line form from a lower high (H2, H3), it indicates a tightening of price action (VCP).
Settings Configuration
Moving Averages
21 EMA, 50 SMA, 200 SMA: Built-in reference averages.
Base Settings
H1 Lookback: How many bars back the script looks to find the "Start" of the base (Default: 21). Increase this for longer-term bases.
Sub-High Pivot Bars: Controls the sensitivity of identifying internal highs (handles).
Max Base Depth: If the base drops more than this % (Default: 30%), the structure is considered failed and lines are removed.
Enable Nested Trendlines: Toggle ON to see internal VCP lines (H2, H3). Toggle OFF to see only the main H1 trendline.
Show Only Latest Line: Keeps the chart clean by removing older lines from the same anchor point.
Visuals & Signals
Near/Watch Zone %: Adjust the sensitivity of the Green/Yellow triangles.
Signal Size: Change the size of the triangle markers.
DISCLAIMER
This is an indicator, not a trading system. Apply good risk management and do your own due diligence before putting your hard earned money into anything.
This script is for educational and analytical purposes only. It does not constitute financial advice. Automated pattern recognition has limitations and should always be verified visually.

Weekly False Breakdown ScannerWeekly False Breakdown Scanner Weekly False Breakdown ScannerWeekly False Breakdown ScannerWeekly False Breakdown ScannerWeekly False Breakdown ScannerWeekly False Breakdown ScannerWeekly False Breakdown ScannerWeekly False Breakdown ScannerWeekly False Breakdown ScannerWeekly False Breakdown ScannerWeekly False Breakdown ScannerWeekly False Breakdown ScannerWeekly False Breakdown ScannerWeekly False Breakdown ScannerWeekly False Breakdown ScannerWeekly False Breakdown ScannerWeekly False Breakdown ScannerWeekly False Breakdown ScannerWeekly False Breakdown ScannerWeekly False Breakdown ScannerWeekly False Breakdown ScannerWeekly False Breakdown ScannerWeekly False Breakdown ScannerWeekly False Breakdown ScannerWeekly False Breakdown ScannerWeekly False Breakdown ScannerWeekly False Breakdown ScannerWeekly False Breakdown ScannerWeekly False Breakdown ScannerWeekly False Breakdown ScannerWeekly False Breakdown ScannerWeekly False Breakdown ScannerWeekly False Breakdown ScannerWeekly False Breakdown ScannerWeekly False Breakdown ScannerWeekly False Breakdown ScannerWeekly False Breakdown ScannerWeekly False Breakdown ScannerWeekly False Breakdown ScannerWeekly False Breakdown ScannerWeekly False Breakdown ScannerWeekly False Breakdown ScannerWeekly False Breakdown ScannerWeekly False Breakdown ScannerWeekly False Breakdown Scanner

ADX Breakout Enhanced Signal🥋 Trading Dojo – ADX Breakout Enhanced Signal
This indicator combines the trend-strength power of the ADX with dynamic breakout-based signals, designed for traders who want more frequent and higher-probability entries on timeframes like 1 hour.
The core logic focuses on:
📌 1. Trend Strength Detection with ADX
The indicator evaluates whether the market is showing a strong directional trend using an optimized ADX.
When ADX rises above the configured threshold, the system interprets that price has enough momentum to validate an entry.
📌 2. Breakout Entry Logic
It identifies points where price breaks recent highs or lows, confirming the start or continuation of movement.
This breakout-based approach produces more entries than traditional ADX strategies alone.
📌 3. Clear and Simple Signals
🟩 Long when price breaks a recent high with strong trend confirmation.
🟥 Short when price breaks a recent low with strong trend confirmation.
📌 4. Built-In Automated Alerts
The indicator automatically generates JSON alerts ready for use with automation tools such as trading bots, webhooks, BingX, 3Commas, Discord bots, and more.
🎯 Purpose of the Indicator
To provide more frequent, well-distributed, and momentum-validated entries, while maintaining simplicity and speed — perfect for real-time decision-making.
Perfect For:
Intraday trading
1h, 30m, and 15m timeframes
Breakout-based strategies
Automated trading systems

Bassi's Pattern Breakout IndicatorBASSI'S PATTERN BREAKOUT INDICATOR
Author: Bassi | Published 2025
One of the cleanest and most accurate classic pattern detectors on TradingView – proudly coded and shared by Bassi.
Detects & confirms breakouts from:
• Double Top / Double Bottom
• Triple Top / Triple Bottom
• Head & Shoulders
• Inverse Head & Shoulders
Key Features:
• 100% non-repainting – signals only appear after candle close
• Smart breakout confirmation using the correct neckline level
• Visual pattern drawing (tops/bottoms + necklines)
• Clear breakout labels with vertical confirmation lines
• Real-time TradingView alerts (one alert per bar close)
• All alerts include "Bassi" prefix so you know it's the original
• Dynamic coloring for Double Bottom (red in lower areas, green in higher areas)
• No messy BUY/SELL labels – clean professional look (as requested by the community)
Why traders love it:
- Extremely reliable on all timeframes (1m to monthly)
- Works perfectly on Forex, Stocks, Crypto, Indices
- No false signals during consolidation
- Perfect for swing trading, scalping and position trading
Settings:
• Pivot Left/Right Bars – adjust sensitivity
• Price Tolerance % – how flat the tops/bottoms must be
• Max Pivot Storage – memory management
• Enable/disable alerts and visual markers
How to use:
1. Add to chart
2. Create alert → select "Bassi's Pattern Breakout Indicator"
3. Choose "Once per bar close"
4. Get notified instantly on every confirmed breakout!
This is the original and only authorized version by Bassi.
If you enjoy this indicator, please leave a like and follow for future updates!
© Bassi 2025 – All rights reserved
#pattern #breakout #doubletop #doublebottom #headandshoulders #tradingview #bassi

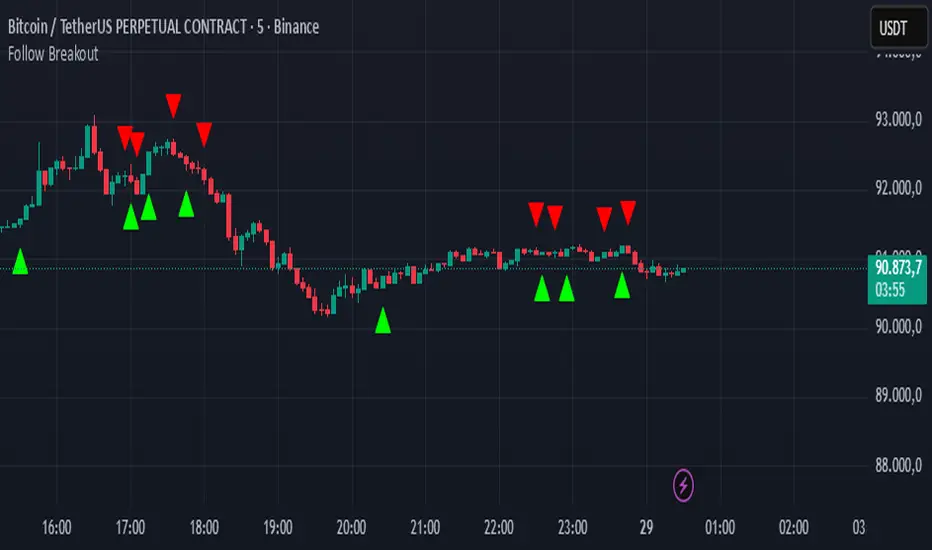
Follow BreakoutThe indicator tracks trend breakouts. It generates multiple signals during sideways trends.
NIFTY Options Breakout StrategyThis strategy trades NIFTY 50 Options (CALL & PUT) using 5-minute breakout logic, strict trend filters, expiry-based symbol validation, and a dynamic trailing-profit engine.
1️⃣ Entry Logic
Only trades NIFTY 50 options, filtered automatically by symbol.
Trades only between 10:00 AM – 2:15 PM (5m bars).
Breakout trigger:
Price enters the buy breakout zone (high of last boxLookback bars ± buffer).
Trend filter:
Price must be above EMA50 or EMA200,
AND EMA50 ≥ EMA100 (to avoid weak conditions).
Optional strengthening:
EMA20>EMA50 OR EMA50>EMA100 recent cross can be enforced.
Higher-timeframe trend check:
EMA50 > EMA200 (bullish regime only).
Start trading options only after expiry–2 months (auto-parsed).
2️⃣ One Trade Per Day
Maximum 1 long trade per day.
No shorting (long-only strategy).
3️⃣ Risk Management — SL, TP & Trailing
Includes three types of exits:
🔹 A) Hard SL/TP
Hard Stop-Loss: -15%
Hard Take-Profit: +40%
🔹 B) Step-Ladder Trailing Profit
As the option price rises, trailing activates:
Max Profit Reached Exit Trigger When Falls To
≥ 35% ≤ 30%
≥ 30% ≤ 25%
≥ 25% ≤ 20%
≥ 20% ≤ 15%
≥ 15% ≤ 10%
≥ 5% ≤ 0%
🔹 C) Loss-Recovery Exit
If loss reaches –10% but then recovers to 0%, exit at breakeven.
4️⃣ Trend-Reversal Exit
If price closes below 5m EMA50, the long is exited instantly.
5️⃣ Optional Intraday Exit
EOD square-off at 3:15 PM.
6️⃣ Alerts for Automation
The strategy provides alerts for:
BUY entry
TP/SL/Trailing exit
EMA50 reversal exit
EOD exit

ORB 15min: Break & ConfirmUsing the 15-minute opening candle range, this generates an alert when a 5-minute candle breaks the range and another 5-minute candle closes above the breakout candle's high or the high of any other candle that attempted to break the range.

Micha Stokes Buyers Breakout Alert v2Buyer Breakout Rules (Word Definition)
The alert is triggered when ALL conditions in Section 1 and Section 3 are met, AND one of the two Scenarios in Section 2 is met.
1. The Setup and Breakout (The Initial Requirement)
Price Action: The closing price of the current candle must break above the highest resistance level established during the recent period of flat trading (the setup).
2. The Confirmation (Scenario A OR Scenario B)
The breakout must be accompanied by evidence of buying strength:
Scenario A: High-Conviction Breakout (Immediate Demand)
The current candle is GREEN (it closed higher than it opened).
AND the volume is HIGHER than the volume of the previous candle.
Scenario B: Seller-Exhaustion Breakout (Micha Stokes' Unique Signal)
The current candle is GREEN (it closed higher than it opened).
AND the volume is LOWER than the volume of the previous candle. (This means the price rose without much seller resistance.)
3. The Strength Filter (Conviction Check)
The candle must close near its high, showing that buyers maintained control and didn't face significant selling pressure immediately after the breakout.

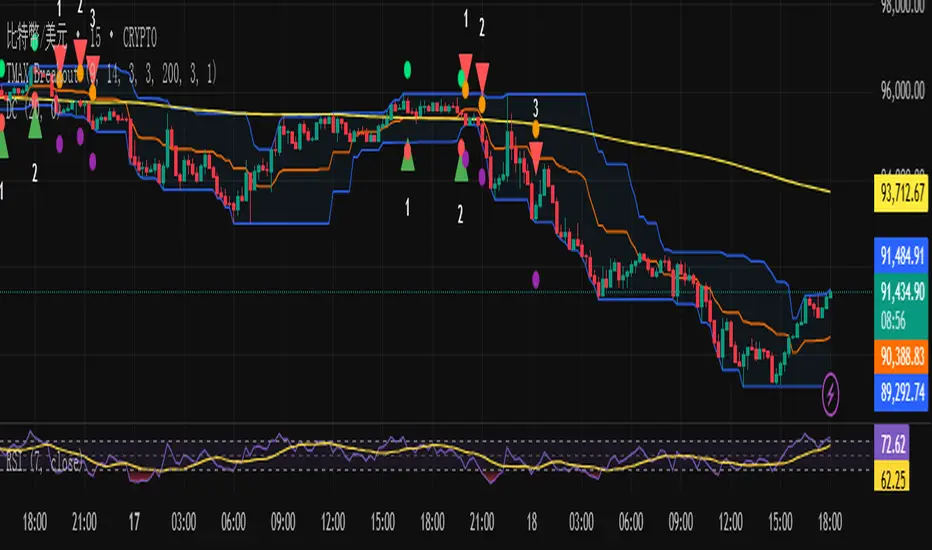
TMAX Breakout – by EricFreemanTMAX Breakout is a trend-following breakout indicator inspired by the classic Turtle Trading System, designed by EricFreeman.
It identifies Donchian Channel breakouts with an MA trend filter to help traders capture strong directional moves while reducing false breakout signals.
Ideal for:
Trend-following traders
Visual breakout confirmation
Manual trading or automated strategy development
More indicators in the TMAX series—RSI Divergence, Bollinger strategies, MA Cross, and more—will be released soon to form a complete professional trading toolkit.
TMAX Breakout 是一款基於海龜交易法(Turtle System)延伸打造的趨勢突破指標,由 EricFreeman 設計。
透過 Donchian Channel 突破判斷結合 MA 趨勢過濾,幫助交易者在關鍵價格突破時進場,並避免弱勢走勢造成假突破。
此指標適合:
喜歡順勢交易的人
想要視覺化突破訊號的交易者
搭配 EA、自動化策略、或手動交易判斷
TMAX 系列將陸續推出更多指標:RSI 背離、布林通道策略、均線交叉等,打造完整專業交易套件。
Turtle 20-Day Breakout (Donchian)Yes, the most important indicator used in the Turtle Rules (Turtle Trading Strategy) for finding breakouts above previous highs is the Donchian Channel. 🐢📈
Donchian Channel
The Donchian Channel is a trend-following indicator composed of three lines plotted on the chart:
Shutterstock
Upper Band: The highest high over the defined number of periods.
Lower Band: The lowest low over the defined number of periods.
Middle Line: The average of the Upper and Lower bands (not always used, but sometimes added for orientation).
The Turtle Rules use the following periods for the entry signals (breakouts) you mentioned in your query:
Short-Term (System 1): Crossing the 20-day high (this corresponds to the upper band of a Donchian Channel with a 20-period setting).
Mid-Term/Long-Term (System 2): Crossing the 55-day high (this corresponds to the upper band of a Donchian Channel with a 55-period setting).
Crossing the upper band signals a breakout and serves as the buy signal for a long position (for short positions, crossing below the lower band is used).
Is there anything else I can translate for you, or would you like me to elaborate on the Average True Range (ATR), the other key indicator used by the Turtles?

Lorentzian Length Adaptive Moving Average [LLAMA] Adaptation of "Machine Learning: Lorentzian Classification" by
Gradient color by base on work by
LLAMA: A regime-aware adaptive moving average that bends with the market.
Start with a problem traders know:
Traditional moving averages are either too slow (EMA200) or too fast (EMA9)
Adaptive MAs exist, but they often hug price too tightly or smooth too much, failing to balance bias and tactics
LLAMA uses a Lorentzian distance function to adapt its length dynamically. Instead of a fixed smoothing window, it stretches or contracts depending on market conditions. This distortion reduces lag while still providing a clear bias line.
The indicator looks back at recent bars and measures how similar they are using a Lorentzian distance (a log‑scaled absolute difference). It keeps track of the “nearest neighbors” — bars that most resemble the current regime. Each neighbor carries a label (long, short, neutral) based on simple price comparisons. By averaging these labels, LLAMA predicts whether the market is leaning bullish or bearish. That prediction is then mapped into a dynamic length between and .
Bullish bias -> length stretches toward max (smoother, more stable).
Bearish bias -> length contracts toward min (snappier, more reactive).
During breakouts, LLAMA tightens and comes into contact with bars, giving actionable signals. During chop, it stretches to avoid false triggers. It covers both ends of the spectrum (bias and tactics) in one line, something static MA's can't do.
Think of LLAMA as a lens that bends with the market:
Wide lens (max length) for big picture bias.
Narrow lens (min length) for tactical precision.
The "Lorentzian Loop" is the math that decides when to widen or narrow.

FVG Session Break Strategy with ATR RR🧠 FVG Session Break Strategy with ATR RR — Timezone-Aware, Session-Savvy, and Risk-Calibrated
This strategy captures high-probability reversals and continuations by combining Fair Value Gap (FVG) imbalances with session-based breakout logic and ATR-calibrated risk management. It’s designed for traders who want to exploit structural inefficiencies during key market sessions — with precision and portability across global exchanges.
🔍 Core Logic:
Fair Value Gap Detection: Identifies bullish and bearish FVGs using a 3-bar displacement pattern.
Session Breakout Engine: Tracks session highs and lows (Asian, London, NY) and triggers trades only when price breaks these levels — ensuring trades occur at meaningful inflection points.
ATR-Based RR Control: Dynamically sizes stop-loss and take-profit levels using ATR × multiplier, maintaining consistent risk across volatility regimes.
🌐 Timezone-Aware Session Logic:
Session boundaries are defined in UTC-5 (e.g., NY: 0930–1600) but automatically converted to the exchange’s local timezone using timestamp("Etc/GMT+5", ...). This ensures:
Accurate session detection across all markets and assets
No manual timezone adjustments needed
Robust performance on crypto, forex, and global equities
📈 Visuals:
Session highs and lows plotted in orange
Bullish and bearish FVGs marked with green and red triangles
Strategy entries and exits shown on chart with full RR logic
This strategy is ideal for traders who want to combine structural edge with session context and disciplined risk.

Average Price Calculator / VisualizerDCA Average Price Calculator - Visualize Your Breakeven & TP!
Ever wished you could visualize your trades and instantly see your average entry price right here on TradingView? Especially if you're a DCA (Dollar-Cost Averaging) trader like me, tracking multiple entries can be a hassle. You're constantly switching to a spreadsheet or calculator to figure out your breakeven and take-profit levels. Well I've developed this DCA Average Price Calculator to solve exactly that problem, bringing all your position planning directly onto your chart.
What It Does
This indicator is a interactive tool designed to calculate the weighted average price of up to 10 separate trade entries. It then plots your crucial breakeven (average price) and a customizable take-profit target directly on your chart, giving you a clear visual of your position.
Key Features
Up to 10 Order Entries: Plan complex DCA strategies with support for up to ten individual buys.
Flexible Size Input: Enter your position size in either USD Amount or Number of Shares/Contracts. The script is smart enough to know which one you're using.
Instant Average Price Calculation: Your weighted average price (your breakeven point) is calculated and plotted in real-time as a clean yellow line.
Customizable Take-Profit Target: Set your desired profit percentage and see your take-profit level instantly plotted as a green line.
Detailed On-Chart Labels: Each order you plot is marked with a detailed label showing the entry price, the number of shares purchased, and the total USD value of that entry.
Clean & Uncluttered UI: The main Average and TP labels are intelligently shifted to the right, ensuring they don't overlap with your entry markers, keeping your chart readable.
How to Use It - Simple Steps
Add the indicator to your chart.
Open the script's 'Settings' menu.
In the 'Take Profit' section, set your desired profit percentage (e.g., 1 for 1%).
Under the 'Orders' section, begin filling in your entries. For each 'Order #', enter the Price.
Next, enter the size. You can either fill in the 'Size (USD)' box OR the '/ Shares' box. Leave the one you're not using at 0.
As you add orders, the 'Avg' (yellow) and 'TP' (green) lines, along with the blue order labels, will automatically appear and adjust on your chart!
Who Is This For?
DCA Traders: This is the ultimate tool for you!
Position Traders: Keep track of scaling into a larger position over time.
Manual Backtesters: Quickly simulate and visualize how a series of buys would have played out.
Any Trader who wants a quick and easy way to calculate their average entry without leaving TradingView.
I built this tool to improve my own trading workflow, and I hope it helps you as much as it has helped me. If you find it useful, please consider giving it a 'Like' and feel free to leave any feedback or suggestions in the comments!
Happy trading

Low and Preceding High (Breakout + Bullis fgv + Extending Fib)🚀 Last Low & Preceding High: Bullish Reversal Strategy
This indicator identifies high-probability long setups by confirming a Bullish Market Structure Shift (BMS) coupled with a strong momentum filter.
🧠 Indicator Logic (How It Works)
The core function of this tool is to automatically locate the key structural points that lead to a bullish bias:
Structure Identification: It first defines a Range between the two most recent Pivot Lows. Within this range, it finds the Preceding High (the highest close before the current low) and the true Low Anchor (the lowest low/tail of the pivot low).
Breakout and Momentum Filter: A valid signal requires two conditions to be met on the current bar:
Bullish Breakout: The price must close above the Preceding High.
Marubozu Confirmation: A strong Bullish Marubozu candle (minimal wicks) must be present in the impulse move from the low, filtering for institutional strength.
Fibonacci Discount Zones: Upon confirmation, the indicator calculates and plots the discount zones (0.50, 0.618, 0.786) using the true extremes (tail-to-tail anchors). These zones start extending from the breakout candle and represent high-value areas for potential entries.
🎯 Entry and Risk Management
The strategy provides clear rules for execution once the logic is confirmed:
Entry Execution:
Wait for Retracement: Enter a Long position when the price retraces back into the colored Discount Zones (0.50 to 0.786).
Risk Control:
🛑 Stop Loss (SL): Placed below the Low Line (the swing low that initiated the move).
✅ Take Profit (TP): Placed above the High Line (the high that was broken).
Final note
"Special thanks to Mr. Mazen (@dr0chart) for developing this strategy."

Previous D/W/M HLOCHey traders,
Here's a simple Multi-Timeframe indicator that essentially turns time and price into a box. It'll take the previous high, low, opening price, or closing price from one of the three timeframes of your choice (day, week, or month). For whatever reason I can't get the opening price to function consistently so if you find improvements feel free to let me know, this will help traders who prefer to use opening price over closing price.
Naturally this form of charting is classical and nature and some key figures you could use to study its usage are
- Richard W. Schabacker (1930s)
- Edwards & Magee (1948)
- Peter Brandt
- Stacey Burke (more on the intraday side - typically our preference)
It's usage put plainly:
- Quantifying Accumulation or Distribution
- Revealing Energy Build-Up (Compression)
- Framing Breakouts and False Breakouts
- Structuring Time
- Identifying opportunities to trade a daily, weekly, or monthly range.

IB range + Breakout fibsThe IB High / Low + Auto-Fib indicator automatically plots the Initial Balance range and a Fibonacci projection for each trading day.
Define your IB start and end times (e.g., 09:30–10:30).
The indicator marks the IB High and IB Low from that session and extends them to the session close.
It keeps the last N days visible for context.
When price breaks outside the IB range, it automatically plots a Fibonacci retracement/extension from the opposite IB side to the breakout, using levels 0, 0.236, 0.382, 0.5, 0.618, 0.88, 1.
The Fib updates dynamically as the breakout extends, and labels are neatly aligned on the right side of the chart for clarity.
Ideal for traders who monitor Initial Balance breaks, range expansions, and Fibonacci reaction levels throughout the trading session.

Auto AVWAP (Anchored-VWAP) with Breakout Screener_v2Updated indicator for AWAP breakout. The indicator identified the candle that breaks out of AVWAP
