[ETH] Optimized Trend Strategy - Lorenzo SuperScalpStrategy Title: Optimized Trend Strategy - Lorenzo SuperScalp
Description:
The Optimized Trend Strategy is a comprehensive trading system tailored for Ethereum (ETH) and optimized for the 15-minute timeframe but adaptable to various timeframes. This strategy utilizes a combination of technical indicators—RSI, Bollinger Bands, and MACD—to identify and act on price trends efficiently, providing traders with actionable buy and sell signals based on market conditions.
Key Features:
Multi-Indicator Approach:
RSI (Relative Strength Index): Identifies overbought and oversold conditions to time market entries and exits.
Bollinger Bands: Acts as a dynamic support and resistance level, helping to pinpoint precise entry and exit zones.
MACD (Moving Average Convergence Divergence): Detects momentum changes through bullish and bearish crossovers.
Signal Conditions:
Buy Signal:
RSI is below 45 (indicating an oversold condition).
Price is near or below the lower Bollinger Band.
MACD bullish crossover occurs.
Sell Signal:
RSI is above 55 (indicating an overbought condition).
Price is near or above the upper Bollinger Band.
MACD bearish crossunder occurs.
Trade Execution Logic:
Long Trades: Opened when a buy signal flashes. If there’s an open short position, it is closed before opening a long.
Short Trades: Opened when a sell signal flashes. If there’s an open long position, it is closed before opening a short.
The strategy also ensures a minimum number of bars between consecutive trades to avoid rapid trading in choppy conditions.
Pyramiding Support:
Up to 3 consecutive trades in the same direction are allowed, enabling traders to scale into positions based on strong signals.
Visual Indicators:
RSI Levels: Dotted lines at 45 and 55 for quick reference to oversold and overbought levels.
Buy and Sell Signals: Visual markers on the chart indicate where trades are executed, ensuring clarity on entry and exit points.
Best Used For:
Swing Trading & Scalping: While optimized for the 15-minute timeframe, this strategy works across various timeframes, making it suitable for both short-term scalping and swing trading.
Crypto Trading: Tailored for Ethereum but effective for other cryptocurrencies due to its dynamic indicator setup.
在腳本中搜尋"crossover债券是什么"

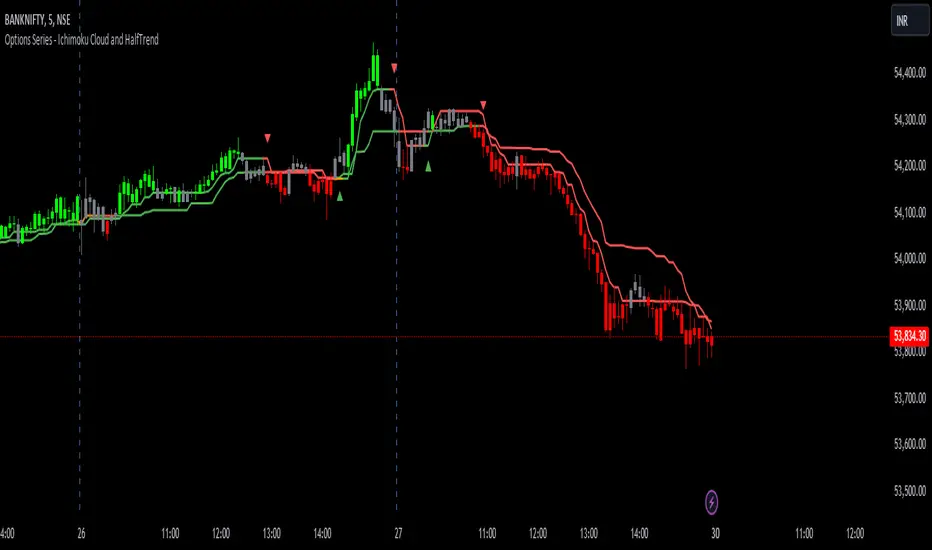
Options Series - Ichimoku Cloud and HalfTrend
The provided script combines two powerful technical indicators, Ichimoku Cloud and HalfTrend, to create a hybrid trading tool. Here's an analysis of the key components and how they work together:
Ichimoku Cloud and HalfTrend
⭐ 1. Indicator Title and Settings:
The script sets the title as "Options Series - Ichimoku Cloud and HalfTrend" and uses the overlay=true option to display the indicators directly on the price chart.
⭐ 2. Color Definitions:
Several colors are defined for later use:
Green and Red for different types of candles and signals.
Fluorescent Colors for highlighting significant trends or changes in market conditions.
⭐ 3. Ichimoku Cloud Setup:
The Ichimoku Cloud is a comprehensive indicator used to identify support, resistance, and trend direction. Here’s how the script configures it:
Conversion Periods, Base Periods, Lagging Span 2 Periods, and Displacement are customizable via input options, giving flexibility to adjust Ichimoku settings based on different market conditions.
The function donchian(len) calculates the Donchian Channel average, which is used to define the Conversion Line and Base Line. The crossover of these lines is crucial in determining bullish or bearish trends.
Color Logic for Kijun Cross: If the Conversion Line is above the Base Line, the trend is bullish (green color), while a bearish trend is indicated by red. A neutral condition is marked with orange.
⭐ 4. HalfTrend Indicator Setup:
The HalfTrend indicator detects trend reversals based on high/low price deviations from a moving average:
Amplitude and Channel Deviation inputs allow users to control the sensitivity of the indicator.
showArrows and showChannels toggle the display of buy/sell arrows and trend channels.
maxLowPrice and minHighPrice variables are initialized to track significant high/low points during the trend, used to confirm trend reversals.
⭐ 5. ATR and Trend Calculations:
The Average True Range (ATR) is used to calculate the volatility-based channels. The script calculates atr2 and uses this to create atrHigh and atrLow for plotting the channel.
The trend detection logic is as follows:
When the trend is upward, the script seeks confirmation by comparing the high moving average with previous lows, signaling a continuation of the uptrend if it holds.
Conversely, a downtrend is confirmed when the low moving average exceeds previous highs.
⭐ 6. Customized Candle Coloring:
A custom color scheme is applied to candles based on a combination of trend direction and Ichimoku Cloud signals:
GreenFluorescent for strong bullish conditions where price is above the HalfTrend line, and the Conversion Line is above the Base Line.
RedFluorescent for strong bearish conditions, with price below the HalfTrend line and Conversion Line below the Base Line.
Gray for neutral or indecisive conditions.
⭐ 7. Plots and Shapes:
The script plots various elements:
HalfTrend Line: The main trendline is plotted in either green (buy) or red (sell), with adjustable line width.
Ichimoku Base Line: This is plotted with the dynamic color based on crossovers.
Buy/Sell Arrows: These are drawn on the chart when valid buy/sell conditions are met.
Custom Candles: The script overrides default chart candles with custom-colored candles based on the previously discussed logic.
⭐ 8. Improvements:
Optimization: Parameters like the amplitude, channel deviation, and Ichimoku periods can be fine-tuned based on backtesting results to maximize performance for specific assets or timeframes.
Alerts: The script could be enhanced by adding alert conditions for real-time buy/sell notifications, leveraging alertcondition() in Pine Script.
In summary, this script merges two trend-following techniques for a multi-faceted view of the market, using visual cues and trendline logic to provide a robust trading tool.
🚀 Conclusion:
Trend-Following System: The combination of Ichimoku Cloud and HalfTrend provides a comprehensive view of both long-term trends (via Ichimoku) and shorter-term reversals (via HalfTrend).
Visual Signals: The script includes clear visual signals (arrows and custom-colored candles) to help traders quickly spot buy/sell opportunities.
Dynamic Customization: Through user inputs, this indicator can be tailored to different market conditions, making it versatile.
Kernel Regression ToolkitThis toolkit provides filters and extra functionality for non-repainting Nadaraya-Watson estimator implementations made by @jdehorty. For the sake of ease I have nicknamed it "kreg". Filters include a smoothing formula and zero lag formula. The purpose of this script is to help traders test, experiment and develop different regression lines. Regression lines are best used as trend lines and can be an invaluable asset for quickly locating first pullbacks and breaks of trends.
Other features include two J lines and a blend line. J lines are featured in tools like Stochastic KDJ. The formula uses the distance between K and D lines to make the J line. The blend line adds the ability to blend two lines together. This can be useful for several tasks including finding a center/median line between two lines or for blending in the characteristics of a different line. Default is set to 50 which is a 50% blend of the two lines. This can be increased and decreased to taste. This tool can be overlaid on the chart or on top of another indicator if you set the source. It can even be moved into its own window to create a unique oscillator based on whatever sources you feed it.
Below are the standard settings for the kernel estimation as documented by @jdehorty:
Lookback Window: The number of bars used for the estimation. This is a sliding value that represents the most recent historical bars. Recommended range: 3-50
Weighting: Relative weighting of time frames. As this value approaches zero, the longer time frames will exert more influence on the estimation. As this value approaches infinity, the behavior of the Rational Quadratic Kernel will become identical to the Gaussian kernel. Recommended range: 0.25-25
Level: Bar index on which to start regression. Controls how tightly fit the kernel estimate is to the data. Smaller values are a tighter fit. Larger values are a looser fit. Recommended range: 2-25
Lag: Lag for crossover detection. Lower values result in earlier crossovers. Recommended range: 1-2
For more information on this technique refer to to the original open source indicator by @jdehorty located here:

RiverFlow ADX ScreenerRiverFlow ADX Screener, Scans ADX and Donchian Trend values across various Timeframes. This screener provides support to the Riverflow indicator. Riverflow concept is based on Two indicators. Donchian Channel and ADX or DMI.
How to implement?
1.Donchian Channel with period 20
2. ADX / DMI 14,14 threshold 20
Entry / Exit:
1. Buy/Sell Signal from ADX Crossovers.
2. Trend Confirmation Donchian Channel.
3. Major Trend EMA 200
Buy/Sell:
After a buy/sell is generated by ADX Crossover, Check for Donchian Trend. it has to be in same direction as trend. for FTT trades take 2x limit. for Forex and Stocks take 1:1.5, SL must be placed below recent swing. One can use Riverflow indicator for better results.
ADX Indicator is plotted with
Plus: Green line
Minus: Red Line
ADX strength: plotted as Background area.
TREND: Trend is represented by Green and Red Area around Threshold line
Table:
red indicates down trend
green indicates up trend
grey indicates sideways
Weak ADX levels are treated sideways and a channel is plotted on ADX and PLUS and MINUS lines . NO TRADES are to be TAKEN on within the SIDEWAYS region.
Settings are not required as it purely works on Default settings. However Donchian Length can be changed from settings.
Timeframes below 1Day are screened. Riverflow strategy works on timeframe 5M and above timeframe. so option is not provided for lower timeframes.
Best suits for INTRADAY and LONG TERM Trading

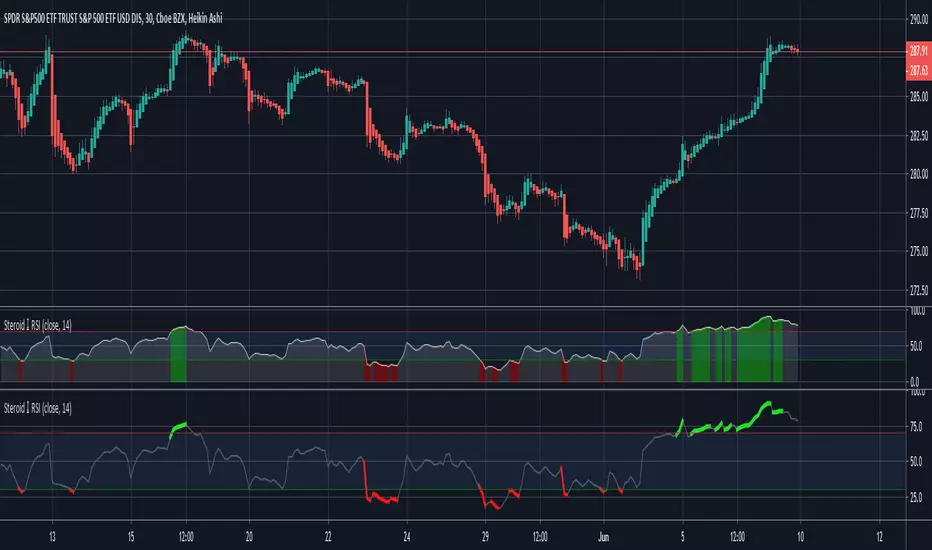
Steroid RSI w/ Overbought & Oversold Alert/@version=2
//By Tantamount
//RSI with overbought and oversold alert features! Highly configurable indicator that includes a Topography map feature, used to detect & easily show threshold crossovers.
//RSI is used to measure the velocity and change of directional price movements. It is very useful to help determine when an asset is reaching an overbought or oversold condition.
//This RSI tool comes loaded with features and is easily configurable back to standard RSI or configure with your own preferences.
Customize to your liking:
Topo map view or standard with highlighted crossover color.
If you like this tool and would like to DONATE/TIP:
Stellar XLM address: GA5XIGA5C7QTPTWXQHY6MCJRMTRZDOSHR6EFIBNDQTCQHG262N4GGKTM
Bitcoin BTC address: 3QwPUnZvAKBXBMU7WMckNgDyfv6PApYduA
WillySIGBased on "Willy" Indicator.
Red = overbought, Green = oversold, White = Crossover
Added MACD for visualisation of crossovers. May also be usefull for spotting divergences.
Happy about any feedback = ]

Smart Structure Breaks & Order BlocksOverview (What it does)
The indicator “Smart Structure Breaks & Order Blocks” detects market structure using swing highs and lows, identifies Break of Structure (BOS) events, and automatically draws order blocks (OBs) from the origin candle. These zones extend to the right and change color/outline when mitigated or invalidated. By formalizing and automating part of discretionary analysis, it provides consistent zone recognition.
Main Components
Swing Detection: ta.pivothigh/ta.pivotlow identify confirmed swing points.
BOS Detection: Determines if the recent swing high/low is broken by close (strict mode) or crossover.
OB Creation: After a BOS, the opposite candle (bearish for bullish BOS, bullish for bearish BOS) is used to generate an order block zone.
Zone Management: Limits the number of zones, extends them to the right, and tracks tagged (mitigated) or invalidated states.
Input Parameters
Left/Right Pivot (default 6/6): Number of bars required on each side to confirm a swing. Higher values = smoother swings.
Max Zones (default 4): Maximum zones stored per direction (bull/bear). Oldest zones are overwritten.
Zone Confirmation Lookback (default 3): Ensures OB origin candle validity by checking recent highs/lows.
Show Swing Points (default ON): Displays triangles on swing highs/lows.
Require close for BOS? (default ON): Strict BOS (close required) vs loose BOS (line crossover).
Use candle body for zones (default OFF): Zones drawn from candle body (ON) or wick (OFF).
Signal Definition & Logic
Swing Updates: Latest confirmed pivots update lastHighLevel / lastLowLevel.
BOS (Break of Structure):
Bullish – close breaks last swing high.
Bearish – close breaks last swing low.
Only one valid BOS per swing (avoids duplicates).
OB Detection:
Bullish BOS → previous bearish candle with lowest low forms the OB.
Bearish BOS → previous bullish candle with highest high forms the OB.
Zones: Bull = green, Bear = red, semi-transparent, extended to the right.
Zone States:
Mitigated: Price touches the zone → border highlighted.
Invalidated:
Bull zone → close below → turns red.
Bear zone → close above → turns green.
Chart Appearance
Swing High: red triangle above bar
Swing Low: green triangle below bar
Bull OB: green zone (border highlighted on touch)
Bear OB: red zone (border highlighted on touch)
Invalid Zones: Bull zones turn reddish, Bear zones turn greenish
Practical Use (Trading Assistance)
Trend Following Entries: Buy pullbacks into green OBs in uptrends, sell rallies into red OBs in downtrends.
Focus on First Touch: First mitigation after BOS often has higher reaction probability.
Confluence: Combine with higher timeframe trend, volume, session levels, key price levels (previous highs/lows, VWAP, etc.).
Stops/Targets:
Bull – stop below zone, partial take profit at swing high or resistance.
Bear – stop above zone, partial take profit at swing low or support.
Parameter Tuning (per market/timeframe)
Pivot (6/6 → 4/4/8/8): Lower for scalping (3–5), medium for day trading (5–8), higher for swing trading (8–14). Increase to reduce noise.
Strict Break: ON to reduce false breaks in ranging markets; OFF for earlier signals.
Body Zones: ON for assets with long wicks, OFF for cleaner OBs in liquid instruments.
Zone Confirmation (default 3): Increase for stricter OB origin, fewer zones.
Max Zones (default 4 → 6–10): Increase for higher volatility, decrease to avoid clutter.
Strengths
Standardizes BOS and OB detection that is usually subjective.
Tracks mitigation and invalidation automatically.
Adaptable: allows body/wick zone switching for different instruments.
Limitations
Pivot-based: Signals appear only after pivots confirm (slight lag).
Zones reflect past balance: Can fail after new events (news, earnings, macro data).
Range-heavy markets: More false BOS; consider stricter settings.
Backtesting: This script is for drawing/visual aid; trading rules must be defined separately.
Workflow Example
Identify higher timeframe trend (4H/Daily).
On lower TF (15–60m), wait for BOS and new OB.
Enter on first mitigation with confirmation candle.
Stop beyond zone; targets based on R multiples and swing points.
FAQ
Q: Why are zones invalidated quickly?
A: Flow reversal after BOS. Adjust pivots higher, enable Strict mode, or switch to Body zones to reduce noise.
Q: What does “tagged” mean?
A: Price touched the zone once = mitigated. Implies some orders in that zone may have been filled.
Q: Body or Wick zones?
A: Wick zones are fine in clean markets. For volatile pairs with long wicks, body zones provide more realistic areas.
Customization Tips (Code perspective)
Zone storage: Currently ring buffer ((idx+1) % zoneLimit). Could prioritize keeping unmitigated zones.
Automated testing: Add strategy.entry/exit for rule-based backtests.
Multi-timeframe: Use request.security() for higher timeframe swings/BOS.
Visualization: Add labels for BOS bars, tag zones with IDs, count touches.
Summary
This indicator formalizes the cycle Swing → BOS → OB creation → Mitigation/Invalidation, providing consistent structure analysis and zone tracking. By tuning sensitivity and strictness, and combining with higher timeframe context, it enhances pullback/continuation trading setups. Always combine with proper risk management.

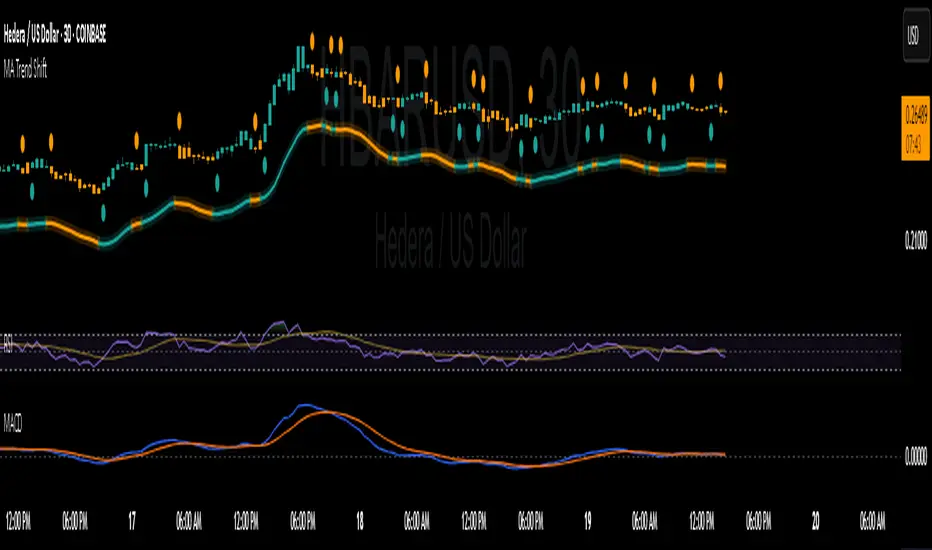
MA Shift (Offset Only + Flip Dots)Indicator Overview
This custom moving average indicator shifts the SMA away from price by a fixed percent or ATR multiple. It delivers a clear, uncluttered view of trend direction and momentum while keeping the price bars visible. A single offset line glows in semi-transparent shading and changes color based on trend state. When the price crosses the base SMA, a small dot marks the flip point.
Key Features
Adjustable Length
Choose any SMA period (default six) to suit your time frame and trading style.
Flexible Offset Mode
Percent mode places the line a fixed percentage above or below the SMA.
ATR mode spaces the line dynamically based on market volatility.
Direction Toggle
Shift the line up or down away from candles.
Glow Effect
A wide, semi-transparent band highlights the offset line for easy visibility.
Trend-Flip Dots
A tiny circle appears below the bar when the trend turns up and above the bar when it turns down, helping you spot reversals at a glance.
Custom Candle and Bar Coloring
Bars and candles recolor to reflect the current trend, reinforcing visual clarity.
How It Works
Base SMA Calculation
The indicator computes a standard SMA on your chosen source (high+low 2 by default).
Offset Application
It then adds or subtracts the percent or ATR-based distance to create a second line.
Trend Detection
When price moves above the SMA, the offset line and bars turn to your “up” color. When price drops below, they switch to your “down” color.
Flip Signals
On the bar that triggers a color change, a dot marks the exact reversal point.
Trading Signals and Usage
Trend Confirmation
Use the offset line as a clean trend guide. Price consistently above the line with green bars signals a bullish regime. Price below the line with orange bars signals bearish control.
Entry and Exit
Long Entry: Wait for a flip-up dot and a green close above the offset line.
Short Entry: Watch for a flip-down dot and an orange close below the offset line.
Stops and Targets: Place stops just inside the offset line on pullbacks for dynamic risk management.
Avoiding Whipsaws
The visual separation helps you ignore minor noise around price. Combine flip dots with bar color to filter false turns.
Confluence with MACD
Pair this offset SMA with the MACD for stronger signals:
MACD Trend Filter
Require the MACD line to be above its signal line (and histogram above zero) before taking a long flip-up from the offset MA.
Momentum Confirmation
When the offset SMA flips to a downtrend, look for the MACD histogram to turn negative. That alignment avoids fade-against-momentum trades.
Entry Timing
Use the MACD crossover as a lead-in filter and the offset SMA flip as the actual trigger. This two-step approach keeps you on the right side of larger moves.
Publishing Tips on TradingView
Description: Summarize features and usage in the indicator’s “About” field.
Inputs: List each setting clearly so users know how to tweak period, offset mode, percent/ATR values and color choices.
Examples: Include a chart snapshot showing a long setup with both the offset SMA flip and a confirming MACD crossover.
Release Notes: Mention version defaults (six-period SMA, ten-percent offset) and invite feedback for improvements.
Tags: Use relevant keywords like “Moving Average,” “Offset Indicator,” “Trend Filter,” and “MACD Confluence” to make it easy to find.
With its simple dot signals and customizable glow, this offset SMA becomes a powerful visual tool—especially when paired with MACD—for spotting clean trend entries and exits.
[3Commas] Signal BuilderSignal Builder is a tool designed to help traders create custom buy and sell signals by combining multiple technical indicators. Its flexibility allows traders to set conditions based on their specific strategy, whether they’re into scalping, swing trading, or long-term investing. Additionally, its integration with 3Commas bots makes it a powerful choice for those looking to automate their trades, though it’s also ideal for traders who prefer receiving alerts and making manual decisions.
🔵 How does Signal Builder work?
Signal Builder allows users to define custom conditions using popular technical indicators, which, when met, generate clear buy or sell signals. These signals can be used to trigger TradingView alerts, ensuring that you never miss a market opportunity. Additionally, all conditions are evaluated using "AND" logic, meaning signals are only activated when all user-defined conditions are met. This increases precision and helps avoid false signals.
🔵 Available indicators and recommended settings:
Signal Builder provides access to a wide range of technical indicators, each customizable to popular settings that maximize effectiveness:
RSI (Relative Strength Index): An oscillator that measures the relative strength of price over a specific period. Traders typically configure it with 14 periods, using levels of 30 (oversold) and 70 (overbought) to identify potential reversals.
MACD (Moving Average Convergence Divergence): A key indicator tracking the crossover between two moving averages. Common settings include 12 and 26 periods for the moving averages, with a 9-period signal line to detect trend changes.
Ultimate Oscillator: Combines three different time frames to offer a comprehensive view of buying and selling pressure. Popular settings are 7, 14, and 28 periods.
Bollinger Bands %B: Provides insight into where the price is relative to its upper and lower bands. Standard settings include a 20-period moving average and a standard deviation of 2.
ADX (Average Directional Index): Measures the strength of a trend. Values above 25 typically indicate a strong trend, while values below suggest weak or sideways movement.
Stochastic Oscillator: A momentum indicator comparing the closing price to its range over a defined period. Popular configurations include 14 periods for %K and 3 for %D smoothing.
Parabolic SAR: Ideal for identifying trend reversals and entry/exit points. Commonly configured with a 0.02 step and a 0.2 maximum.
Money Flow Index (MFI): Similar to RSI but incorporates volume into the calculation. Standard settings use 14 periods, with levels of 20 and 80 as oversold and overbought thresholds.
Commodity Channel Index (CCI): Measures the deviation of price from its average. Traders often use a 20-period setting with levels of +100 and -100 to identify extreme overbought or oversold conditions.
Heikin Ashi Candles: These candles smooth out price fluctuations to show clearer trends. Commonly used in trend-following strategies to filter market noise.
🔵 How to use Signal Builder:
Configure indicators: Select the indicators that best fit your strategy and adjust their settings as needed. You can combine multiple indicators to define precise entry and exit conditions.
Define custom signals: Create buy or sell conditions that trigger when your selected indicators meet the criteria you’ve set. For example, configure a buy signal when RSI crosses above 30 and MACD confirms with a bullish crossover.
TradingView alerts: Set up alerts in TradingView to receive real-time notifications when the conditions you’ve defined are met, allowing you to react quickly to market opportunities without constantly monitoring charts.
Monitor with the panel: Signal Builder includes a visual panel that shows active conditions for each indicator in real time, helping you keep track of signals without manually checking each indicator.
🔵 3Commas integration:
In addition to being a valuable tool for any trader, Signal Builder is optimized to work seamlessly with 3Commas bots through Webhooks. This allows you to automate your trades based on the signals you’ve configured, ensuring that no opportunity is missed when your defined conditions are met. If you prefer automation, Signal Builder can send buy or sell signals to your 3Commas bots, enhancing your trading process and helping you manage multiple trades more efficiently.
🔵 Example of use:
Imagine you trade in volatile markets and want to trigger a sell signal when:
Stochastic Oscillator indicates overbought conditions with the %K value crossing below 80.
Bollinger Bands %B shows the price has surpassed the upper band, suggesting a potential reversal.
ADX is below 20, indicating that the trend is weak and could be about to change.
With Signal Builder , you can configure these conditions to trigger a sell signal only when all are met simultaneously. Then, you can set up a TradingView alert to notify you as soon as the signal is activated, giving you the opportunity to react quickly and adjust your strategy accordingly.
👨🏻💻💭 If this tool helps your trading strategy, don’t forget to give it a boost! Feel free to share in the comments how you're using it or if you have any questions.
_________________________________________________________________
The information and publications within the 3Commas TradingView account are not meant to be and do not constitute financial, investment, trading, or other types of advice or recommendations supplied or endorsed by 3Commas and any of the parties acting on behalf of 3Commas, including its employees, contractors, ambassadors, etc.

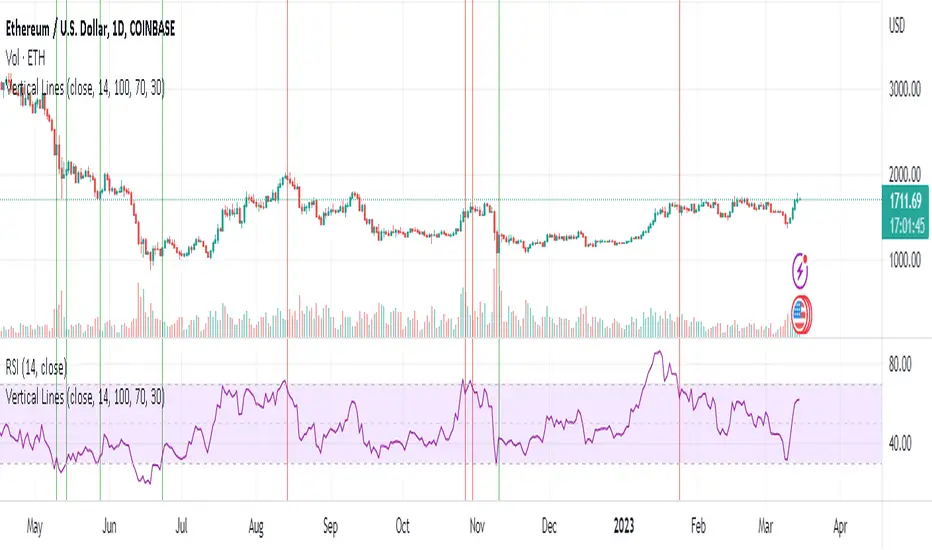
Vertical Lines 2A vertical line plotting function is missing in Pinescript. This is another method to plot vertical line on a chart, and an improvement on my previous script "vertical lines" .
The script hacks the plotcandle function to display just the wicks without the body. This hack simulates a vertical line. The body of the candle is non-existing since the open and close are the same and its color is set to null. The wicks are abutting resulting in a continuous vertical line.
Drawbacks include inability to set width and transparency of the lines. The plotcandle function does not allow setting the width and transparency of the wicks. This feature would be desirable.
The crossing of the RSI of overbought and undersold zones is used as an example in this published script. Any indicator can be used and this script can be executed on any other indicator by using "add indicator" on the desired indicator, and selecting the indicator as the source. I added crossover lines on the plotted RSI as an example.
//////////////////////////////////////////////////////Breakdown of the script////////////////////////////////////////////////////////
The src input determines which price data is used for the highest value calculation. By default, it is set to the close price.
The length input determines the length of the RSI calculation. By default, it is set to 14.
The mult input determines the multiplier of the highest value that is used to determine the height of the vertical lines. By default, it is set to 100%, meaning the lines will reach the highest value in the dataset.
The top and bot inputs determine the overbought and oversold levels for the RSI. By default, they are set to 70 and 30, respectively.
The current_rsi and previous_rsi variables calculate the RSI values for the current bar and the previous bar, respectively.
The hi_value variable finds the highest value in the dataset, and the hi variable calculates the height of the vertical lines based on the highest value and the user-defined multiplier. The lo variable calculates the distance between the highest value and the current price data.
The uph, dnh, upl, and dnl variables determine the height and low of the vertical lines for when the RSI crosses overbought or oversold levels.
The if statements check if the RSI has crossed overbought or oversold levels and set the uph, dnh, upl, and dnl variables accordingly.
Finally, the plotcandle() function is used to plot the vertical lines on the chart. The open and close values are set to the src input, and the high and low values are set to the uph, dnh, upl, and dnl variables. The bordercolor argument is set to na to hide the borders of the lines, and the wickcolor argument is set to green or red, depending on whether the line is an overbought or oversold crossover.
/////////////////////////////////////////////////////////////////////////////////////////////////////////////////////////////////////////
Rocket Grid Algorithm - The Quant ScienceThe Rocket Grid Algorithm is a trading strategy that enables traders to engage in both long and short selling strategies. The script allows traders to backtest their strategies with a date range of their choice, in addition to selecting the desired strategy - either SMA Based Crossunder or SMA Based Crossover.
The script is a combination of trend following and short-term mean reversing strategies. Trend following involves identifying the current market trend and riding it for as long as possible until it changes direction. This type of strategy can be used over a medium- to long-term time horizon, typically several months to a few years.
Short-term mean reversing, on the other hand, involves taking advantage of short-term price movements that deviate from the average price. This type of strategy is usually applied over a much shorter time horizon, such as a few days to a few weeks. By rapidly entering and exiting positions, the strategy seeks to capture small, quick gains in volatile market conditions.
Overall, the script blends the best of both worlds by combining the long-term stability of trend following with the quick gains of short-term mean reversing, allowing traders to potentially benefit from both short-term and long-term market trends.
Traders can configure the start and end dates, months, and years, and choose the length of the data they want to work with. Additionally, they can set the percentage grid and the upper and lower destroyers to manage their trades effectively. The script also calculates the Simple Moving Average of the chosen data length and plots it on the chart.
The trigger for entering a trade is defined as a crossunder or crossover of the close price with the Simple Moving Average. Once the trigger is activated, the script calculates the total percentage of the side and creates a grid range. The grid range is then divided into ten equal parts, with each part representing a unique grid level. The script keeps track of each grid level, and once the close price reaches the grid level, it opens a trade in the specified direction.
The equity management strategy in the script involves a dynamic allocation of equity to each trade. The first order placed uses 10% of the available equity, while each subsequent order uses 1% less of the available equity. This results in the allocation of 9% for the second order, 8% for the third order, and so on, until a maximum of 10 open trades. This approach allows for risk management and can help to limit potential losses.
Overall, the Rocket Grid Algorithm is a flexible and powerful trading strategy that can be customized to meet the specific needs of individual traders. Its user-friendly interface and robust backtesting capabilities make it an excellent tool for traders looking to enhance their trading experience.

TSI + DivergencesTrue Strength Indicator (TSI) + Divergences + Alerts + Lookback periods.
This version of the True Strength Indicator adds the following 3 additional features to the stock TSI by Tradingview:
- Optional divergence lines drawn directly onto the oscillator.
- Configurable alerts to notify you when divergences occur.
- Configurable lookback periods to fine tune the divergences drawn in order to suit different trading styles and timeframes.
This indicator adds additional features onto the stock TSI by Tradingview, whose core calculations remain unchanged. Namely the configurable option to automatically, quickly and clearly draw divergence lines onto the oscillator for you as they occur, with minimal delay. It also has the addition of unique alerts, so you can be notified when divergences occur without spending all day watching the charts. Furthermore, this version of the TSI comes with configurable lookback periods, which can be configured in order to adjust the sensitivity of the divergences, in order to suit shorter or higher timeframe trading approaches.
The True Strength Indicator
Tradingview describes the True Strength Indicator as follows:
“The True Strength Index (TSI) is a momentum oscillator that ranges between limits of -100 and +100 and has a base value of 0. Momentum is positive when the oscillator is positive (pointing to a bullish market bias) and vice versa. It was developed by William Blau and consists of 2 lines: the index line and an exponential moving average of the TSI, called the signal line. Traders may look for any of the following 5 types of conditions: overbought, oversold, centerline crossover, divergence and signal line crossover. The indicator is often used in combination with other signals..”
What are divergences?
Divergence is when the price of an asset is moving in the opposite direction of a technical indicator, such as an oscillator, or is moving contrary to other data. Divergence warns that the current price trend may be weakening, and in some cases may lead to the price changing direction.
There are 4 main types of divergence, which are split into 2 categories;
regular divergences and hidden divergences. Regular divergences indicate possible trend reversals, and hidden divergences indicate possible trend continuation.
Regular bullish divergence: An indication of a potential trend reversal, from the current downtrend, to an uptrend.
Regular bearish divergence: An indication of a potential trend reversal, from the current uptrend, to a downtrend.
Hidden bullish divergence: An indication of a potential uptrend continuation.
Hidden bearish divergence: An indication of a potential downtrend continuation.
Setting alerts.
With this indicator you can set alerts to notify you when any/all of the above types of divergences occur, on any chart timeframe you choose.
Configurable lookback values.
You can adjust the default lookback values to suit your prefered trading style and timeframe. If you like to trade a shorter time frame, lowering the default lookback values will make the divergences drawn more sensitive to short term price action.
How do traders use divergences in their trading?
A divergence is considered a leading indicator in technical analysis, meaning it has the ability to indicate a potential price move in the short term future.
Hidden bullish and hidden bearish divergences, which indicate a potential continuation of the current trend are sometimes considered a good place for traders to begin, since trend continuation occurs more frequently than reversals, or trend changes.
When trading regular bullish divergences and regular bearish divergences, which are indications of a trend reversal, the probability of it doing so may increase when these occur at a strong support or resistance level. A common mistake new traders make is to get into a regular divergence trade too early, assuming it will immediately reverse, but these can continue to form for some time before the trend eventually changes, by using forms of support or resistance as an added confluence, such as when price reaches a moving average, the success rate when trading these patterns may increase.
Typically, traders will manually draw lines across the swing highs and swing lows of both the price chart and the oscillator to see whether they appear to present a divergence, this indicator will draw them for you, quickly and clearly, and can notify you when they occur.
Disclaimer : This script includes code from the stock TSI by Tradingview as well as the RSI divergence indicator.

MACD Support ResistanceThis script is dynamic support & resistance based on MACD cross.
Resistance= Highest value of candle looks back when MACD crossunder.
Support= Lowest value of candle looks back when MACD crossover.
Middle line is average of Resistance and Support.
Buy when close, LSMA and SMMA crossover middle line. Please use Green Trend Line as SL or Trailing.
Sell when close, LSMA and SMMA crossunder middle line. Please use Red Trend Line as SL or Trailing.
Let me know if its useful for you in the comments and by giving Like (means a lot to me). Also share your feedback and ideas to improve this script further.

Angle Baby from JuiidaEasy and Simple
whenever fast moving average crossunder slow moving average, the bullish angle is created. A positive value in bull angle implies ticker is in bull mode from the reference point of crossunder.
Again, whenever fast moving average crossover slow moving average, the bearish angle is created. A negative value in bear angle implies ticker is in bear mode from the reference point of crossover.
!!!!enjoy!!!!

Crypto EMA Trend Reversal StrategyThis is an EMA crossover strategy which involves 5 EMAs to trigger trades. The strategy has two take profit settings and uses a stop loss.
TP1 and SL are based on ATR and TP2 is an EMA crossover.
The strategy goes both long and short and the default settings work particularly well as a scalping strategy for ETHUSDT on the 5M time frame.
I have also created another version with tweaked settings for scalping LINKUSDT on the 5M with very similar results.
There is an option to add a volume condition parameter within the script on lines 26-28 which can be added to the end of lines 34-35 in the following format: and vol_cond
I personally don't currently use the volume condition parameter.

EMA CrossThis strategy is based on EMA crossover. Looking on the crossover you will find long opportunity when crossed to up side or sort opportunity when crossed down side.
Before enter into opportunity you need to wait to close the candle to recent high or low. Stop loss would be recent high or low or red line.

Better Moving AveragesThis indicator is comprised of 3 SMAs, 3 EMAs along with the long/short SMA crossover and the long/short EMA crossover. The point is to pack all of your moving average needs into one indicator(so you don't need to buy TradingView Pro!)

Everyday 0003 _ MAC Pullback I recently posted a Moving Averge Crossover strategy for my Everyday project - a project I've given myself where I try to create one strategy everyday in between 15 minutes and 2 hours.
In the comments of my last published idea, user SignalTradersUK was very kind and suggested I try the following in my next study:
"i think your next study should be, to workout what to do after the Moving Average cross! If you look just on the chart you have posted, Price would appear to always come back to the levels where the 2 MA's cross and then go back in the direction of the crossing of the MA's. It's a great pull back strategy."
I'm really just beginning to learn about coding strategies so I'm not 100% sure I correctly understood his suggestion.
I admit I had difficulties wrapping my head around how to do this.
Anyway, the result is a strategy which runs alongside the main Moving Average Crossover.
'The Algorithm'
When the fast and slow MA cross the strategy traces back 40 days to find a swing low.
This swing low and the price at the MA cross is used to calculate a fib 1.272 extension.
The price at this 1.272 extension is used to place a Pullback short order.
Since we're shorting a bull trend, a tight stop is used.
If the pullback reaches down to the fib 0.618 we take profit (close the short).
Like I said, I don't know if I correctly understood SignalTradersUK feedback, but I really appreciate the
feedback and advice!
As always I'm hoping to learn from the community, so all feedback, corrections and advice is very welcome!
Thanks!
/pbergden

DTM 444 BANDS 🚀DTM 444 BANDS 🚀:
The DTM 444 BANDS 🚀 is a powerful, multi-purpose trading indicator combining Supertrend, Dynamic Band Levels, Breakout Signals, and Volume Confirmation to help traders identify high-probability trade setups across different timeframes.
🔧 Key Features
✅ Multi-Timeframe Support
Analyze price action across any timeframe using the Timeframe input.
All band calculations (High, Low, Midline, and Supertrend) are pulled from a higher timeframe for clearer context.
✅ Dynamic Bands Based on Supertrend
High Band: Rolling highest of Supertrend over hiLen period.
Low Band: Rolling lowest of Supertrend over loLen period.
Midline: Midpoint of the above.
Acts like dynamic support/resistance, ideal for trend-following and breakout strategies.
✅ Dual Signal System
Breakout Signals (Buy and Sell): Triggered when price breaks the bands with volume confirmation.
Supertrend Crossover Signals (Buy1 and Sell1): Classic momentum entries with a confirmation twist.
Exit Signals: Optional take-profit/neutral indicators when price reverses.
✅ Volume Confirmation Filter (Optional)
Only triggers signals if the volume exceeds its 20-period SMA.
Helps filter out false breakouts and weak trends in low-liquidity periods.
✅ Visual Enhancements
Color-coded candles based on band positioning (e.g., red = weak, green = strong, etc.)
On-chart labels for each signal for quick reference.
Real-time Signal Dashboard using Pine Script tables showing:
Current signal
Volume filter status
Live volume vs volume SMA
🧪 Practical Use Cases
Trend Traders: Use the Supertrend cross and band breakouts to ride trends early.
Breakout Traders: Catch high-probability moves outside established ranges.
Swing Traders: Time entries and exits using color-coded bars and exit labels.
Volume-Sensitive Traders: Focus on trades with strong volume backing.
📊 Backtest Snapshot
Based on the example chart for Reliance Industries (RELIANCE.NS) on the weekly timeframe:
Several profitable buy and breakout signals during uptrends.
Timely exits and breakdown alerts before reversals.
Volume filter keeps trades clean and avoids noise.
⚙️ Customizable Parameters
High Length and Low Length (default: 19)
Supertrend Multiplier and ATR Length
Volume Filter: Toggle ON/OFF
Volume SMA Length: Default 20
Custom Timeframe: Choose any higher timeframe for multi-timeframe analysis
📢 Alerts Ready
Fully integrated with TradingView alerts:
Breakout & Breakdown
Supertrend crossovers
All alerts respect the volume filter setting
🏁 Final Thoughts
DTM 444 BANDS 🚀 is a versatile and adaptive trading system that blends trend analysis, volatility bands, and volume validation. Whether you're a trend trader, breakout hunter, or swing trader — this tool gives you a structured edge with clear visual cues and real-time alerts.

Market Sentiment Trend Gauge [LevelUp]Market Sentiment Trend Gauge simplifies technical analysis by mathematically combining momentum, trend direction, volatility position, and comparison against a market benchmark, into a single trend score from -100 to +100. Displayed in a separate pane below your chart, it resolves conflicting signals from RSI, moving averages, Bollinger Bands, and market correlations, providing clear insights into trend direction, strength, and relative performance.
THE PROBLEM MARKET SENTIMENT TREND GAUGE (MSTG) SOLVES
Traditional indicators often produce conflicting signals, such as RSI showing overbought while prices rise or moving averages indicating an uptrend despite market underperformance. MSTG creates a weighted composite score to answer: "What's the overall bias for this asset?"
KEY COMPONENTS AND WEIGHTINGS
The trend score combines
▪ Momentum (25%): Normalized 14-period RSI, capped at ±100.
▪ Trend Direction (35%): 10/21-period EMA relationships,
▪ Volatility Position (20%): Price position, 20-period Bollinger Bands, capped at ±100.
▪ Market Comparison (20%): Daily performance vs. SPY benchmark, capped at ±100.
Final score = Weighted sum, smoothed with 5-period EMA.
INTERPRETING THE MSTG CHART
Trend Score Ranges and Colors
▪ Bright Green (>+30): Strong bullish; ideal for long entries.
▪ Light Green (+10 to +30): Weak bullish; cautiously favorable.
▪ Gray (-10 to +10): Neutral; avoid directional trades.
▪ Light Red (-10 to -30): Weak bearish; exercise caution.
▪ Bright Red (<-30): Strong bearish; high-risk for longs, consider shorts.
Reference Lines
▪ Zero Line (Gray): Separates bullish/bearish; crossovers signal trend changes.
▪ ±30 Lines (Dotted, Green/Red): Thresholds for strong trends.
▪ ±60 Lines (Dashed, Green/Red): Extreme strength zones (not overbought/oversold); manage risk (tighten stops, partial profits) but trends may persist.
Background Colors
▪ Green Tint (>+20): Bullish environment; favorable for longs.
▪ Red Tint (<-20): Bearish environment; caution for longs.
▪ Light Gray Tint (-20 to +20): Neutral/range-bound; wait for signals.
Extreme Readings vs. Traditional Signals
MSTG ±60 indicates maximum alignment of all factors, not reversals (unlike RSI >70/<30). Use for risk management, not automatic exits. Strong trends can sustain extremes; breakdowns occur below +30 or above -30.
INFORMATION TABLE INTERPRETATION
Trend Score Symbols
▲▲ >+30 strong bullish
▲ +10 to +30
● -10 to +10 neutral
▼ -30 to -10
▼▼ <-30 strong bearish
Colors: Green (positive), White (neutral), Red (negative).
Momentum Score
+40 to +100 strong bullish
0 to +40 moderate bullish
-40 to 0 moderate bearish
-100 to -40 strong bearish
Market vs. Stock
▪ Green: Stock outperforming market
▪ Red: Stock underperforming market
Example Interpretations:
-0.45% / +1.23% (Green): Market down, stock up = Strong relative strength
+2.10% / +1.50% (Red): Both rising, but stock lagging = Relative weakness
-1.20% / -0.80% (Green): Both falling, but stock declining less = Defensive strength
UNDERSTANDING EXTREME READINGS VS TRADITIONAL OVERBOUGHT/OVERSOLD
⚠️ Critical distinctions
Traditional Overbought/Oversold Signals:
▪ Single indicator (like RSI >70 or <30) showing momentum excess
▪ Often suggests immediate reversal or pullback expected
▪ Based on "price moved too far, too fast" concept
MSTG Extreme Readings (±60):
▪ Composite alignment of 4 different factors (momentum, trend, volatility, relative strength)
▪ Indicates maximum strength in current direction
▪ NOT a reversal signal - means "all systems extremely bullish/bearish"
Key Differences:
▪ RSI >70: "Price got ahead of itself, expect pullback"
▪ MSTG >+60: "Everything is extremely bullish right now"
▪ Strong trends can maintain extreme MSTG readings during major moves
▪ Breakdowns happen when MSTG falls below +30, not at +60
Proper Usage of Extreme Readings:
▪ Risk Management: Tighten stops, take partial profits
▪ Position Sizing: Reduce new position sizes at extremes
▪ Trend Continuation: Watch for sustained extreme readings in strong markets
▪ Exit Signals: Look for breakdown below +30, not reversal from +60
TRADING WITH MSTG
Quick Assessment
1. Check trend symbol for direction.
2. Confirm momentum strength.
3. Note relative performance color.
Examples:
▲▲ 55.2 (Green), Momentum +28.4, Outperforming: Strong buy setup.
▼ -18.6 (Red), Momentum -43.2, Underperforming: Defensive positioning.
Entry Conditions
▪ Long: stock outperforming market
- Score >+30 (bright green)
- Sustained green background
- ▲▲ symbol,
▪ Short: stock underperforming market
- Score <-30 (bright red)
- Sustained red background
- ▼▼ symbol
Avoid Trading When:
▪ Gray zone (-10 to +10).
▪ Rapid color changes or frequent zero-line crosses (choppy market).
▪ Gray background (range-bound).
Risk Management:
▪ Stop Loss: Exit on zero-line crossover against position.
▪ Take Profit: Partial at ±60 for risk control.
▪ Position Sizing: Larger when signals align; smaller in extremes or mixed conditions.
KEY ADVANTAGES
▪ Unified View: Weighted composite reduces noise and conflicts.
▪ Visual Clarity: 5-color system with gradients for rapid recognition.
▪ Market Context: Relative strength vs. SPY identifies leaders/laggards.
▪ Flexibility: Works across timeframes (1-min to weekly); customizable table.
▪ Noise Reduction: EMA smoothing minimizes false signals.
EXAMPLES
Strong Bull: Trend Score 71.9, Momentum Score 76.9
Neutral: Trend Score 0.1, Momentum Score -9.2
Strong Bear: Trend Score -51.7, Momentum Score -51.5
PERFORMANCE AND LIMITATIONS
Strengths: Trend identification, noise reduction, relative performance versus market.
Limitations: Lags at turning points, less effective in extreme volatility or non-trending markets.
Recommendations: View on multiple timeframes, combine with price action and fundamentals.

Market Pressure Oscillator█ OVERVIEW
The Market Pressure Oscillator is an advanced technical indicator for TradingView, enabling traders to identify potential trend reversals and momentum shifts through candle-based pressure analysis and divergence detection. It combines a smoothed oscillator with moving average signals, overbought/oversold levels, and divergence visualization, enhanced by customizable gradients, dynamic band colors, and alerts for quick decision-making.
█ CONCEPT
The indicator measures buying or selling pressure based on candle body size (open-to-close difference) and direction, with optional smoothing for clarity and divergence detection between price action and the oscillator. It relies solely on candle data, offering insights into trend strength, overbought/oversold conditions, and potential reversals with a customizable visual presentation.
█ WHY USE IT?
- Divergence Detection: Identifies bullish and bearish divergences to reinforce signals, especially near overbought/oversold zones.
- Candle Pressure Analysis: Measures pressure based on candle body size, normalized to a ±100 scale.
- Signal Generation: Provides buy/sell signals via overbought/oversold crossovers, zero-line crossovers, moving average zero-line crossovers, and dynamic band color changes.
- Visual Clarity: Uses dynamic colors, gradients, and fill layers for intuitive chart analysis.
Flexibility: Extensive settings allow customization to individual trading preferences.
█ HOW IT WORKS?
- Candle Pressure Calculation: Computes candle body size as math.abs(close - open), normalized against the average body size over a lookback period (avgBody = ta.sma(body, len)). - Candle direction (bullish: +1, bearish: -1, neutral: 0) is multiplied by body weight to derive pressure.
- Cumulative Pressure: Sums pressure values over the lookback period (Lookback Length) and normalizes to ±100 relative to the maximum possible value.
- Smoothing: Optionally applies EMA (Smoothing Length) to normalized pressure.
- Moving Average: Calculates SMA (Moving Average Length) for trend confirmation (Moving Average (SMA)).
- Divergence Detection: Identifies bullish/bearish divergences by comparing price and oscillator pivot highs/lows within a specified range (Pivot Length). Divergence signals appear with a delay equal to the Pivot Length.
- Signals: Generates signals for:
Crossing oversold upward (buy) or overbought downward (sell).
Crossing the zero line by the oscillator or moving average (buy/sell).
Bullish/bearish divergences, marked with labels, enhancing signals, especially near overbought/oversold zones.
Dynamic band color changes when the moving average crosses MA overbought/oversold thresholds (green for oversold, red for overbought).
- Visualization: Plots the oscillator and moving average with dynamic colors, gradient fills, transparent bands, and labels, with customizable overbought/oversold levels.
Alerts: Built-in alerts for divergences, overbought/oversold crossovers, and zero-line crossovers (oscillator and moving average).
█ SETTINGS AND CUSTOMIZATION
- Lookback Length: Period for aggregating candle pressure (default: 14).
- Smoothing Length (EMA): EMA length for smoothing the oscillator (default: 1). Higher values smooth the signal but may reduce signal frequency; adjust overbought/oversold levels accordingly.
- Moving Average Length (SMA): SMA length for the moving average (default: 14, minval=1). Higher values make SMA a trend indicator, requiring adjusted MA overbought/oversold levels.
- Pivot Length (Left/Right): Candles for detecting pivot highs/lows in divergence calculations (default: 2, minval=1). Higher values reduce noise but add delay equal to the set value.
- Enable Divergence Detection: Enables divergence detection (default: true).
- Overbought/Oversold Levels: Thresholds for the oscillator (default: 30/-30) and moving average (default: 10/-10). For the moving average, no arrows appear; bands change color from gray to green (oversold) or red (overbought), reinforcing entry signals.
- Signal Type: Select signals to display: "None", "Overbought/Oversold", "Zero Line", "MA Zero Line", "All" (default: "Overbought/Oversold").
- Colors and Gradients: Customize colors for bullish/bearish oscillator, moving average, zero line, overbought/oversold levels, and divergence labels.
- Transparency: Adjust gradient fill transparency (default: 70, minval=0, maxval=100) and band/label transparency (default: 40, minval=0, maxval=100) for consistent visuals.
- Visualizations: Enable/disable moving average, gradients for zero/overbought/oversold levels, and gradient fills.
█ USAGE EXAMPLES
- Momentum Analysis: Observe the MPO Oscillator above 0 for bullish momentum or below 0 for bearish momentum. The SMA, being smoother, reacts slower and can confirm trend direction as a noise filter.
- Reversal Signals: Look for buy triangles when the oscillator crosses oversold upward, especially when the SMA is below the MA oversold threshold and the band turns green. Similarly, seek sell triangles when crossing overbought downward, with the SMA above the MA overbought threshold and the band turning red.
- Using Divergences: Treat bullish (green labels) and bearish (red labels) divergences as reinforcement for other signals, especially near overbought/oversold zones, indicating stronger potential trend reversals.
- Customization: Adjust lookback length, smoothing, and moving average length to specific instruments and timeframes to minimize false signals.
█ USER NOTES
Combine the indicator with tools like Fibonacci levels or pivot points to enhance accuracy.
Test different settings for lookback length, smoothing, and moving average length on your chosen instrument and timeframe to find optimal values.

Grand Master's Candlestick Dominance (ATR Enhanced)### Grand Master's Candlestick Dominance (ATR Enhanced)
**Overview**
Unleash the ancient wisdom of Japanese candlestick charting with a modern twist! This comprehensive Pine Script v5 strategy and indicator scans for over 75 classic and advanced candlestick patterns (bullish, bearish, and neutral), assigning dynamic strength scores (1-10) to each for precise signal filtering. Enhanced with Average True Range (ATR) for volatility-aware body size validation, it dominates the markets by combining timeless pattern recognition with robust confirmation layers. Whether used as a backtestable strategy or visual indicator, it empowers traders to spot high-probability reversals, continuations, and indecision setups with surgical accuracy.
Inspired by Steve Nison's *Japanese Candlestick Charting Techniques*, this tool elevates pattern analysis beyond basics—think Hammers, Engulfing patterns, Morning Stars, and rare gems like Abandoned Baby or Concealing Baby Swallow—all consolidated into intelligent arrays for real-time averaging and prioritization.
**Key Features**
- **Extensive Pattern Library**:
- **Bullish (25+ patterns)**: Hammer (8.0), Bullish Engulfing (10.0), Morning Star (7.0), Three White Soldiers (9.0), Dragonfly Doji (8.0), and more (e.g., Rising Three, Unique Three River Bottom).
- **Bearish (25+ patterns)**: Hanging Man (8.0), Bearish Engulfing (10.0), Evening Star (7.0), Three Black Crows (9.0), Gravestone Doji (8.0), and exotics like Upside Gap Two Crows or Stalled Pattern.
- **Neutral/Indecision (34+ patterns)**: Doji variants (Long-Legged, Four Price), Spinning Tops, Harami Crosses, and multi-bar setups like Upside Tasuki Gap or Advancing Block.
Each pattern includes duration tracking (1-5 bars) and ATR-adjusted body/shadow criteria for relevance in volatile conditions.
- **Smart Confirmation Filters** (All Toggleable):
- **Trend Alignment**: 20-period SMA (customizable) ensures entries align with the prevailing trend; optional higher timeframe (e.g., Daily) MA crossover for multi-timeframe confluence.
- **Support/Resistance (S/R)**: Pivot-based levels with 0.01% tolerance to confirm bounces or breaks.
- **Volume Surge**: 20-period volume MA with 1.5x spike multiplier to validate momentum.
- **ATR Body Sizing**: Filters small bodies (<0.3x ATR) and long bodies (>0.8x ATR) for context-aware pattern reliability.
- **Follow-Through**: Ensures post-pattern confirmation via bullish/bearish closes or closes beyond prior bars.
Minimum average strength (default 7.0) and individual pattern thresholds (5.0) prevent weak signals.
- **Entry & Exit Logic**:
- **Long Entry**: Bullish average strength ≥7.0 (outweighing bearish), uptrend, volume spike, near support, follow-through, and HTF alignment.
- **Short Entry**: Mirror for bearish dominance in downtrends near resistance.
- **Exits**: Bearish/neutral shift, or fixed TP (5%) / SL (2%)—pyramiding disabled, 10% equity sizing.
- Backtest range: Jan 1, 2020 – Dec 31, 2025 (editable). Initial capital: $10,000.
- **Interactive Dashboard** (Top-Right Panel):
Real-time insights including:
- Market phase (e.g., "Bullish Phase (Avg Str: 8.2)"), active pattern (e.g., "BULLISH: Bullish Engulfing (Str: 10.0, Bars: 2)"), and trend status.
- Strength breakdowns (Bull/Bear/Neutral counts & averages).
- Filter status (e.g., "Volume: ✔ Spike", "ATR: Enabled (L:0.8, S:0.3)").
- Backtest stats: Total trades, win rate, streak, and last entry/exit details (price & timestamp).
Toggle mode: Strategy (live trades) or Indicator (signals only).
- **Advanced Alerts** (15+ Toggleable Types):
Set up via TradingView's "Any alert() function call" for bar-close triggers:
- Entry/Exit signals with strength & pattern details.
- Strong patterns (≥2 bullish/bearish), neutral indecision, volume spikes.
- S/R breakouts, HTF reversals, high-confidence singles (≥8.0 strength).
- Conflicting signals, MA crossovers, ATR volatility bursts, multi-bar completions.
Example: "STRONG BULLISH PATTERN detected! Strength: 9.5 | Top Pattern: Three White Soldiers | Trend: Up".
**Customization & Usage Tips**
- **Inputs Groups**: Strategy toggles, confirmations, exits, backtest dates, and 15+ alert switches—all intuitively grouped.
- **Optimization**: Tune min strengths for aggressive (lower) or conservative (higher) trading; enable/disable filters to suit your style (e.g., disable S/R for scalping).
- **Best For**: Forex, stocks, crypto on 1H–Daily charts. Test on historical data to refine TP/SL.
- **Limitations**: No external data installs; relies on built-in TA functions. Patterns are probabilistic—combine with your risk management.
Master the candles like a grandmaster. Deploy on TradingView, backtest relentlessly, and let dominance begin! Questions? Drop a comment.
*Version: 1.0 | Updated: September 2025 | Credits: Built on Pine Script v5 with nods to Nison's timeless techniques.*

Outside the Bollinger Bands Alerting Indicator Overview
The Outside the Bollinger Bands Alerting Indicator is a comprehensive technical analysis tool that combines multiple proven
indicators into a single, powerful system designed to identify high-probability reversal patterns at Bollinger Band extremes. This
indicator goes beyond simple band touches to detect sophisticated pattern formations that often signal strong directional moves.
Key Features & Capabilities
🎯 Advanced Pattern Recognition
Bollinger Band Breakout Patterns
- Detects "pierce-and-reject" formations where price breaks through a Bollinger Band but immediately reverses back inside
- Identifies failed breakouts that often lead to strong moves in the opposite direction
- Combines multiple confirmation signals: engulfing candle patterns, MACD momentum, and ATR volatility filters
- Visual alerts with symbols positioned below (bullish) or above (bearish) candles
Tweezer Top & Bottom Patterns
- Identifies consecutive candles with nearly identical highs (tweezer tops) or lows (tweezer bottoms)
- Requires at least one candle to breach the respective Bollinger Band
- Confirms reversal with directional close requirements
- Customizable tolerance settings for pattern sensitivity
- Visual alerts with ❙❙ symbols for easy identification
📊 Multi-Indicator Integration
Bollinger Bands Indicator
- Dual-band configuration with outer (2.0 std dev) and inner (1.5 std dev) bands that can be adjusted to suit your own parameters
- Configurable MA types: SMA, EMA, SMMA (RMA), WMA, VWMA
- Customizable length, source, and offset parameters
- Color-coded band fills for visual clarity
Moving Average Suite
- EMA 9, 21, 50, and 200 (individually toggleable)
- Special "SMA 3 High" for help visualizing and detecting Bollinger Band break-outs
- Dynamic color coding based on price relationship
Optional Ichimoku Cloud overlay
- Complete Ichimoku implementation with customizable periods
- Dynamic cloud coloring based on trend direction
- Toggleable overlay that doesn't interfere with other indicators
🚨 Comprehensive Alert System
Real-Time JSON Alerts
- Sends structured data on every confirmed bar close
- Includes all indicator values: BB levels, EMAs, MACD, RSI
- Contains signal states and crossover conditions
- Perfect for automated trading systems and webhooks
{"timestamp":1753118700000,"symbol":"ETHUSD","timeframe":"5","price":3773.3,"bollinger_bands":{"upper":3826.95,"basis":3788.32,"lower":3749.68},"emas":{"ema_9":3780.45,"ema_21":3788.92,"ema_50":3800.79,"ema_200":3787.74,"sma_3_high":3789.45},"macd":{"macd":-10.1932,"signal":-11.3266,"histogram":1.1334},"rsi":{"rsi":40.5,"rsi_ma":39.32,"level":"neutral"}}
Specific Alert Conditions
- MACD histogram state changes (rising to falling, falling to rising)
- RSI overbought/oversold crossovers
- All pattern detections (BB Bounce, Tweezer patterns)
- Bollinger Band breakout alerts
🎨 Visual Elements
Pattern Identification
- ♻ symbols for Bollinger Band breakout patterns (green for bullish, red for bearish)
- ❙❙ symbols for tweezer patterns (green below for bottoms, red above for tops)
- Color-coded band fills for trend visualization
Chart Overlay Options
- All moving averages with distinct colors
- Bollinger Bands with inner and outer boundaries
- Optional Ichimoku cloud with trend-based coloring
Trading Applications
Reversal Trading
- Identify high-probability reversal points at extreme price levels
- Use failed breakout patterns for entry signals
- Combine multiple timeframes for enhanced accuracy
Trend Analysis
- Monitor moving average relationships for trend direction
- Use Ichimoku cloud for trend strength assessment
- Track momentum with MACD and RSI integration
Risk Management
- ATR-based volatility filtering reduces false signals
- Multiple confirmation requirements improve signal quality
- Real-time alerts enable prompt decision making
Suggested Use
- Use on multiple timeframes for confluence
- Combine with support/resistance levels for enhanced accuracy
- Set up alerts for hands-free monitoring
- Customize settings based on market volatility and trading style
- Consider volume confirmation for stronger signals
