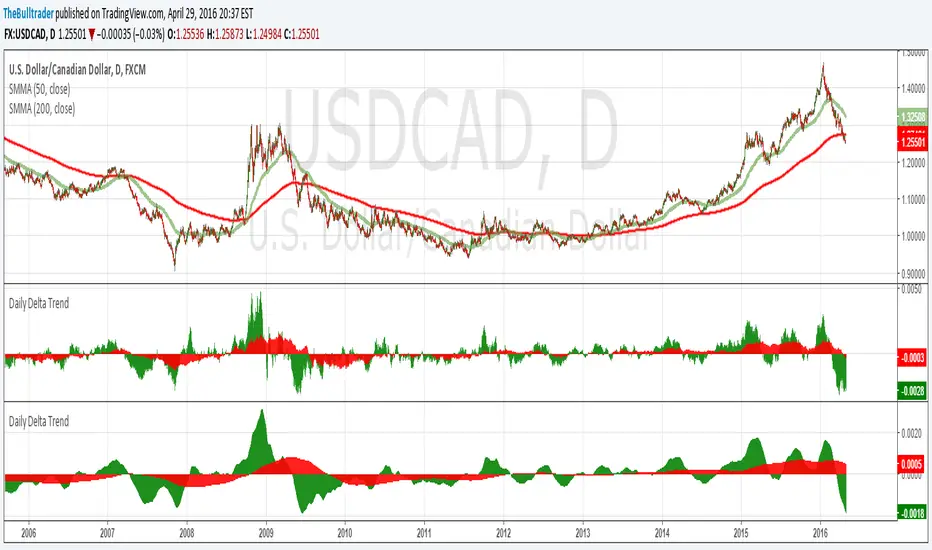
Daily Delta TrendDaily Delta Trend is a useful exponential moving average of the 50 day and 200 day simple moving average. In the first Daily Delta Trend I realized that the simple moving averages were pretty choppy as they were buy then sell over short period of times. So I thought taking an average of another average would smooth my results and give it buy and sell signals more clearly. In chart 1, you can see that it is choppy, and in chart 2 is much smoother.
The way I've been interpreting the chart is to trade it only when the 50-day average (GREEN) Trades with 200-day average (RED). For example, when red and green are both >0 = Buy and both <0 = Sell.
Just from a little of pretesting, I was able to find solid trades from multiple pairs.
DISCLAIMER, I have not actually traded this indicator as I just wrote it for the past few hours, But I thought it was interesting and maybe I might trade it. Feel free to play with it and comment back :P
在腳本中搜尋"daily"
CD_Average Daily Range Zones- highs and lows of the dayUses daily average ranges of 5 and 10 (most used) as buy (support) and highs (resistance) areas - half ranges used in calculations for a more accurate "forecast" of the H and L . Uses open but not close, so it does not repaint - experimental

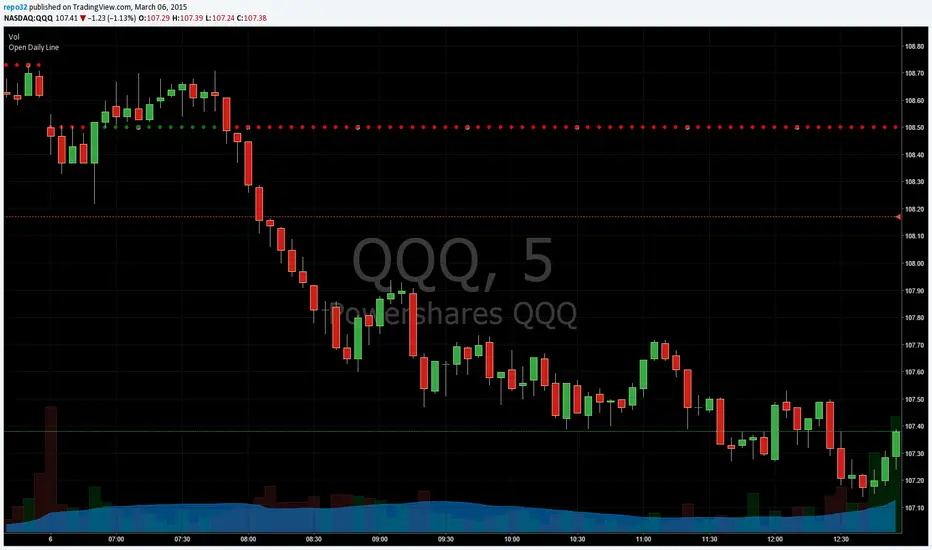
Open Close Daily LineThis will place circles on your chart for the opening daily price. If price is above, the circles are green. If price is below, the circles are red. I wanted to be able to see the opening price a bit easier while in smaller time frames.
I decided to add the previous daily closing line to the original script. Basically looking for good support / resistance

Open Daily LineThis will place circles on your chart for the opening daily price. If price is above, the circles are green. If price is below, the circles are red. I wanted to be able to see the opening price a bit easier while in smaller time frames.
Consecutive Candle CountAdaptation of www.fxcmapps.com from FXCM's Marketscope
Coded by David Rodriguez, Quantitative Strategist for DailyFX.com


Daily Levels ImporterUser Guide: Daily Levels Importer
What This Indicator Does
This tool allows you to instantly draw multiple support and resistance lines on your TradingView chart by pasting a list of data. It avoids the need to manually draw lines one by one. It also features a dashboard to identify the ticker and filters to toggle specific line colors on or off.
1. The Data Format
The indicator reads text in a specific 3-column format (Comma Separated).
Format: \, \, \
* Ticker: The symbol name (used for the dashboard display).
* Price: The price level where the line will be drawn.
* Color Code:
r = Red
g = Green
y = Yellow
Example:
ES, 4150.25, r
ES, 4200.00, g
ES, 4175.50, y
2. How to Use It
3. Copy Your Data: Select your list of levels (from Excel, a text file, or a website) and copy them to your clipboard.
4. Open Settings: On your TradingView chart, hover over the indicator name and click the Settings (Gear Icon).
5. Paste Data:
* Find the "Paste Data Here" text box in the Inputs tab.
* Delete any existing text.
* Paste your new list.
6. Save: Click OK. The lines will instantly render on your chart.
7. Controls & Filters
You can customize the view without deleting data by using the checkboxes in the Settings menu:
* Line Filters:
* Show Red Levels: Uncheck to hide all red lines.
* Show Green Levels: Uncheck to hide all green lines.
* Show Yellow Levels: Uncheck to hide all yellow lines.
* Dashboard Location:
* Use the dropdowns to move the Ticker ID box to any corner of the screen (e.g., Top Right, Bottom Left) or change its size.
8. Troubleshooting
Lines aren't showing up?
* Ensure the prices match the asset you are viewing (e.g., don't paste SPX prices on an AAPL chart).
* Check if you accidentally unchecked the "Show " box in the settings.
"No Data" in Dashboard?
* The script reads the ticker name from the first row of your pasted data. Ensure the first row is not blank.
Is there a limit?
* Yes. TradingView allows approximately 4,000 characters in the text box. This is roughly 250 lines of price levels. If you need more, add a second instance of the indicator to the chart.

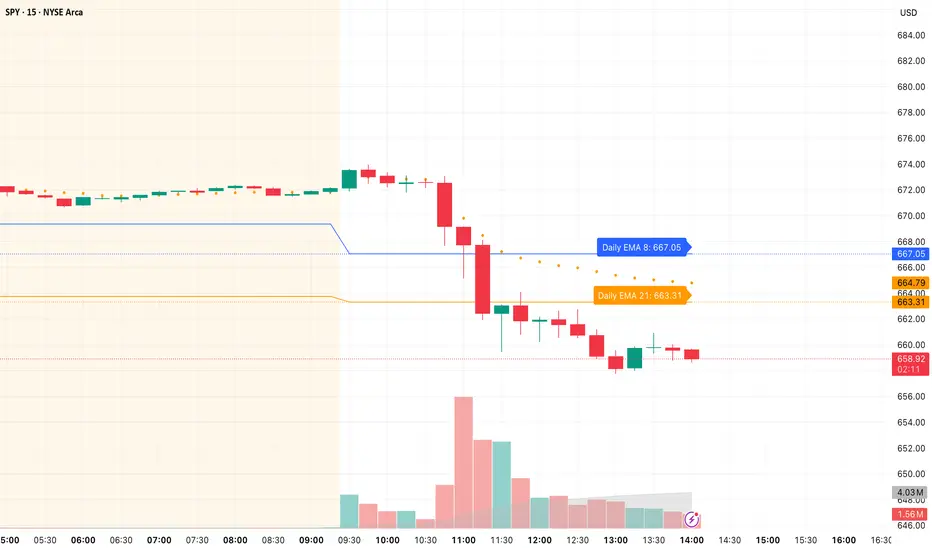
Daily/Weekly EMAs on Lower TimeframesThis indicator allows traders to view Daily and Weekly EMAs (Exponential Moving Averages) directly on lower timeframes such as 1m, 5m, 15m, or 1h charts — providing a higher timeframe perspective without switching charts.
The script includes individual checkboxes for each EMA length — 5, 8, 9, 21, 50, and 200 — organized into two clear sections:
🟢 Daily EMAs
🔵 Weekly EMAs
You can selectively enable or disable any EMA to match your trading style and reduce chart clutter.
Each EMA is color-coded for clarity and consistency:
5 EMA: Green
8 EMA: Blue
9 EMA: Blue
21 EMA: Orange
50 EMA: Purple
200 EMA: Red
Weekly EMAs appear slightly transparent to distinguish them from daily ones.
This makes it easy to visualize higher timeframe trend direction, confluence zones, and dynamic support/resistance levels while trading intraday.
💡 Key Features
View Daily and Weekly EMAs on smaller timeframes.
Individual checkbox toggles for all 6 EMA lengths.
Separate sections for Daily and Weekly EMAs.
Color-coded lines for easy visual recognition.
Works seamlessly on any symbol or timeframe below Daily.
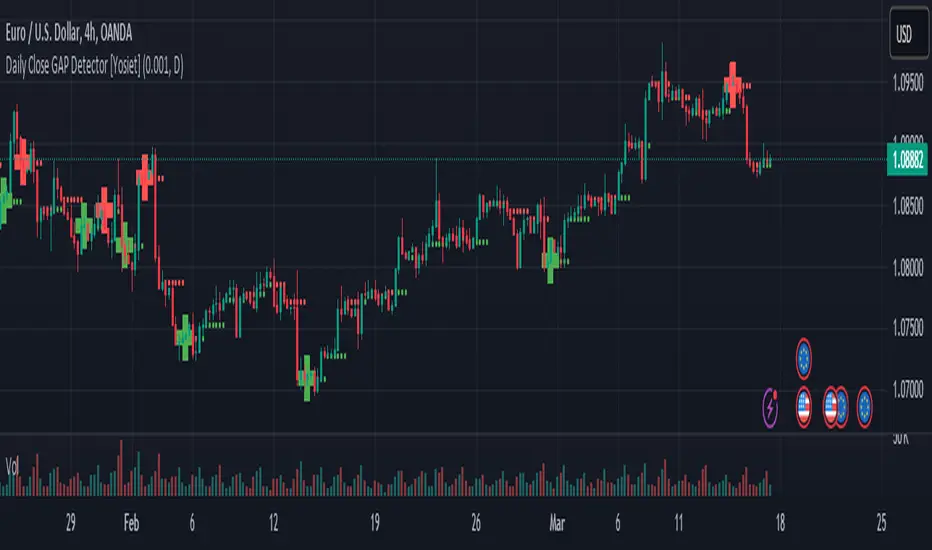
Daily Close GAP Detector [Yosiet]User Manual for "Daily Close GAP Detector "
Overview
This script is designed to help traders identify and react to significant gaps in daily market prices. It plots daily open and close prices and highlights significant gaps with a cross. The script is particularly useful for identifying potential breakouts or reversals based on these gaps.
Configuration
GAP Close Threshold: This input allows you to set a threshold for the gap size that you consider significant. The default value is 0.001.
Timeframe Seeker: This input lets you choose the timeframe for the gap detection. The default is 'D' for daily.
Features
Daily Open and Close Lines: The script plots daily open and close prices. If the close price is lower than the open price, the line is colored red; otherwise, it's green.
Gap Detection: It calculates the difference between the current day's close and the previous day's close, both adjusted for the selected timeframe. If this difference exceeds the threshold, it's considered a significant gap.
Significant Gap Indicator: A cross is plotted on the chart to indicate significant gaps. The color of the cross indicates whether the gap is a short or long gap: red for short gaps and green for long gaps.
Alert Conditions: The script sets up alert conditions for short and long gap breakouts. You can customize the alert messages to include details like the ticker symbol, interval, price, and exchange.
How to Use
Add the Script to Your Chart: Copy the script into the Pine Script editor on TradingView and add it to your chart.
Configure Inputs: Adjust the "GAP Close Threshold" and "Timeframe Seeker" inputs as needed.
Review the Chart: The script will overlay daily open and close prices on your chart, along with crosses indicating significant gaps.
Set Alerts: Use the script's alert conditions to set up alerts for short and long gap breakouts. You can customize the alert messages to suit your trading strategy.
Extending the Code
To extend this script, you can modify the gap detection logic, add more indicators, or integrate it with other scripts for a more comprehensive trading strategy. Remember to test any changes thoroughly before using them in live trading.
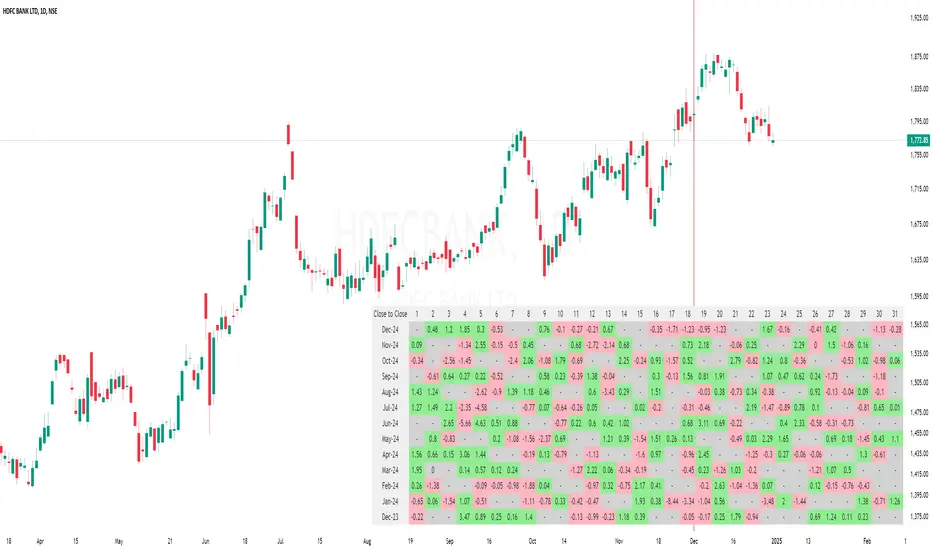
Daily % Change MatrixThe "Daily % Change Matrix" is a powerful tool designed to visualize daily percentage changes in stock prices. This indicator helps traders analyze trends and volatility over time, enabling data-driven decisions.
Features
Change Calculation Options:
Choose between two methods:
Previous Close to Current Close: Calculates the percent change from the previous day's close to the current day's close.
Open to Close: Calculates the percent change from the current day's open to its close.
Customizable Table Display:
Size Options: Choose between Small, Normal, and Large.
Positioning: Place the table in any corner of the chart (Top Left, Top Right, Bottom Left, or Bottom Right).
Color Coding:
Green: Positive changes.
Red: Negative changes.
Grey: No data or negligible changes.
Table Details
Rows: Days of the month (1-31).
Columns: The last 13 months of data.
Dynamic Header: Automatically updates based on the selected calculation method.
Usage
Change your chart timeframe to Daily (D).
Configure the table's size and position via inputs.
Select the preferred calculation method.
Ideal For
Swing Traders: Identify monthly performance trends.
Analysts: Study long-term patterns across months.
Portfolio Managers: Gain insights into market behavior during specific periods.
Notes
Ensure the timeframe is set to Daily.
Use the table options to adjust for personal preference and chart space.
Contact
For any issues or suggestions, reach out to me.
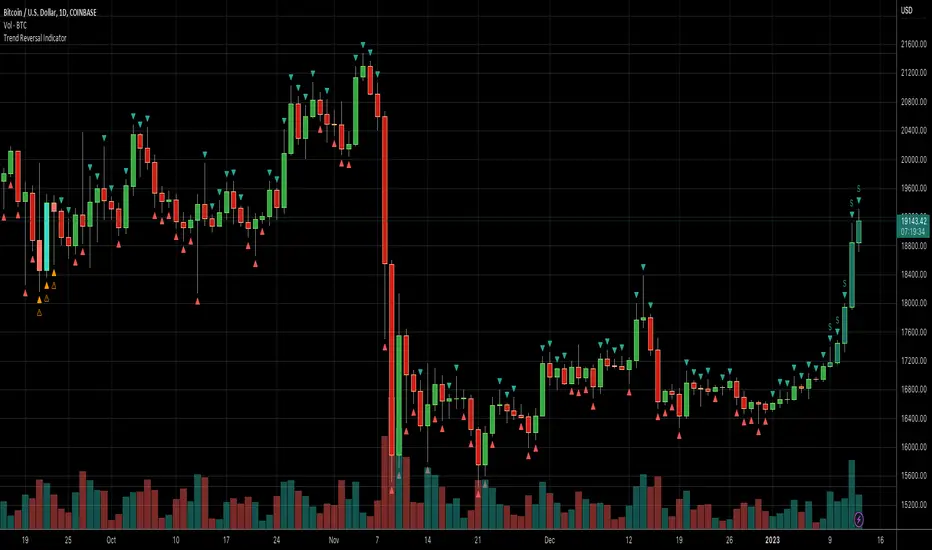
Daily Number/Trend Reversal IndicatorIndicator identifies potential price trend exhaustion.
Compares this period against the 4th prior period for the condition.
9 periods (or more) with the same condition is an indicator that the trend is ending soon.
Daily Session Windows background highlight indicatorIn intraday studies of stock indexes and Forex I have this weird habit of highlighting premarket, core session, lunch break and extended session with different backgrounds. If done by hand, this is tedious work that has to be repeated daily.
I think this feature should be built-in in TradingView. But it isn't.
For a few months now, I have been using this tiny indicator that does precisely that job. It saved me literally hours of focus time and mistakes. I have decided to revamp it and release it. I'm sure it can be useful to others.
Features:
Background color highlighting for premarket , core session , lunch hour and extended session of the trading day.
Session timing preset to match US session, but can be customized.
Can be enabled or disabled on a day of the week basis, including week-end.
Timezone is selectable, matches the chart's instrument but can be set independently to track a different timezone.
Not affected by the timezone you decided to assign to the chat's time scale.
Ready for stock indexes, but can be used to highlight Forex sessions too.

Daily Levels Suite + Market BreadthThere are many levels suites out there but many of them use the line series and/or label series to create multiple levels. Pine v5 provides the capability to use line arrays and labels so I wanted to create some code that is extensible to add additional lines/levels and labels to an array of lines with very little effort.
There is also some Market Breadth info that can be shown in the corners of the chart to allow a user to understand how the broader markets are moving compared to the security they are charting.
Current Levels provided are as follows:
Today's Open
Previous Days Close
Previous Days High/Low
Previous Days 50%
T+2 High/Low
All levels and the market breadth table is configurable to be hidden or shown based upon the user's desire.


Daily O/C Span (Real Values & SMA Comparison)This Pine Script indicator helps you visualize and track the "momentum" or "strength" of each trading day, and compares it to a recent average. It essentially measures the net movement of the price from when the market opens to when it closes.
What the Script Does
The script performs the following actions:
Calculates Daily Movement: For every single trading day, it calculates the difference between the closing price and the opening price (Close - Open).
Plots the "Span": These daily differences are plotted as vertical bars (a histogram) in a separate window below your main price chart.
-Green bars mean the stock closed higher than it opened (a strong day).
-Red bars mean the stock closed lower than it opened (a weak day).
Calculates the Average: It calculates the Simple Moving Average (SMA) of these daily spans over an adjustable period (default is 30 days).
Plots the Average Line: A blue line is plotted over the green/red bars, showing the typical magnitude of daily movement.
Displays Comparison: A table in the top-right corner provides a quick, real-time numerical comparison of today's span versus the 30-day average span.
How It Can Improve Trading
This indicator helps you understand the character and conviction of price action, offering several trading insights:
Gauging Momentum: It clarifies whether the stock's moves are generally strong and sustained within a day (large spans) or hesitant (small spans).
Identifying Trends: During an uptrend, you might expect the average span line to be consistently positive (above zero), and vice versa for a downtrend. A positive average span indicates buyers are consistently closing the day stronger than where they started it.
Spotting Reversals: If a stock is in a strong uptrend but you suddenly see a series of large red bars (large negative spans), it could signal a shift in momentum and potential upcoming reversal.
Volatility Context: By comparing the current day's bar to the blue average line, you can quickly determine if today is an unusually strong/weak day relative to recent history.
In short, it helps you see the underlying buyer/seller conviction within each day, making it easier to gauge the overall market sentiment and anticipate potential shifts.

Daily 9 SMA S/R with Std DevThis indicator plots the Daily 9 Simple Moving Average as dynamic support/resistance on any timeframe, with standard deviation bands to measure trend strength and identify overextended price action.
━━━━━━━━━━━━━━━━━━━━━━
HOW IT WORKS
━━━━━━━━━━━━━━━━━━━━━━
The Daily 9 SMA acts as a key level institutions watch. When price is above it, bullish bias. Below it, bearish bias. Simple.
Standard deviation bands show you:
- 1 StdDev = Strong trend territory
- 2 StdDev = Extreme/overextended - potential reversal zone
━━━━━━━━━━━━━━━━━━━━━━
FEATURES
━━━━━━━━━━━━━━━━━━━━━━
- Daily 9 SMA plotted on any timeframe
- 1 & 2 Standard Deviation bands
- Trend strength scoring (-3 to +3)
- Info table showing current values and trend status
- Visual signals for MA reclaims, losses, and trend entries
━━━━━━━━━━━━━━━━━━━━━━
ALERTS
━━━━━━━━━━━━━━━━━━━━━━
- Price Reclaims Daily 9 SMA
- Price Loses Daily 9 SMA
- Enter Strong Bullish Zone (>1 StdDev)
- Enter Strong Bearish Zone (<1 StdDev)
- Extreme Extension Alerts (2 StdDev)
- Bounce/Rejection at MA
━━━━━━━━━━━━━━━━━━━━━━
HOW TO USE
━━━━━━━━━━━━━━━━━━━━━━
1. Use on lower timeframes (5m, 15m, 1H) to see Daily levels
2. Look for bounces off the Daily 9 SMA for entries
3. Avoid longs when price loses the MA, avoid shorts when price reclaims
4. Use StdDev bands to gauge when price is overextended
━━━━━━━━━━━━━━━━━━━━━━
SETTINGS
━━━━━━━━━━━━━━━━━━━━━━
- MA Length - Default 9
- StdDev Multipliers - Default 1.0 and 2.0
- StdDev Lookback - Default 20
- Customizable colors
Works on any market - Forex, Crypto, Stocks, Futures.

Daily Dollar Cost Averaging (DCA) Simulator & Yearly PerformanceThis indicator simulates a "Daily Dollar Cost Averaging" strategy directly on your chart. Unlike standard backtesters that trade based on signals, this script calculates the performance of a portfolio where a fixed dollar amount is invested every single day, regardless of price action.
Key Features:
Daily Accumulation: Simulates buying a specific dollar amount (e.g., $10) at the market close every day.
Yearly Breakdown Table: A detailed dashboard displayed on the chart that breaks down performance by year. It tracks total invested, average entry price, total holdings, current value, and PnL percentage for each individual year.
Global Stats: The bottom row of the table summarizes the total performance of the entire strategy since the start date.
Breakeven Line: Plots a yellow line on the chart representing your "Global Average Price." When the current price is above this line, the total strategy is in profit.
How to Use:
Add to chart (Works best on the Daily (D) timeframe).
Open settings to adjust your Daily Investment Amount and Start Year.
The table will automatically update to show how a daily investment strategy would have performed over time.

Daily MA Rank LadderThis script plots six daily moving averages on any timeframe and tracks them in a live ladder in the top right of the chart. All moving averages are calculated from the daily close, no matter which timeframe you are looking at.
Included moving averages
• SMA 200 based on daily close
• SMA 100 based on daily close
• SMA 50 based on daily close
• EMA 20 based on daily close
• EMA 10 based on daily close
• EMA 5 based on daily close
The table shows
• Current price and all six daily moving averages
• Levels sorted from high to low so price walks up the ladder as it breaks each average
• A direction column with arrows based on change versus the previous daily value
• Double arrow when the move is at least 5 percent
• Single arrow when the move is smaller than 5 percent
Use it to see at a glance where price sits relative to the 200, 100, 50 SMA and the 20, 10, 5 EMA and how fast each level is moving.

Daily Oversold Swing ScreenerThat script is a **Pine Script Indicator** designed to identify potential **swing trade entry points** on a daily timeframe by looking for stocks that are **oversold** but still in a **healthy long-term uptrend**.
It screens for a high-probability reversal setup by combining four specific technical conditions.
Here is a detailed breakdown of the script's purpose and logic:
---
## 📝 Script Description: Daily Oversold Swing Screener
This Pine Script indicator serves as a **momentum and trend confirmation tool** for active traders seeking short-to-intermediate-term long entries. It uses data calculated on the **Daily** timeframe to generate signals, regardless of the chart resolution you are currently viewing.
The indicator is designed to filter out stocks that are in a strong downtrend ("falling knives") and only signal pullbacks within an established uptrend, which significantly increases the probability of a successful swing trade bounce.
### 🔑 Key Conditions for a Signal:
The indicator generates a buy signal when **all four** of the following conditions are met on the Daily timeframe:
#### 1. Oversold Momentum
* **Condition:** `rsiD < rsiOS` (Daily RSI is below the oversold level, typically **30**).
* **Purpose:** Confirms that the selling pressure has been extreme and the stock is temporarily out of favor, setting up a potential bounce.
#### 2. Momentum Turning Up
* **Condition:** `rsiD > rsiPrev` (Current Daily RSI value is greater than the previous day's Daily RSI value).
* **Purpose:** This is the most crucial filter. It confirms that the momentum has **just started to shift upward**, indicating that the low may be in and the stock is turning away from the oversold region.
#### 3. Established Uptrend (No Falling Knives)
* **Condition:** `sma50 > sma200 and closeD > sma50` (50-day SMA is above the 200-day SMA, AND the current daily close is above the 50-day SMA).
* **Purpose:** This is a **long-term trend filter**. It ensures that the current oversold condition is just a **pullback** within a larger, structurally bullish market (50 > 200), and that the price is still holding above the short-term trend line (Close > 50 SMA). This effectively screens out weak stocks in continuous downtrends.
#### 4. Price at Support (Bollinger Bands)
* **Condition:** `closeD <= lowerBB` (Daily Close is less than or equal to the lower Bollinger Band).
* **Purpose:** Provides a secondary measure of extreme price deviation. When the price touches or breaches the lower band, it suggests a significant move away from the mean (basis), often signaling strong statistical support where price is likely to revert.
### 📌 Summary of Signal
The final signal (`signal`) is triggered only when the market is confirmed to be **in a healthy long-term trend (Condition 3)**, the price is at an **extreme support level (Condition 4)**, the momentum is **oversold (Condition 1)**, and most importantly, the **momentum has begun to reverse (Condition 2)**.

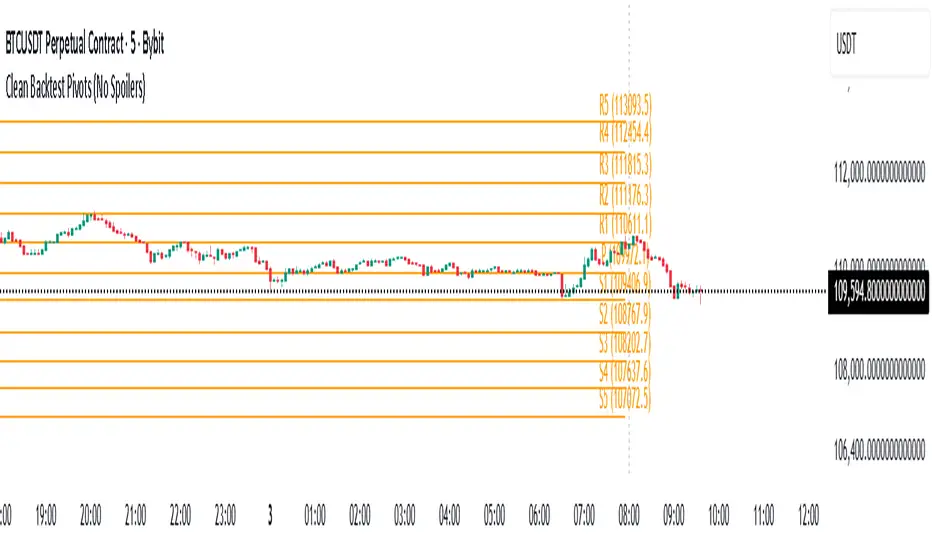
Daily Backtest Pivots Problem with the built-in Pivot Points Standard indicator in backtesting/replay mode:
The default "Pivot Points Standard" indicator is excellent on live charts, but it becomes completely unusable for proper backtesting or bar-replay because it always calculates and displays the current day’s pivot points (P, R1, R2, S1, S2, etc.) using the high/low/close of the still-forming current day — even when you're replaying historical bars.
Example:
When replaying or backtesting September 8 at 08:00 (Asian session), the indicator already shows the final R1, R2, S1, S2 for the entire September 8 daily candle, even though in real trading at that moment you would have no idea where the day will close or what the final daily range will be. This creates massive look-ahead bias and makes any strategy that uses daily pivots impossible to test realistically.
Desired behavior (historical accuracy):
During backtesting or bar replay, the indicator should only plot:
The previous day’s completed pivot levels (which were actually known at the start of the current day)
NO current-day pivot levels at all (or only plot them after the daily candle is closed)
Many custom pivot scripts already do exactly this (they only show the prior day’s levels throughout the current day), which is why people abandon the built-in indicator for backtesting.
Daily POC Lines - Clustered
Overview
This indicator automatically plots horizontal lines at the Point of Control (POC) for each daily candle, intelligently clustering nearby levels to reduce visual noise and highlight the most significant price zones where volume concentration occurred.
What Makes This Original
Unlike standard volume profile indicators that show static profiles for the entire chart, this script:
Calculates individual POC levels for each daily candle within a user-defined lookback period
Implements an intelligent clustering algorithm that merges POC levels within a customizable percentage threshold, preventing chart clutter from redundant lines
Dynamically highlights high-significance clusters (multiple days sharing the same POC level) with customizable visual styling
Provides granular control over line extension, label positioning, and visual appearance
How It Works
The script divides each daily candle's price range into configurable bins (default 20) and distributes the day's volume across these levels to approximate the POC. When multiple days produce POC levels within the specified clustering threshold (default 2%), they merge into a single line with a counter showing how many days share that level.
Key Features
Adjustable lookback period (1-500 candles)
Intelligent clustering with customizable threshold percentage
Separate styling controls for regular POCs vs. high-count clusters
Toggle visibility for lines and labels independently
Configurable line colors, widths, styles (solid/dashed/dotted), and extension
Date labels with cluster count indicators
Adjustable label positioning and offset
Use Cases
Traders can use clustered POC levels to:
Identify key support and resistance zones based on historical volume concentration
Recognize high-significance price levels where multiple days' POCs converge
Reduce chart clutter while maintaining visibility of important volume-based levels
Combine with other technical analysis methods for confluence
Settings
The indicator organizes inputs into four logical groups:
General Settings - Lookback period, cluster threshold, volume bins
Line Settings - Visibility, color, width, style, and extension options
Label Settings - Visibility, position, offset, and color
Cluster Highlights - Threshold and custom styling for high-count clusters
Important Notes
This script uses an approximation method for POC calculation by dividing each candle's range into bins. For maximum accuracy, use on daily timeframe charts. The clustering feature is particularly useful when analyzing longer lookback periods where many POC levels may naturally converge around similar price zones.
Technical Details
Written in Pine Script v5
Maximum 500 lines on chart
Requests daily timeframe data using security function
Uses arrays to store and manage POC data efficiently
Redraws all lines on the last bar for optimal performance

Daily MA — Higher-Timeframe Daily Moving Average OverlayThis indicator plots a clean, higher-timeframe daily moving average directly on any chart, so you can always see where price sits relative to the daily trend — even while trading on lower timeframes (1m, 5m, etc.).
It’s designed to be:
Simple – a single, configurable daily MA line
Consistent – always anchored to the 1D timeframe
Flexible – choose EMA or SMA and customize line width/color
⸻
What This Indicator Does
Pulls the 1-Day (1D) moving average of the current symbol, regardless of your chart timeframe.
Lets you choose between EMA (Exponential Moving Average) or SMA (Simple Moving Average).
Plots that daily MA as a smooth overlay on your current chart.
Keeps the line visually clean and continuous, making it easy to see daily trend and dynamic support/resistance.
This is not a signals/strategy script. It doesn’t generate buy/sell arrows or backtest logic. It’s a context tool for visualizing the daily trend while you execute your own strategy.
⸻
Why a Daily MA Overlay Is Useful
Traders commonly use a daily moving average to:
Anchor intraday trades to the higher-timeframe trend
Longs when price is holding above the Daily MA
Shorts or caution when price is rejecting from the Daily MA
Identify dynamic support/resistance
Price often reacts around well-watched daily MAs (e.g., 50, 100, 200)
Filter setups
Only take long setups when price is above the daily trend line
Avoid counter-trend trades when price is extended far from the Daily MA
Because this script forces the MA to always be computed on 1D, you don’t have to switch back and forth between intraday and daily charts to keep track of the bigger picture.
⸻
Inputs & Settings
MA Length
Default: 200
Any positive integer (min 1)
Common examples: 50, 100, 200 for trend structure
MA Type
EMA – reacts faster to recent price (default)
SMA – smoother, slower, more “classic” feel
Line Width
Default: 2
Range: 1 to 10
Increase if you want the Daily MA to stand out clearly against other indicators
Color
Default: Purple tone
Fully customizable – pick any color that works with your chart theme
⸻
How to Use It in Your Workflow
Intraday traders (scalpers/day-traders):
Apply the indicator to your 1m/5m/15m charts.
Use the Daily MA as a trend filter :
Only look for long scalps when price is above the Daily MA.
Be more cautious with longs or consider shorts when price is below it.
Swing traders :
Use it on 1H/4H charts to see where price sits relative to a longer-term daily trend.
Watch for:
Pullbacks to the Daily MA in an uptrend as potential demand zones.
Rejections at the Daily MA in a downtrend as potential supply zones.
Risk management & context :
Avoid chasing extended moves far from the Daily MA.
Mark confluence with other tools (support/resistance, volume profile, etc.) around the Daily MA.
⸻
Notes & Limitations
The moving average itself is calculated from daily candles , then displayed on your current timeframe.
This is a visual aid only . It does not guarantee future performance or provide financial advice.
Always combine this indicator with your own analysis, risk management, and trading plan.
⸻
Disclaimer :
This script is provided for educational and informational purposes only. It is not financial advice and does not constitute a recommendation to buy or sell any financial instrument. Always do your own research and trade at your own risk.

Daily Pivot Breakout Strategy IndicatorTagline:
A pivot-based breakout system that identifies confirmed daily breakouts with momentum and volume filters, with precise entry timing across all timeframes.
How It Works:
This indicator detects strict pivot high breakouts on daily data, filtered by Rate of Change (ROC ≥30%) and Relative Volume (RVOL >1). It displays both the breakout confirmation signal and the next-day entry signal directly on your chart, regardless of timeframe.
Visual Signals:
Orange Pivot Line: The most recent confirmed pivot high (within 250-day lookback)
Day-0 Label (Teal): Appears on the breakout confirmation day (when price closes above daily pivot with filters met)
Entry Banner (Green): Appears on the next trading day at market open - your actual entry point
Cross-Timeframe Consistency:
Daily Chart: View the big picture - Day-0 on breakout bar, Entry on next bar
Any Timeframe: Logic remains consistent to daily pivots and data, signals adapt to show at the correct time
Built-in Alert Conditions:
5PivotBreakout_Scan (Day-0): Fires when breakout is confirmed. Use this for after-hours scanning to build watchlists of confirmed breakouts
5PivotBreakout_Strategy (Next): Fires at market open the next day. Use this to automate entries on confirmed breakouts
Typical Workflow:
Set up Day-0 alerts on your watchlist to catch breakouts as they happen
Review confirmed breakouts each evening
Set up Entry alerts on selected tickers to automate next-day execution (fires at market open)
Optional: Convert to strategy() for backtesting with custom exits (20% trail is good)
Key Features:
Strict pivot detection: No ties allowed - center must be highest point
Momentum filter: 100-day ROC ensures trending strength
Volume confirmation: 20-day RVOL validates participation
No repainting: Uses lookahead_off for realistic, tradeable signals
Customizable Inputs:
Pivot strength parameters (left/right bars)
Pivot lookback period
ROC period and minimum threshold
RVOL period
Toggle visibility of pivot line and labels
Note: This indicator is for educational purposes only and does not constitute financial advice. Past performance does not guarantee future results. Always test thoroughly before live trading.
