GL Gann Swing IndicatorIntroduction
The GL Gann Swing Indicator is a versatile tool designed to help traders identify market trends, support and resistance areas, and potential reversals. This indicator applies the principles of Gann Swing Charts, a technique developed by W.D. Gann, which focuses on market swings to determine the overall direction and turning points of price action. Gann Swing Charts are a time-tested method of technical analysis that simplifies price action by focusing on significant highs and lows, thereby eliminating market noise and providing a clearer view of the trend.
By analyzing price action and determining swing directions and turning points, the indicator filters out market noise using four distinct bar types:
Up Bar: Higher High, Higher Low
Down Bar: Lower High, Lower Low
Inside Bar: Lower High, Higher Low
Outside Bar: Higher High, Lower Low
This approach helps traders to:
Identify the primary trend direction.
Determine key support and resistance levels.
Recognize potential reversal points.
Filter out minor price fluctuations that do not affect the overall trend.
Features
Bar Types: Display bar types by checking the Show Bar Type box in the indicator's settings. Up bars appear as green upward-pointing triangles, down bars as red downward-pointing triangles, inside bars as grey circles, and outside bars as blue diamonds. These visual aids help traders quickly identify the type of bar and its significance.
Break Lines: These lines highlight when the price rises above a previous swing high or falls below a prior swing low. Green lines indicate breaks of swing highs, while red lines indicate breaks of swing lows. Break lines are enabled by default but can be turned off in the indicator's settings. Break lines provide visual confirmation of trend continuation or reversal.
Bar Count: Bar counts help determine if a swing is overextended and if a reversal is likely. This feature is off by default but can be enabled in the indicator's settings. Users can set a minimum bar count to focus on significant swings. Analyzing the number of bars in a swing can help traders gauge the strength and potential exhaustion of a trend.
Swing MA (Moving Averages): This feature plots the average of a user-defined number of previous swing highs and lows. Options are available to add two moving averages, allowing for both fast and slow averages. Swing MAs can be enabled in the indicator's settings. These moving averages smooth out the price data, making it easier to identify the underlying trend direction.
Why This Indicator is Useful
The GL Gann Swing Indicator is particularly useful for several reasons:
Trend Identification: By focusing on significant price swings, the indicator helps traders identify the primary trend direction, making it easier to align trades with the overall market movement.
Noise Reduction: The indicator filters out minor price fluctuations, allowing traders to focus on meaningful market movements and avoid being misled by short-term volatility.
Support and Resistance Levels: By highlighting key swing highs and lows, the indicator helps traders identify crucial support and resistance levels, which are essential for making informed trading decisions.
Potential Reversals: The indicator's ability to identify overextended swings and potential reversal points can help traders anticipate market turning points and adjust their strategies accordingly.
Customizability: With options to display bar types, break lines, bar counts, and swing moving averages, traders can customize the indicator to suit their specific trading style and preferences.
By incorporating Gann Swing principles, the GL Gann Swing Indicator offers traders a powerful tool to enhance their technical analysis, improve their trading decisions, and ultimately achieve better trading outcomes.
在腳本中搜尋"inside bar"

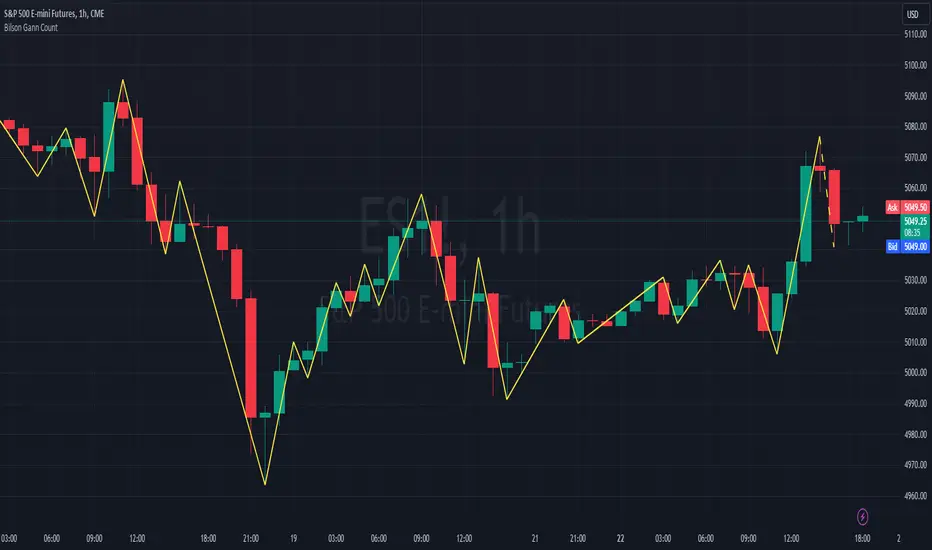
Bilson Gann CountGann counting is a method for identifying swing points,trends, and overall market structure. It simplifies price action by drawing short trend lines that summarize moves.
There's essentially 4 types of bar/candle.
Up bar - Higher high and higher low than previous bar
Down bar - Lower high and lower low than previous bar
Inside bar - Lower high and higher low than previous bar
Outside bar - Higher high and lower low than previous bar
We use these determinations to decide how the trendline moves through the candles.
Up bars we join to the high, down bars we join to the low, inside bars are ignored.
There are other indicators that already exist which do this, the difference here is how we handle outside bars.
Other gann counting methods skip outside bars, this method determines how to handle the outside bar after the outside bar is broken.
examples
UP -> OUTSIDE -> UP = Outside bar treated as swing low
UP -> OUTSIDE -> DOWN = Outside bar treated as swing high
DOWN -> OUTSIDE -> UP = Outside bar treated as swing low
DOWN -> OUTSIDE -> DOWN = Outside bar treated as swing high
LNL Scalper ArrowsLNL Scalper Arrows
The indicator consist of various different types of candlestick patterns that are truly time tested by multiple veteran traders. These arrows are a combination of short-term scalping strategies taught by Linda Raschke & a trader that goes by name Quant Trade Edge. These strategies/patterns occur regularly within the markets. They offer high probability quick moves during the trending days. These four patterns are based on pure price action, no oscillators, no trend, no momentum indicators involved. Trend (ema) is there just as a simple trend gauge.
LNL Scalper Arrows were designed specifically for intra-day trading. Mostly useful for the futures but also stocks as well. These arrows can work anywhere between the fast-moving 512 or 1600 tick charts to a 1min, 2min and up to 5min or 10min charts.
Trend Gauge (Exponential Moving Average)
Nothing fancy just a classic EMA that can guide the direction of the short-term trend. I have added a custom coloring of the EMA that is based on a simple RSI filter. That should help to visualize the non-directional moments within the trend. Although the length is adjustable, for scalping it is better to focus on smaller periods such as 9, 13 or 20 or 34 but anything above 50 loses its purpose as a short-term trend gauge. Again, this is a scalping tool not a trend tool, you are not going to get rid of the fakeouts by increasing the period of the trend.
Tail Arrows (Eat the Tail Pattern)
Tail is a candlestick that is either a price rejection spike, or a flag continuation pattern on a lower time frame. A failed action. It is basically a candle with much bigger wick (shadow) of the candle than the actual body. Such candles are usually telling us about strong participation from the other side of the market. Eat the tail pattern occurs whenever the low of the Tail candle is immediately broken on a following candle "the tail is eaten alive". Such a breaks occurs in a most aggressive types of markets with a strong momentum. DO NOT try to trade this in a low volume or a ranging market. Tail Arrows are the most aggressive arrows & should be only used on the highest volume or a parabolic momentum markets.
Scalp Arrows (Scallop Pattern)
Known as Scallops or minor lows or highs, these patterns are the most common within the all scalper arrows. They occur regularly on 1min & 5min charts - basically everyday. Scallops provide the best possible risk to reward entry within the trend without the need of any indicators or oscillators. The Scallop Up 3 bar pattern consist of a high that is lower that the previous high but also low that is lower than the previous low. Scallop Up or a minor low triggers when the last high is broken, creating a three bar mountain or a peak within the 5 bar span.
Hoagie Arrows (Hoagie Pattern)
Hoagies occur way less often than any other scalping patterns. Hoagies represent two (or more) inside candles within the shadow of a first candle. Such a formation is creating a small compression or a range that sooner or later breaks out. The hoagie is triggered whenever the high or low of the shadow (first) candle is broken. The great thing about the hoagies is that they can work either way despite the trend direction. Although this indicator is coded for the 2 bar hoagies, there are no limitations on how much inside bars can hoagie include.
Umbrella Arrows (Umbrella Pattern)
Another really awesome 3 bar pattern that is really fun to trade. Umbrella occurs when the candle before the previous candle is a pin bar or a tail bar and the body of the previous candle is within the shadow or a wick of the candle before. The umbrella is triggered once the high or low of the previous bar is broken. Umbrellas are more frequent than Hoagies but occur much less than the Scallops.
Outside Bar Wedges (Outside Bar Pattern)
Pretty much self-explanatory candlestick pattern. Outside Bar is basically any bar that peaks outside of the both ends of the previous candle. So the range of the candle is higher & it looked beyond the high and beyond the low of the previous candle. These candles are signalizing the potenial momentum change. Ouside Bars usually occur at the tops or bottoms of the moves. I decided to add them because they can serve as a great addition to these scalping patterns.
Signal vs. SignalBreak Mode
The trigger can be viewed in two different ways:
1. Signal: Plots the trigger before the trigger bar, basically right when the pattern is formed but NOT YET triggered. The signal is triggered once the next candle break the high or low of the current candle.
2. SignalBrake: Plots the trigger after the break of the high or low of the actual pattern. It is basically a candle after the signal candle. (Signal is better for trading because it gives you time to prepare for the actual break of the high or low = the actual signal. SignalBrake is great for looking back in history only for the patterns that actually traded).
Pin Bar BTW Ratio
Pin Bar (Body-To-Wick) Ratio represents the size of the body of a pin bar candle for Eat the Tail and Umbrella patterns. Pin Bar BTW Ratio measures the ratio between the wick & the body of the candle. Ref. interval is 2.0 - 5.0 (ideal pin bar is 2.0 - 3.0 = the wick or a shadow is 2x - 3x bigger than the body of the candle)
ATR Stop & Target Labels
I also created three simple labels (tables) that can show you the ideal target & stop as well as the current ATR. Since LNL Scalper Arrows consist of high probability scalping patterns, a good rule of thumb to follow is to use a half of the current ATR as a target and a current ATR as a stop (or two times the target). So if the current 7 period ATR is 30 the target would be 15 pts. and a stop around 30 pts. With such a risk management you should aim for a win rate 70% or higher. Obviously you can adjust the risk management in the settings to your personal preference.
Low Range vs. High Range Markets
There are two major downsides with the Scalper Arrows:
1. You need volume and a volatility. These patterns really do struggle in ranging "boring" sideways action. It is absolutely crucial to recognize the current market environment and really stay cautions and (or completely out) in case the chop continues. Adding something like DMI can help you recognize the potential flat markets.
2. Not only do you need volume & momentum, you also need a decent range. This indicator works better on a rangy market such as NQ futures or YM. But are much tougher to trade on lower range markets such as some stocks or ZB futures or basically any other lower range market.
Hope it helps.

AIOI By TradeINski# **All IN ONE INDICATOR (AIOI) By TradeInSki**
## Contents
- 4 Moving Average.
- Combined Up and Down.
- Table.
- Inside Bar.
- Bull Snort.
- Indicator Settings Tab.
## **First things first**
- Open settings and read the following to understand better.
- Default Colour settings are best suited for dark theme.
- Default Settings is my personal preference.
- User can change few of the settings according to personal preference in settings option.
- Colour grading Green background means parameter favourable, Red not favourable for trading, “nah” background black means no sufficient data for calculation and background with other colours just for colour grading.
- Indicator should be only seen in D TF as its designed for Swing trading.
### 4 Moving Average
- 4 Different moving averages can be applied to the chart.
- **User Input**
1. Hide or Unhide option.
2. Type - SMA, EMA & WMA.
3. Source - O,H,L,C etc.
4. Period - Default 10,20,50,200.
### Combined Up & Down
- **User Input - In Settings**
1. Check/Uncheck = Combine condition or not?
2. Volume “>=” ____.
3. %Check = ___.
- Explanation - Helps to find how liquid the stock is which in turn helps in position sizing.
- On any specific day stock moved more than 5% plus Number of shares traded is more than 10Lakh .
- If all the above specified condition satisfied then plots blue colour circle below the candle.
### Table Settings
- **User Input - In Settings**
1. Position = .
2. Size = .
3. ADR = - Considers last 20 days average % move/range.
4. 52WK =
1. High/Low - Considers Just High Low Price.
2. Close - Considers Close price only.
5. Average Daily Volume = - Considers last 20 days average volume.
6. ROC = - Considers “Close” price.
7. ROC.P = - W.R.T 10 Days.
8. RVOL = - Considers last 20 days volume.
9. EMA #1, EMA #2, EMA #3 = .
### Table Plotted on Chart - Logic
1. **EMA 10**
1. 10 period Exponential Moving Average.
2. Avoid stock that are above 3%.
3. Select Stocks with Positive or -ve value.
2. **EMA 20**
1. 20 period Exponential Moving Average.
2. Prefer stocks with +ve value.
3. **EMA 50**
1. 50 period Exponential Moving Average.
**Note:** This Shows how much price of the stock is extended from moving averages in terms of percentage.
4. **ADR% - Average Daily Range**
1. Calculates Average % movement for last 20 Days as specified period is 20.
2. ___ < 2% Bad - ___ ≤ 2.5% ok - ___ ≤ 3% good - ___ > 3% best.
5. **52WH - 52 Week High**
1. Shows how far is stock from 52 week high price in % that implies -ve sign.
2. ___ > 75% Very Bad - ___ ≥ 50% bad - ___ ≥ 25% good - ___ ≥ 0% Very good.
6. **52WL - 52 Week Low**
1. Shows how far stock is moved from 52 week low price in percentage terms.
2. Avoid stock with -ve value.
3. Just by value shown can draw inference how much stock has rallied and its buying force.
7. **U/D - Up/Down Ratio**
1. Calculation Default is 20 period - In last 20 days Green day’s average volume divided by Red day average volume is the ratio shown.
2. ___< 1 bad - ___ ≤ 1.5 ok - ___ ≤ 2 good - ___ > 2 best.
8. **ROC - Rate of Change**
1. ROC is not that important can be kept in sidelines.
2. calculates the percentage change between the most recent price and the price registered a certain number of period ago. Default period is 20.
3. Output % shown vary above and below the value zero that is +ve and -ve.
4. Rising is better.
9. **R.VOL - Relative Volume**
1. Calculation - current volume - average volume in percentage terms.
2. Average volume period is 20 thats recent 20 days volume.
3. If current volume is 10K and average volume is 100K then it shows 10% and if current volume is 165K then shows 165%.
4. While scanning stocks RVOL should be less than 100% after entering and for carry forward it should be move than 100%.
5. ___ < 25% best - ___≤ 50% good - ___ ≤ 75% - ___≤ 100% % more look for other factors.10.
10. **T.VOL - Todays Volume**
1. Self Explanatory.
11. **Average Daily Volume 20 - Average daily volume**
1. Calculation is average 20 days volume that is .
2. While scanning T.VOL should be less than Average Daily Volume conditions apply.
3. If candles form + sign then above rule can be ruled out.
12. TURN - Rupee Turnover**
1. Turnover in terms of rupees.
2. Calculation price * Volume.
3. Avoid stocks less than 2.5cr that is 25M higher the better for position sizing and also helps in slippage control.
4. 1M - 10Lakhs, 10M - 1Cr, 100M - 10Cr, 1B - 100Cr.
5. Don’t think shown value is in dollar. No currency conversion needed.
### Inside Bar - I.B
- User input - In Settings
- Look Back Length = .
- That means Inside Bar is plotted in latest 25 candles.
- Explanation - If recent candles OHCL is within previous candle of latest candle then its called Inside bar, name it self say it one inside other.
- Example if todays candle OHLC in daily Time frame is within yesterday’s High and low in daily time frame.
- Logic is Volume dry up ready for expansion.
- If condition satisfied Plots White arrow below the candle.
### Bull Snort
- **User Input - In Settings**
- Position = .
- Label Colour = .
- Style = .
- Size = .
- **Explanation** - This will show you strong Buying Candles . its Called Bull Snort Candles. This Term is invented by US trader Oliver Kell, so all credits to him. In this Indicator You will see Candles which have 3 times volume of its 50 day average volume, so you can say a sudden volume spurt. Stock which are closing in 35 % of its high zone. Latest Close is above previous close.
- If this all 3 conditions are met you will see your preferred sign above candle. That is pink diamond above candle.
### Indicator Settings Tab
- After Opening Settings of the Indicator you will see 3 tab as follows.
1. Inputs.
2. Style.
3. Visibility.
- **Inputs Tab**
- There are 5 subgroups.
- Moving Averages.
- Combined Up & Down.
- Table Settings.
- Inside Bar.
- Bull Snort.
**Input Tab:** All details are mentioned above.
- **Style Tab**
- This is where we can change colour and play with other settings.
- 1, 2, 3, 4 Options are with respect to moving average. And its clearly mentioned MA01 MA02 etc etc.
- 5, 6, 7th Option is With respect to Combine Up & Down.
- Shapes - 5th Option is for plotting only Volume condition.
- Shapes - 6th Option is for plotting only %Check.
- Shapes - 7th Option is for platting if both the condition is satisfied that is Checked/Unchecked.
- 8th And 9th Option is with respect to Inside Bar.
- Shapes - 8th Option for green day.
- Shapes - 9th Option for red day.
- 10th Option - Labels - On/Off - This Plots values on the scale so better to turn it off.
- 11th Option - Tables - On/Off - This Hides or unhides table.
**Note:** OUTPUTS :- Sub group
- Precision - Default.
- Labels on price scale.
- Values in status line.
- **Visibility Tab**
- This tab helps to hide unhide in specific time frame.
- Uncheck Seconds, Minutes And hours so that when to hop to lower time frame automatically indicator hides itself.

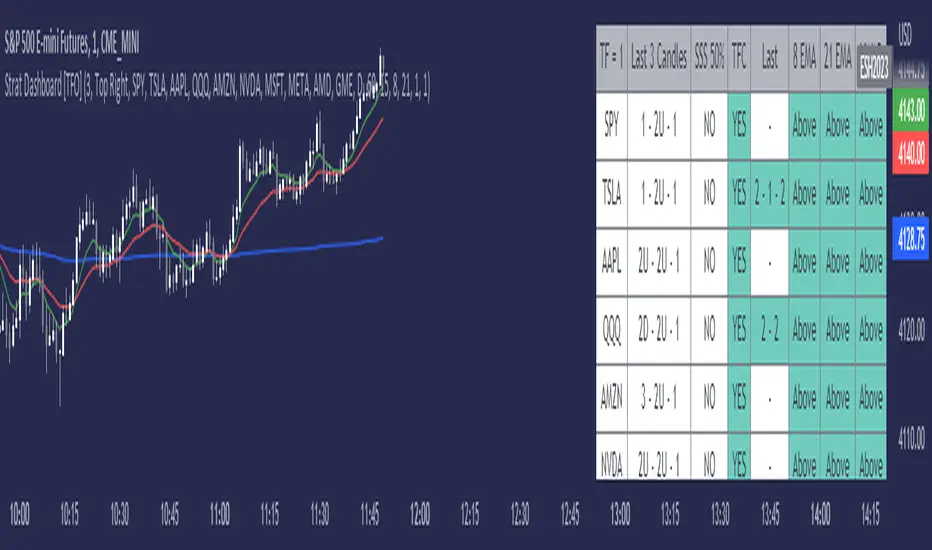
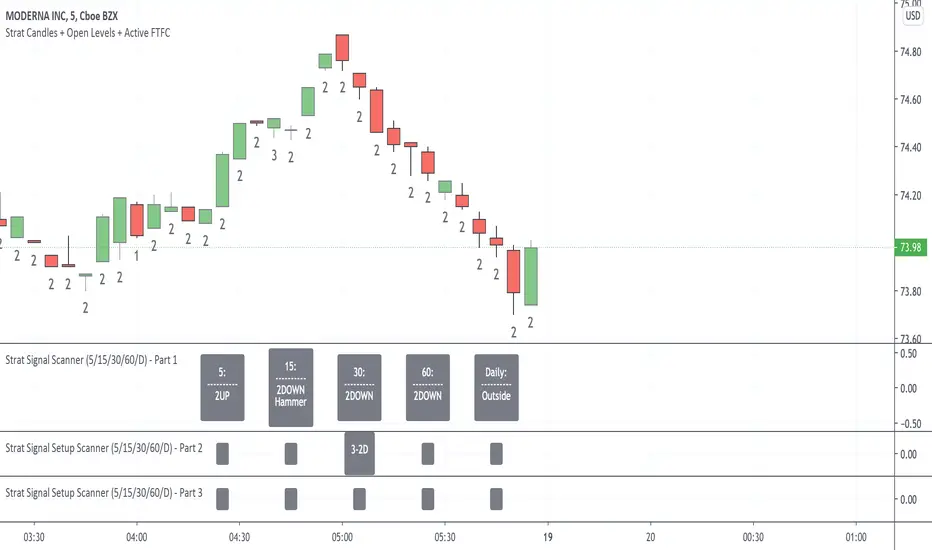
Strat Dashboard [TFO]The Strat Dashboard tracks up to 10 signals while highlighting common strat reversal patterns, the SSS 50% rule, timeframe continuity, and some additional criteria with VWAP and moving averages.
With the strat, all price action bars/candles are simplified into 3 total possibilities: 1 (inside bar), 2 (a bar that takes the previous bar's high OR low), and 3 (outside bar). The first table column for Last X Candles shows the most recent candles according to this notation, for example, 1 - 2D - 2U. This would mean we had an inside bar, followed by a bar that took the previous bar's low, followed then by a bar that took the previous bar's high. Note that the colors in this column are set according to whether the current bar's close exceeds the previous bar's high/low. By default, these colors are green if above the previous bar's highs, or red if below the previous bar's lows. If the current close is in between the previous candle's high and low (even after already taking the prior high or low), no color will be applied.
The SSS 50% column shows a yes or no value for whether the current bar aligns with the SSS 50% rule, where a bar has taken either the previous high or low, and has since reversed to at least the midway point of the previous bar's height - essentially anticipating a 2 that may become a 3 (outside bar).
Timeframe continuity (TFC) shows a yes or no value for when the current candle on multiple timeframes are all green or red (above the open price or below the open price, respectively). For example, if you were looking at the current 15m, 1h, and 1D bars, and they were all above the open price, you could say there's TFC between all three timeframes. As of the initial release, you can select up to 3 different timeframes. The table values will only be true when all selected timeframes are in alignment. When setting alerts, first deselect the timeframes if you don't want TFC logic to impact alerts.
The "Last" column shows the last strat reversal pattern that was confirmed (after the last bar closes). Waiting for a candle close is the safer option since a 2 can turn into a 3; however for higher timeframes, it may be beneficial to make an update to this indicator in which you can have live alerts as well (not waiting for a candle close). You can select which strat reversals you want to be shown from the settings. Various strat reversals may be selected for alerts of type "Any"; for example, if setting up an alert for "Any" strat reversal on Symbol 1, then this alert will go off when any of the *selected* strat reversals occur for that specific symbol. Deselect any strat reversals that you don't want to be included in these alerts.
Lastly, the EMA and VWAP columns simply show whether price is above or below said value. This tracks the current candle close, and may repaint/change several times if the current bar is oscillating above and below these values.
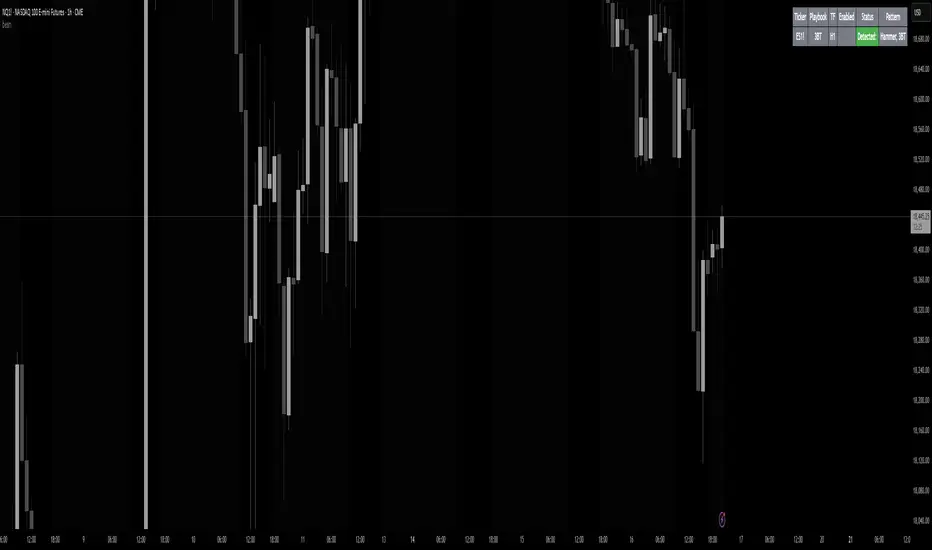
beanBean's Multi-Instrument Pattern Scanner.
This indicator scans H1 timeframe for specific technical patterns. Here's how each pattern is detected:
PATTERN DETECTION CRITERIA:
1. Hammer
- Body Size: ≤ 30% of total candle length
- Lower Wick: > 50% of total candle length
- Upper Wick: < 20% of total candle length
- Formula:
* bodySize = |close - open|
* upperWick = high - max(open, close)
* lowerWick = min(open, close) - low
* totalLength = high - low
2. Shooting Star
- Body Size: ≤ 30% of total candle length
- Upper Wick: > 50% of total candle length
- Lower Wick: < 20% of total candle length
- Uses same measurements as Hammer but inverted
3. Outside/Inside (OI)
Checks three consecutive bars:
- Outside Bar: Bar2 high ≥ Bar3 high AND Bar2 low ≤ Bar3 low
- Inside Bar: Bar1 high ≤ Bar2 high AND Bar1 low ≥ Bar2 low
Pattern confirms when both conditions are met
4. Bullish/Bearish Umbrella
Checks two consecutive bars:
Bullish:
- Current bar's high ≤ previous bar's high
- Current body high ≤ previous bar's high
- Current body low ≥ previous body high
Bearish:
- Current bar's low ≥ previous bar's low
- Current body low ≥ previous bar's low
- Current body high ≤ previous body low
5. Three Bar Triangle (3BT)
Checks three consecutive bars:
- Current bar's high ≤ max(previous two highs)
- Current bar's low ≥ min(previous two lows)
- Indicates price compression
DISPLAY AND ALERTS:
- Patterns are displayed in real-time in the table
- Multiple patterns can be detected simultaneously
- Pattern detection resets each new H1 candle
CONFIGURATION:
- Each row can be independently configured
- Patterns are checked on H1 timeframe close
- Alert frequency: Once per H1 bar close
Note: All measurements use standard OHLC values from only completed H1 candles.
BoQWhat kind of traders/investors are we?
We are trend followers, always on the lookout for the next big move in the market. Our scripts are meticulously crafted for higher timeframes (daily, weekly, monthly) aiming to capture the large market trends.
What does this script do?
Breakout and pullback signals are pivotal for identifying and entering into long-term trends. However, not all signal bars are created equal. The BoQ script is your lens to differentiate between a strong signal and a weak one. When a breakout above our specific Donchian setting occurs, the BoQ steps in to qualify the strength of this breakout, guiding investors and traders on whether to take the signal or not. The beauty of the tool is that the logic can be reversed. Weak breakout signals can be identified as strong pullback signals, allowing early pullback entries into a trend at critical levels of support/resistance.
How is the BoQ produced?
The BoQ is produced by evaluating the closing price in relation to the signal candle's high or low.
For a bullish breakout signal, if the close is nestled within the top range of the bar, the BoQ histogram displays a green bar for that day, signifying a robust breakout candle.
Conversely, for a bearish breakout signal, a close in the bottom range of the bar will result in a red bar on the BoQ histogram, indicating a strong bearish breakout.
Any candle that closes between the bottom and top range is represented by a grey bar on the histogram, marking it as a weak breakout.
A grey histogram bar doubles up as a pullback signal to identify reversals and the end of trends
A grey histogram bar identifies inside bars, which can be used to identify aggressive pullback entries at major levels of support/resistance.
A red histogram bar can be used to identify conservative pullback entries at major resistance levels.
A green histogram bar can be used to identify conservative pullback entries at major support levels.
What is the best timeframe to use the script?
The BoQ is designed for the daily timeframe where breakout and pullback signals demonstrate their reliability. Traders and investors can align themselves with entries into the long-term trend, sidestepping the noise of shorter timeframes.
What makes this script unique?
The BoQ has multiple uses. The script stands out by offering investors a quick and intuitive way to gauge the strength of breakout and pullback bars. Traders and investors no longer need to squint at data windows or closely inspect charts.
With the BoQ's colour-coded histogram bars conveniently displayed as a subchart, determining a breakout or pullback bar's strength becomes straightforward.
By filtering out weak breakouts, the BoQ ensures investors and traders can filter out and enter high-probability breakout signals.
Weak breakout signals highlight strong pullback signals, allowing traders/investors to apply the right strategy for the right market structure.
The BoQ can be used to identify the trend's momentum as:
A repeated green BoQ histogram confirms a strong bull trend in play.
A repeated red BoQ histogram confirms a strong bearish trend in play.
The BoQ can also be applied to bars at the peaks of trends to identify:
Potential reversal points when the BoQ switches from red/green to grey.
Pullbacks/market reversals when the opposite colour repeatedly appears. For example, green to grey to red means a bull-to-bear reversal and vice versa.
The BoQ can also be applied to the range of a bar compared to the previous bar to identify:
Inside bars at support/resistance levels.
Pullback entry points at critical support/resistance levels.

FVG HTF# FVG HTF — Higher‑Timeframe Fair Value Gaps
## Summary
- Plots higher‑timeframe Fair Value Gap (FVG) zones directly on your current chart.
- Tracks fill progress using four methods: Any Touch, Midpoint Reached, Wick Sweep, Body Beyond.
- Shows optional labels with timeframe source and live fill percentage; label text color is configurable.
- Designed for clean overlays and efficient rendering with limits on graphics and bars processed.
## What It Does
- Detects bullish and bearish FVGs from a chosen timeframe (or the chart timeframe) and renders:
- Zone Top/Bottom lines and a dotted midpoint line
- Semi‑transparent area fill between the edges
- Optional label at the midpoint with a tooltip showing zone prices
- Continuously updates zones forward and removes them when the selected fill condition is met.
## Inputs
- `Enable FVG` (`fvgSH2`): Toggle detection/plotting on/off.
- `Timeframe` (`fvgTF2`): Choose `Chart` or HTFs (`5 Minutes`, `15 Minutes`, `1 Hour`, `4 Hours`, `1 Day`, `1 Week`, `1 Month`).
- `Fill Method` (`fvgFill2`):
- Any Touch — wick or body touches any part of the zone
- Midpoint Reached — price reaches at least the 50% of the zone
- Wick Sweep — wick fully travels past the far edge and back inside (conceptually stricter than touch)
- Body Beyond — candle body closes beyond the opposite edge (strong confirmation)
- `Zones` colors (`fvgCb2`, `fvgCs2`): Bullish/Bearish zone colors.
- `Labels` (`fvgLB2`): Show/Hide on‑chart labels.
- `Label Color` (`fvgLBc2`): Color picker for label text (default: white).
- `Max Bars Back` (`maxBars2`): Limits processing to recent bars for performance.
## Timeframe Rules
- The helper `htfTF` prevents selecting a timeframe lower than the chart. If an invalid lower TF is chosen, it falls back to `timeframe.period`.
- Supports minute, daily, weekly, and monthly aggregations that are safe for intraday/daily/weekly charts.
## Detection Logic
- Uses rolling higher‑timeframe bars constructed on the fly and checks 3‑bar displacement patterns:
- Bullish FVG: current HTF low above the high two bars ago AND previous HTF close above that high, with no direct gap condition.
- Bearish FVG: current HTF high below the low two bars ago AND previous HTF close below that low, with no direct gap condition.
- On detection, the script creates an FVG object with:
- Top/Bottom lines (`lnTop`, `lnBtm`) and midpoint line (`lnAvg`)
- Midpoint label (`lbTxt`) showing source timeframe and updating fill percentage
- Semi‑transparent fill (`linefill`) for visual clarity
## Fill Tracking
- Fill threshold depends on selected method:
- Any Touch: opposite edge
- Midpoint Reached: zone’s midpoint
- Wick Sweep: stricter condition conceptually (implemented as an opposite‑edge threshold)
- Body Beyond: requires close beyond the opposite edge
- Each bar updates label x‑position and line endpoints forward; the label text shows the best fill ratio achieved.
- When the threshold is reached, the FVG (label, lines, fill) is removed from the chart.
## Best Practices
- Start with `Any Touch` to visualize broad repairs; switch to `Body Beyond` for conservative confirmations.
- Use `1 Hour` or `4 Hours` overlays on 5m–15m charts for context; `1 Day` on 1H charts; `1 Week` on daily charts.
- Keep labels on when monitoring fills intraday; hide labels for clean higher‑level context.
- Adjust `Max Bars Back` if performance is impacted by many zones.
## Repainting Notes
- HTF zones are computed on `timeframe.change(tf)` and therefore confirm on HTF bar closes.
- Label endpoints extend each bar; detection itself avoids lookahead bias. For strict confirmation, align entries with HTF closes.
## Limitations
- “Wick Sweep” is treated as a stricter touch to the far edge; it does not enforce a separate “return inside” bar state.
- Label text color applies uniformly to bull/bear labels. If you need separate colors per side, contact the author.
## Credits & Version
- Pine Script v6; © rithsilanew2020
## Quick Start
1. Enable FVG and choose your HTF (e.g., `1 Hour`).
2. Pick a Fill Method (start with `Any Touch`).
3. Select zone colors and label text color.
4. Set `Max Bars Back` as needed for performance.
5. Use labels/tooltip values (Top/Mid/Bottom) to plan entries and manage risk.

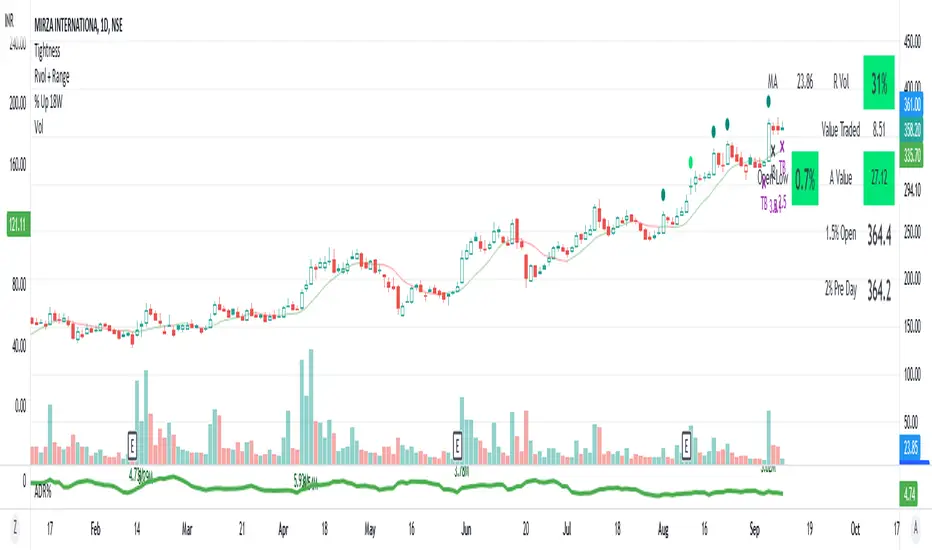
AS - Tightness4% up - stocks up 4% and close is in top 75% of days range
4.5% up - stocks up 4.5% and close is not in top 75% of days range
4% down - stocks down 4%
TB D - Inside Bar with days range of less than 2.5%
IB D - Inside Bar Daily
Rev D - lowest in 5 days and close in top 60% of days range
TB W - Inside Bar with days range of less than 6%
IB W - Inside Bar Weekly
3WTC - 3 Week Tight Close
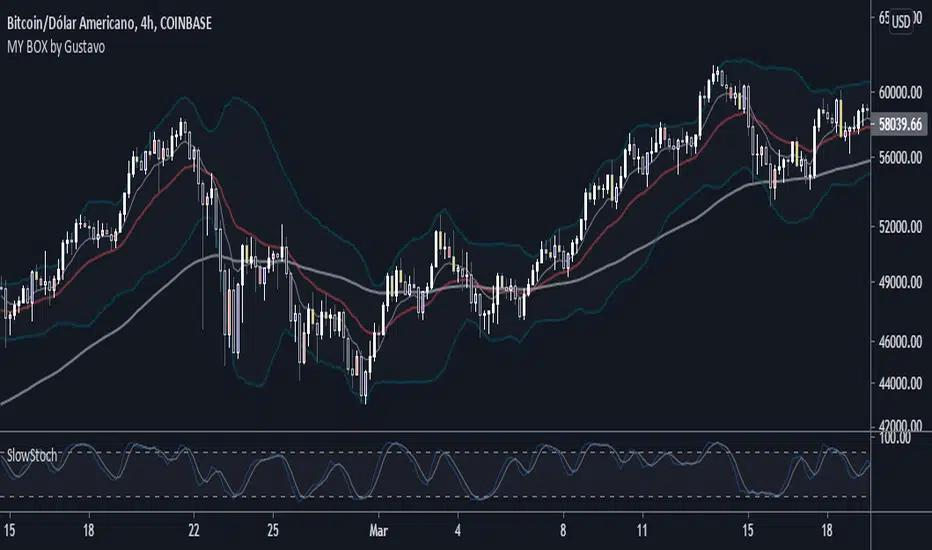
MY BOX by GustavoThis box contains two strategies, several moving averages and Bollinger Bands.
PFR or "Reversal closing price" is a simple and effective strategy, widespread by the Brazilian trader Stormer.
The purpose is to make the candles generate the input signal more clearly.
Description:
When the sales PFR candle appears colored, watch out for the next candle. If he breaks the closing of the PFR sell candle, SALE!
Your stop should be at the maximum of the PFR candle and your target projected at 1.618 in the fibonacci extension.
When the buy PFR candle appears colored, watch out for the next candle. If it breaks the closing of the buy PFR candle, BUY!
Your stop should be at the low of the PFR candle and your target projected at 1.618 in the fibonacci extension.
Inside Bar: The candle has its maximum less than the maximum of the previous candle and its minimum greater than the minimum of the previous candle.
Settings:
You can edit the colors in the indicator settings and select the measurements you want to use.
You can also choose to use the Stocastico Lento filter on over-purchase and over-sale.
You can also activate the Inside bar, it will appear in red on the graph.
There is also the possibility to activate in the settings, the Bollinger Bands.
--------------------------
Este box contém duas estratégias, diversas médias móveis e Bandas de Bollinger.
PFR ou "Preço de fechamento de reversão" é uma estratégia simples e eficaz, bastante difundida pelo trader brasileiro Stormer.
O intuito é tornar os candles de geram o sinal de entrada mais claro.
Descrição:
Quando o candle PFR de venda aparecer colorido, fique atento ao próximo candle. Se ele romper o fechamento do candle PFR de venda, VENDA!
Seu stop deverá ser na maxima do candle PFR e seu alvo projetado em 1,618 na extenção de fibonacci.
Quando o candle PFR de compra aparecer colorido, fique atento ao próximo candle. Se ele romper o fechamento do candle PFR de compra, COMPRE!
Seu stop deverá ser na mínima do candle PFR e seu alvo projetado em 1,618 na extenção de fibonacci.
Inside Bar: O candle tem sua máxima menor que a máxima do candle anterior e sua mínima maior que a minima do candle anterior.
Configuração:
Você pode editar as cores nas configurações do indicador e selecione as medias que deseja usar.
Também pode escolher usar o filtro do Stocastico Lento em sobre compra e sobre venda.
Você também pode ativar o Inside bar, ele aparecerá em vermelho no gráfico.
Há também a possibilidade de ativar nas configurações, as Bandas de bollinger.
3LL+Baby & 3HH+Baby Pattern3LL+Baby & 3HH+Baby Pattern Indicator
Overview
This indicator identifies powerful reversal patterns based on momentum exhaustion and inside bar formations. It detects two specific candlestick patterns that signal potential trend reversals: the bullish 3LL+Baby and the bearish 3HH+Baby.
Pattern Descriptions
📈 3LL+Baby Pattern (Bullish Reversal)
Conditions:
Three consecutive candles form lower lows (each low is lower than the previous)
The fourth candle is bullish/green (closes higher than it opens)
The fourth candle is completely contained within the third candle's range (both high and low)
Interpretation: After a downward momentum with three lower lows, a bullish inside bar (baby candle) suggests sellers are exhausted and buyers may be taking control. This pattern often precedes upward reversals.
📉 3HH+Baby Pattern (Bearish Reversal)
Conditions:
Three consecutive candles form higher highs (each high is higher than the previous)
The fourth candle is bearish/red (closes lower than it opens)
The fourth candle is completely contained within the third candle's range (both high and low)
Interpretation: After upward momentum with three higher highs, a bearish inside bar indicates buyers are losing strength and sellers may be gaining control. This pattern often signals potential downward reversals.
Features
Visual Signals
Green Triangle (↑): Appears below bars when 3LL+Baby pattern is detected
Red Triangle (↓): Appears above bars when 3HH+Baby pattern is detected
Labels: Clear text labels identifying each pattern type
Background Highlighting: Subtle background colors (green for bullish, red for bearish)
Customization Options
Toggle labels on/off
Toggle arrow signals on/off
Enable/disable bullish patterns independently
Enable/disable bearish patterns independently
How to Use
Add to Chart: Apply the indicator to any timeframe and instrument
Configure Settings: Adjust visibility options based on your preference
Set Alerts: Create alerts for immediate pattern notifications
Trading Strategy:
3LL+Baby : Consider long positions or closing shorts
3HH+Baby: Consider short positions or closing longs
Always confirm with additional analysis and risk management
Best Practices
Use in conjunction with support/resistance levels
Combine with volume analysis for confirmation
Works on all timeframes (higher timeframes generally more reliable)
Apply proper risk management and stop-loss orders
Consider the broader market context and trend

STRAT - MTF Dashboard + FTFC + Reversals v2.7# STRAT Indicator - Complete Description
## Overview
A comprehensive multi-timeframe STRAT trading system indicator that combines market structure analysis, flip levels, Full Timeframe Continuity (FTFC), and reversal pattern detection across 12 timeframes.
## Core Features
### 1. **Multi-Timeframe STRAT Dashboard**
- Displays STRAT combos (1, 2u, 2d, 3) across 12 timeframes: 1m, 5m, 15m, 30m, 1H, 4H, 12H, Daily, Weekly, Monthly, Quarterly, Yearly
- Color-coded directional bias (green/red/doji)
- Inside bars (●) and Outside bars (●) highlighted
- Current timeframe marked with ★
### 2. **HTF Flip Levels with Smart Grouping**
- Displays higher timeframe (HTF) flip levels (open prices) as labels on the right side
- Automatically groups multiple timeframes at the same price level (e.g., "★ 1H/4H/D")
- Current timeframe flip level always displayed with ★ marker
- Color-coded: Green (above price) / Red (below price)
### 3. **Full Timeframe Continuity (FTFC)**
- User-selectable 4 timeframes for FTFC analysis (default: D, W, M, Q)
- Green line: FTFC Up (highest open of 4 timeframes)
- Red line: FTFC Down (lowest open of 4 timeframes)
- Identifies when price is above/below all 4 timeframe opens
### 4. **Hammer & Shooting Star Detection**
- **Hammer Pattern**: Long lower wick (≥2x body), small upper wick, signals potential bottom reversal
- **Shooting Star Pattern**: Long upper wick (≥2x body), small lower wick, signals potential top reversal
- Scans last 100 bars (adjustable) and marks ALL historical patterns
- Chart markers: 🔨 (Hammer) below bars, 🔻 (Shooting Star) above bars
- Dashboard column shows reversal patterns for each timeframe
- Adjustable wick-to-body ratio sensitivity (1.5 to 5.0)
### 5. **Debug Tables**
- **FTFC Debug**: Shows close vs. 4 timeframe opens, confirms all-green/all-red conditions
- **Reversal Debug**: Real-time analysis of current bar - body size, wick measurements, ratios, and pattern qualification
## Settings
### Display Settings
- Dashboard position (9 options: top-left to bottom-right)
- Dashboard text size (tiny to huge)
- Label offset and text size
- Toggle individual features on/off
### FTFC Settings
- Select 4 custom timeframes for continuity analysis
- Default: Daily, Weekly, Monthly, Quarterly
### Reversal Settings
- **Wick to Body Ratio**: Sensitivity for pattern detection (default 2.0)
- **Lookback Bars**: How many historical bars to scan (default 100, max 500)
- Show/hide reversal markers on chart
- Show/hide reversal debug table
## Use Cases
1. **Momentum Trading**: Identify STRAT setups (2-2, 2-1-2 reversals, 3-bar plays) across multiple timeframes
2. **Swing Trading**: Use HTF flip levels as support/resistance and FTFC for trend confirmation
3. **Reversal Trading**: Catch hammer/shooting star patterns at key levels for counter-trend entries
4. **Multi-Timeframe Analysis**: Confirm alignment across timeframes before entering trades
## How to Use
### For STRAT Traders
- Look for 2-1-2 reversal setups in the dashboard
- Watch for inside bars (●) at HTF flip levels for breakout trades
- Use outside bars (●) to identify potential volatility expansion
### For Reversal Traders
- 🔨 Hammers after downtrends = potential long entries
- 🔻 Shooting stars after uptrends = potential short entries
- Combine with HTF flip levels for high-probability setups
### For Trend Followers
- FTFC green line above = bullish structure
- FTFC red line below = bearish structure
- Enter when price breaks and holds above/below FTFC levels
## Visual Elements
- **Green Labels**: HTF flip levels above current price (resistance)
- **Red Labels**: HTF flip levels below current price (support)
- **Lime Line**: FTFC Up (highest timeframe open)
- **Red Line**: FTFC Down (lowest timeframe open)
- **🔨 Icon**: Hammer pattern (potential reversal up)
- **🔻 Icon**: Shooting Star pattern (potential reversal down)
- **★ Symbol**: Current timeframe or multiple timeframes grouped
## Performance Notes
This indicator performs 12 multi-timeframe security calls and may take 15-30 seconds to calculate on initial load. This is normal for comprehensive MTF analysis.
## Version
v2.7 - Simplified reversal detection, current TF labeling, optimized performance
---
**Perfect for**: STRAT traders, multi-timeframe analysts, reversal pattern traders, swing traders looking for high-probability setups with confluence across timeframes.

Price Action - Inside/Outside BarsThis indicator highlights Inside and Outside bars based on Al Brooks' price action philosophy from "Reading Price Charts Bar by Bar." Inside bars (high ≤ previous high and low ≥ previous low) represent contraction and potential breakouts, often leading to two-legged moves. Outside bars (high > previous high and low < previous low with min body 50%) signal volatility and possible reversals or trends. Customizable highlights, lines, and labels help identify high-probability setups in trends or ranges. Always focus on context—buy low, sell high, and wait for confirmation.

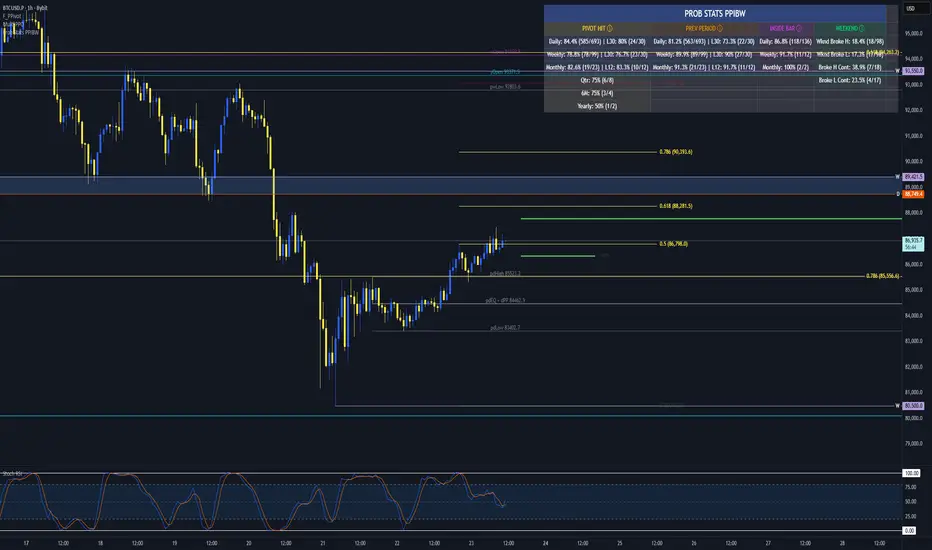
Prob Stats PPIBW Prob Stats PPIBW - Data-Driven Trading Decisions
Transform historical price patterns into actionable probabilities. This indicator analyzes thousands of periods to show you the real odds behind pivot hits, range
expansions, inside bars, and weekend breakouts.
What It Tracks
Pivot Hit Rates (D/W/M/Q/6M/Y)
What percentage of pivot points get touched during their period? Includes recent period comparison to spot regime changes.
Example: "Daily: 82.3% (450/547) | L30: 76.7% (23/30)"
Previous Period Levels (D/W/M)
How often does current period break previous period's high or low? Only counts actual range expansion, not equilibrium crossings. Helps gauge breakout probability.
Inside Bar Analysis (D/W/M)
When price consolidates inside previous period's range, what are the odds of a breakout? Only appears when currently in an inside bar.
Weekend Breakdown
When Sat/Sun breaks Mon-Fri range, does the following week continue? Critical for crypto traders and weekend gap analysis.
Key Features
- Recent Period Comparison: See if recent behavior differs from historical averages
- Self-Documenting: Hover over any header for instant explanations
- Color-Coded Sections: Yellow (Pivots), Orange (Prev Period), Pink (Inside Bar), Green (Weekend)
- Blue Background: Recent stats highlighted for easy identification
- Dynamic Layout: Adapts based on market conditions
- Real-Time Updates: Includes current period for live probability tracking
How To Use
1. Add to any chart (best on Daily+ for maximum historical data)
2. Hover over column headers to understand each statistic
3. Compare historical vs recent probabilities
4. Use probabilities to inform position sizing and expectations
Example: Weekly pivot shows 78% historical hit rate but only 60% in last 30 weeks. Recent regime change suggests lower probability of test.
Technical Details
- Pine Script v6
- Rolling window arrays track last 30/30/12 periods for D/W/M
- Previous Period excludes EQ crossings for accurate stats
- Works on all timeframes, optimized for Daily+
- Configurable table position
Perfect For
Traders seeking data-driven confirmation, those wanting to quantify probability vs guessing, regime change detection, and crypto traders analyzing weekend patterns.
Note: Past performance doesn't guarantee future results. Use these statistics as one input in your overall trading strategy.
Candy Bars v1.0
Candy Bars v1.0 – Swing Reversal Indicator
Candy Bars v1.0 is a proprietary swing reversal indicator designed to highlight potential turning points in the market with precision. Utilizing a combination of price action dynamics and directional movement analysis, this tool identifies key bar structures and momentum shifts to help traders visualize potential trend reversals.
Key Features:
Swing Reversal Detection: Highlights areas where momentum may be shifting, indicating possible trade opportunities.
Custom Bar Coloring: Paints specific bars based on internally calculated conditions to make key signals visually intuitive.
Inside & Outside Bar Analysis: Differentiates inside bars, which suggest potential continuation or breakout setups, and outside bars, which may indicate strong reversals.
Dynamic Labeling: Displays contextual market information, such as relative bar ranges and swing count data.
Divergence-Based Filtering: Detects instances where underlying momentum and price action may be misaligned, signaling potential reversals.
No Repainting: Signals remain fixed once a bar closes, ensuring reliability in real-time trading scenarios.
Candy Bars v1.0 is an advanced trading tool designed for traders looking to enhance their ability to spot high-probability reversal points with clarity and confidence.

The Strat [LuxAlgo]The Strat indicator is a full toolkit regarding most of the concepts within "The Strat" methodology with features such as candle numbering, pivot machine gun (PMG) highlighting, custom combo highlighting, and various statistics included.
Alerts are also included for the detection of specific candle numbers, custom combos, and PMGs.
🔶 SETTINGS
Show Numbers on Chart: Shows candle numbering on the chart.
Style Candles: Style candles based on the detected number. Only effective on non-line charts and if the script is brought to the front.
🔹 Custom Combo Search
Combo: User defined combo to be searched by the script. Combos can be composed of any series of numbers including (1, 2, -2, 3), e.g : 2-21. No spaces or other characters should be used.
🔹 Pivot Machine Gun
Show Labels: Highlight detected PMGs with a label.
Min Sequence Length: Minimum sequence length of consecutive higher lows/lower highs required to detect a PMG.
Min Breaks: Minimum amount of broken previous highs/lows required to detect a PMG.
Show Levels: Show levels of the broken highs/lows.
🔹 Pivot Combos
Pivot Lookback: Lookback period used for detecting pivot points.
Right Bars Scan: Number of bars scanned to the right side of a detected pivot.
Left Bars Scan: Number of bars scanned to the left side of a detected pivot.
🔹 Dashboard
Show Dashboard: Displays statistics dashboard on chart.
Numbers Counter: Displays the numbers counter section on the dashboard.
Pivot Combos: Displays pivots combo section on the dashboard.
%: Display the percentage of detected pivot combos on the dashboard instead of absolute numbers.
Pivot Combos Rows: Number of rows displayed by the "Pivots Combo" dashboard section.
Show MTF: Showa MTF candle numbering on the dashboard.
Location: Location of the dashboard on the chart.
Size: Size of the displayed dashboard.
🔶 USAGE
This script allows users with an understanding of The Strat to quickly highlight elements such as candle numbers, pivot machine guns, and custom combos. The usage for these concepts is given in the sub-sections below.
🔹 Candle Numbers
The Strat assigns a number to individual candles, this number is determined by the current candle position relative to the precedent candle, these include:
Number 1 - Inside bar, occurs when the previous candle range engulfs the current one.
Number 2 Up - Upside Directional Bar, occurs when the current price high breaks the previous high while the current low is lower than the previous high.
Number 2 Down - Downside Directional Bar, occurs when the current price low breaks the previous low while the current high is higher than the previous low.
Number 3 - Outside bar, occurs when the current candle range engulfs the previous one.
The script can highlight the number of a candle by using labels but can also style candles by depending on the candle number. Inside bars (1) only have their candle wick highlighted, directional bars (2) (-2) only have their candle body highlighted. Outside bars have their candle range highlighted.
Note that downside directional bars are highlighted with the number -2.
Users can see the total amount of times a specific candle number is detected on the historical data on the dashboard available within the settings, as well as the number of times a candle number is detected relative to the total amount of detected candle numbers expressed as a percentage.
It is also possible to see the current candle numbers returned by multiple timeframes on the dashboard.
🔹 Searching For Custom Combos
Combos are made of a sequence of two or more candle numbers. These combos can highlight multiple reversals/continuation scenarios. Various common combos are documented by The Strat community.
This script allows users to search for custom combos by entering them on the Combo user setting field.
When a user combo is found, it is highlighted on the chart as a box highlighting the combo range.
🔹 Pivot Combos
It can be of interest to a user to display the combo associated with a pivot high/low. This script will highlight the location of pivot points on the chart and display its associated combo by default. These are based on the Pivot Combo lookback and not displayed in real-time.
Users can see on the dashboard the combos associated with a pivot high/low, these are ranked by frequency.
🔹 Pivot Machine Gun (PMG)
Pivot Machine Guns (PMG)s describe the scenario where a single price variation breaks the value of multiple past successive higher lows/lower highs. This can highlight a self-exciting behavior, where even more past successive higher lows/lower highs get broken.
Users can select the minimum sequence length of successive higher lows/lower highs required for a PMG to be detected, as well the amount of these successive higher lows/lower highs that must be broken.

Edward PriceAction
This is an updated version of my previous script, I have added a few extra Patterns and some patterns specs have chnaged over those specified by "Price Action Battle Station by theforexguy".
Because this script has diverted from the original specification of "theforexguy", I have decided to release it as a new version. Improvements have been made to some of the pattern finding calculations, for example Hammer and Shooting Stars are now special Pin Bars, they now must have preceding and succeeding confirm bars, so they do not occur very often.
NOTE: All the identification of PA candles is disabled by default.
Changes made in Version 2.0 :
Added Forex Morning and Evening Stars (the centre small candle is not a specific color).
Abbreviated text names for less cluttered look.
Change minimum/maximum bar sizes to be a % of current ATR, rather than pips, this makes relative sizing independent on Time Frame, and make the script work better with non-currency assets like stocks and commodities .
Change definition of Hammer and shooting Star so the the previous candle is part of a trend and is followed by a confirm candle.
Added some precendence test to reduce multiple action labels.
版本注释: After some feedback from fellow traders I have made the following changes:
Definition for Outside Bar now does not require the previous bar to be opposite Colour (this the same as Inside Bars), but added a requirement for minimum size ratio compared to previous Bar (set to 1.1 by default). If you require previous Bar to be opposite colour, you could use Engulfing candles with Outside Bar option enabled.
Added Maximum size ratio requirement for Inside Bars (set to 0.9 by default).
版本注释: Minor Update.
Added OverSized candle Pattern, the pattern is labelled when candle is some ratio (default 5) bigger than current ATR of chart time frame.
Added Option to Change ATR Length.
版本注释: Patch
Correct Polarity of Oversize Bar labelling.
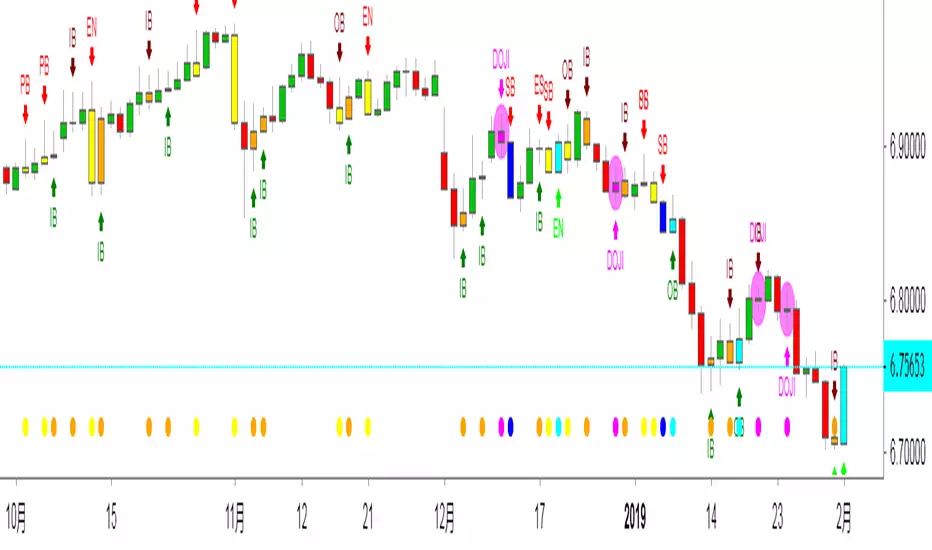
中文解释:
价格行为交易,此指标能够显示出来K线所代表的意思,比如PB就是PINBAR的意思 就是倒锤头线,反转概率大于延续概率。
OB就是吞没的意思,不管是阴吞没还是阳吞没 我们根据PA入场就行,标准是回撤50%入场。而ODJI就是黄昏星,启明星的意思。
这个指标在添加的时候是空白的,需要人工去点设置,把需要使用的功能打上钩钩确认。这样就能够在图表上面显示出来了。
如果不希望显示彩色K线同样也可以设置哈!
数值和样式都 可以设置,在不懂指标的前提下推荐使用默认设置。只负责打勾勾就行。确认后就能够看到图表上面显示的指标了。

By Traders For TradersThis is an updated version of my previous script, I have added a few extra Patterns and some patterns specs have chnaged over those specified by "Price Action Battle Station by theforexguy".
Because this script has diverted from the original specification of "theforexguy", I have decided to release it as a new version. Improvements have been made to some of the pattern finding calculations, for example Hammer and Shooting Stars are now special Pin Bars, they now must have preceding and succeeding confirm bars, so they do not occur very often.
NOTE: All the identification of PA candles is disabled by default.
Changes made in Version 2.0 :
Added Forex Morning and Evening Stars (the centre small candle is not a specific color).
Abbreviated text names for less cluttered look.
Change minimum/maximum bar sizes to be a % of current ATR, rather than pips, this makes relative sizing independent on Time Frame, and make the script work better with non-currency assets like stocks and commodities .
Change definition of Hammer and shooting Star so the the previous candle is part of a trend and is followed by a confirm candle.
Added some precendence test to reduce multiple action labels.
版本注释: After some feedback from fellow traders I have made the following changes:
Definition for Outside Bar now does not require the previous bar to be opposite Colour (this the same as Inside Bars), but added a requirement for minimum size ratio compared to previous Bar (set to 1.1 by default). If you require previous Bar to be opposite colour, you could use Engulfing candles with Outside Bar option enabled.
Added Maximum size ratio requirement for Inside Bars (set to 0.9 by default).
版本注释: Minor Update.
Added OverSized candle Pattern, the pattern is labelled when candle is some ratio (default 5) bigger than current ATR of chart time frame.
Added Option to Change ATR Length.
版本注释: Patch
Correct Polarity of Oversize Bar labelling.
Fibon-IchimokuThis is a highly modified version of the classic Ichimoku cloud indicator. It incorporates Fibonacci retracement levels into the display. Hence the name "Fibon-Ichimoku"
As well as the standard short term Tenken-sen (blue line) and medium term Kinjun-sen (red line), it also includes a long term perspective line as well (in white).
The Tenken-sen and Kinjun-sen lines have been adjusted to work with 24hr Cryptocurrency markets.
Each line can also have the option to show 38.2% and 61.8% Fibonacci levels, however, I suggest not using them all at once, as there is a lot of information on the screen.
There is also a faint green and red thin line showing the top and bottom limits of the long term period.
Plotted above the candles, is a Fibonacci extension target line as a "possible" sell target level, this uses the Kinjun-sen time frame to find the swing low and swing high.
The extension target value is customisable by value as well as by forward or backward display offset.
The target level will show if the closing prices, from current bar to 2 periods back, is greater than the long term 50% line and the current Kinjun-sen 61.8% level is greater than the current long term 50% level.
After that if the Tenken-sen line is above the Kinjun-sen line, then the target will be green indicating a stronger trend. If it's less, then it will show as yellow.
BUT WAIT THERE"S MORE!!!
======================
Just for the sake of it, it also includes as an option to show inside bar alerts and price bar direction.
an "X" means an inside bar, arrows up or down indicate the direction of movement if it's not an inside bar.
The middle points of the bars determine the colouring of the alert.
If the current middle is greater than the previous, then it's green.
If the current middle is less than the previous, then it's red.
If there is no change then it's yellow.

The Strat The Strat Bar Type Identifier – Pure Price Action Logic
This open-source indicator implements the foundational bar classification of "The Strat" method developed by Rob Smith. It identifies each candle on the chart as one of the three core types used in The Strat:
* Inside Bar (1): The candle’s range is fully within the previous candle’s range. This indicates consolidation or balance and often precedes breakouts or reversals.
* Two-Up Bar (2U): The current candle breaks the previous high but does not break its low. This is considered bullish directional movement.
* Two-Down Bar (2D): The current candle breaks the previous low but not the high. This signals bearish directional movement.
* Outside Bar (3): The candle breaks both the high and the low of the previous candle, signaling a broadening formation and high volatility.
The script plots a character below each candle based on its type:
* "1" for Inside Bar
* "2" for Two-Up or Two-Down (color-coded)
* "3" for Outside Bar
This tool helps traders quickly identify actionable setups according to The Strat method and serves as a foundation for more advanced strategies like the 3-1-2 reversal or 1-2-2 continuation.
All calculations are based purely on price action—no indicators, no smoothing, no lagging elements. It is ideal for traders looking to understand price structure and bar sequencing from a Strat perspective.
To use:
1. Add the indicator to any chart and timeframe.
2. Look for the numbers below the candles.
3. Analyze the sequence of bar types to spot Strat setups.
This script is educational and can be extended with multi-timeframe context, FTFC logic, actionable signals, or broadening formation detection.
Clean, minimal, and faithful to the core principles of The Strat.

TCSE24TCSE24 or Trendband Cycle Special Edition is designed to help create a simple trading plan by identifying potential Entry, Exit, Target Price, and Stop Loss. I use TCSE24 as a guide for short-term swing trading!
Please note, TCSE24 is not a directional indicator but fits better in Trend Following Strategy.
Only work with chart that have volume by default
Signals for Bullish Trade
1. Trendband Below Candlestick
Filled Red with a Purple Line.
2. Cycle Begin
Bar Color: Vivid Green.
Green Circle Above Candlestick: Target Price.
Green Circle Below Candlestick: Pullback Entry.
Red Circle Below Candlestick: Stop Loss.
3. Breakout
Bar Color: Lemon Green.
Green Circle Below Candlestick: Pullback Entry.
Red Circle Below Candlestick: Stop Loss.
4. Broken Minor Support
Bar Color: Yellow.
Price closes below the lowest low of the last 4 candles.
5. Volume Test
Green Triangle-Up below Candlestick.
Current bar shows 3 consecutive falling volumes.
6. Inside Bar
Orange Triangle-Up below Candlestick.
High and low are within the high and low of the previous candlestick.
7. Box Trading
Purple Diamond
8. Cycle End
Bar Color: Red.
Red Triangle-Up below Candlestick.
9. Info Panel
Background Green, turning Yellow after 20 bars from Cycle Begin.
Background Red when Cycle Ends.
Displays info such as Current Price, Target Price, Pullback Price, Stop Loss.
________________________________________
Signals for Bearish Trade
1. Trendband Above Candlestick
Filled with Blue.
2.Short Selling Begin
Bar Color: Blue.
Blue Circle Above Candlestick: Stop Loss.
Blue Circle Below Candlestick: Target Price.
3. Breakdown
Blue Circle Above Candlestick: Stop Loss.
4. Short Selling End
Bar Color: White.
Blue Triangle-Down above Candlestick.
5. Info Panel
Background Blue throughout the trade.
________________________________________
Bullish Trade Entry Suggestions
1. Ensure Cycle Begin is confirmed:
Buy near the closing price.
Use a Buy Stop 2 ticks higher than Cycle Begin's highest price.
Use a Buy Limit at the pullback price.
Wait for a signal candlestick, then Buy the next day if the price rises above the signal candlestick’s high.
2. Ensure Breakout is confirmed:
Buy near the closing price.
Use a Buy Stop 2 ticks higher than Breakout’s highest price.
Use a Buy Limit at the pullback price.
3. Box Trading:
Buy on the third day (T3).
Buy above the Box Trading line.
4. Candlestick Signal:
Ensure the signal candlestick is confirmed:
Look for Doji, Spinning Top, or Hammer patterns.
Buy the next day if the price rises above the signal candle's high.
________________________________________
Bullish Trade Exit Suggestions
1. Target Sell
Sell when the Target Price (TP) is reached or hold as long as Stop Loss isn’t hit.
Sell if the price doesn’t move, doesn’t reach the target, or doesn’t hit the Stop Loss after 20 candles from Cycle Begin.
Sell if the price closes below the Stop Loss.
2. Candlestick Signal
Look for Doji, Spinning Top, or Hammer patterns.
Sell the next day if the price drops below the signal candle's low.
________________________________________
Bearish Trade Suggestions
Ensure Short Selling Signal or Breakdown is confirmed:
Sell near the closing price.
Close the position at Target 1, Target 2, Target 3.
Close the position if Stop Loss is hit or when Short Selling End appears.
________________________________________
Any alert() function call freq
Once_per_bar_close
Cycle Begin, Inside Bar, Doji, Hammer, Spinning Top, Box Trading, Volume Test, Short Selling
Once_per_bar
Breakout, Cycle End
For educational purposes only and should not be taken as advice on how to invest your capital. Always speak with a professional financial planner or advisor before making any investment decisions.

Strat Signal Setup Scanner (5/15/30/60/D) - Part 3
** PLEASE READ BEFORE USING THIS INDICATOR **
This indicator is strictly for helping people like myself learn 'The Strat' method by Rob Smith. This indicator DOES NOT provide trading advice or trade entry signals!
This scanner is Part 3 only. Please use with Strat Signal Scanner's (5/15/30/60/D) Part 1 and 2 for full function.
A demo video of this indicator is available:
Change indicators label color’s and adjust scanner window as required.
Strat Signal and Setup Scanner (5/15/30/60/D) - Part 1/2/3 version is also available.
Strat Signal and Setup Scanner (5/15/30/60/D) - Part 1, 2 and 3 features:
Strat Signal Scanner - Part 1 - (The Current bar’s condition with Hammer / Shooting Star combos if identified)
Inside Bar
2UP
2DOWN
Outside Bar
Shooting Star (signal will trigger when candle is forming live not after the candle has closed allowing you to prepare)
Hammer (signal will trigger when candle is forming live not after the candle has closed allowing you to prepare)
Shooter-Hammer (signal will trigger when pattern is forming live AND after both the Shooter and Hammer candles have closed giving you the new bar to action)
Hammer-Shooter (signal will trigger when pattern is forming live AND after both the Shooter and Hammer candles have closed giving you the new bar to action)
Strat Signal Setup Scanner - Part 2 - (Previous Bar + Current bar to identify setups)
2U-1
2D-1
3-1
1-2U
1-2D
1-3
3-2U
3-2D
Strat Signal Setup Scanner - Part 3 - (Previous two bars + Current bar to identify setups)
3-1-2U
3-1-2D
2U-1-2U
2D-1-2D
2U-1-2D
2D-1-2U
1-2U-2D
1-2D-2U
How to use the Strat Signal and Setup Scanner?
Open the 3 indicators in order starting with Part 1, Part 2 then Part 3. That way the scanner headings (5/15/30/60/D) will line up with the setups signals.
IMPORTANT: For the scan to work across ALL Timeframe Groups (5/15/30/60/D) successfully you must open a 5min chart on the stock you want to scan.
Once the scan results are displayed with the 5min chart open you can then click on a 15/30/60/D chart to see the setups. But do not pay attention to the new lower timeframe scan results when you have a higher timeframe chart open as they will be incorrect.
For an example: a Successful (5/15/30/60/D) Scan = after you open a 5min chart only. If you open the 15min chart the (15/30/60/D) scan results will be correct but the 5min scan results will be incorrect. If you open the 30min chart the (30/60/D) results will be correct but the 5 and 15 scan results will be incorrect always go back to the 5min chart to correct. This anomaly if due to a historical data issue with pine script.
How to change the Scanner Labels and Text Color’s?
Color’s changed within the Indicator Settings. After you choose your color's on the 'Inputs' page make sure you click the drop down arrow next to 'Defaults' (bottom left of the indicator settings) and then click 'Save As Default' to save your personalised indicator preferences.
How to create an Alert?
With a 1HR chart open click on Add Alert.
Change Condition to Strat Signal Scanner Part 1, Part or Part 3
Now select signal/setup in drop down box below example: ‘Inside 60’
Click Create
A Warning will appear, click ‘Continue anyway’. An alert is now set.
Strat Signal Setup Scanner (5/15/30/60/D) - Part 2
** PLEASE READ BEFORE USING THIS INDICATOR **
This indicator is strictly for helping people like myself learn 'The Strat' method by Rob Smith. This indicator DOES NOT provide trading advice or trade entry signals!
This scanner is Part 2 only. Please use with Strat Signal Setup Scanner's (5/15/30/60/D) Part 1 and 3 for full function.
A demo video of this indicator is available:
Change indicators label color’s and adjust scanner window as required.
Strat Signal and Setup Scanner (60/D/W/M/Q) - Part 1/2/3 version is also available.
Strat Signal and Setup Scanner (60/D/W/M/Q) - Part 1, 2 and 3 features:
Strat Signal Scanner - Part 1 - (The Current bar’s condition with Hammer / Shooting Star combos if identified)
Inside Bar
2UP
2DOWN
Outside Bar
Shooting Star (signal will trigger when candle is forming live not after the candle has closed allowing you to prepare)
Hammer (signal will trigger when candle is forming live not after the candle has closed allowing you to prepare)
Shooter-Hammer (signal will trigger when pattern is forming live AND after both the Shooter and Hammer candles have closed giving you the new bar to action)
Hammer-Shooter (signal will trigger when pattern is forming live AND after both the Shooter and Hammer candles have closed giving you the new bar to action)
Strat Signal Setup Scanner - Part 2 - (Previous Bar + Current bar to identify setups)
2U-1
2D-1
3-1
1-2U
1-2D
1-3
3-2U
3-2D
Strat Signal Setup Scanner - Part 3 - (Previous two bars + Current bar to identify setups)
3-1-2U
3-1-2D
2U-1-2U
2D-1-2D
2U-1-2D
2D-1-2U
1-2U-2D
1-2D-2U
How to use the Strat Signal and Setup Scanner?
Open the 3 indicators in order starting with Part 1, Part 2 then Part 3. That way the scanner headings (5/15/30/60/D) will line up with the setups signals.
IMPORTANT: For the scan to work across ALL Timeframe Groups (5/15/30/60/D) successfully you must open a 5min chart on the stock you want to scan.
Once the scan results are displayed with the 5min chart open you can then click on a 15/30/60/D chart to see the setups. But do not pay attention to the new lower timeframe scan results when you have a higher timeframe chart open as they will be incorrect.
For an example: a Successful (5/15/30/60/D) Scan = after you open a 5min chart only. If you open the 15min chart the (15/30/60/D) scan results will be correct but the 5min scan results will be incorrect. If you open the 30min chart the (30/60/D) results will be correct but the 5 and 15 scan results will be incorrect always go back to the 5min chart to correct. This anomaly if due to a historical data issue with pine script.
How to change the Scanner Labels and Text Color’s?
Color’s changed within the Indicator Settings. After you choose your color's on the 'Inputs' page make sure you click the drop down arrow next to 'Defaults' (bottom left of the indicator settings) and then click 'Save As Default' to save your personalised indicator preferences.
How to create an Alert?
With a 1HR chart open click on Add Alert.
Change Condition to Strat Signal Scanner Part 1, Part or Part 3
Now select signal/setup in drop down box below example: ‘Inside 60’
Click Create
A Warning will appear, click ‘Continue anyway’. An alert is now set.
