Event-Based Multi MA v1.1📈 Event-Based Multi MA v1.1 — Smart Trading with Dynamic MA Updates
Overview
In a world where most moving averages blindly follow every candle, Event-Based Multi MA v1.1 introduces a smarter logic:
➡️ Update moving averages only when significant price movements occur.
Forget the noise. Focus on what's important.
This indicator recalculates your moving averages only after meaningful price shifts, allowing you to spot true trends and avoid market whipsaws.
Key Features
✅ Event-Driven Logic
Set events based on:
Points: Absolute price change
Percent: Relative price movement
ATR: Volatility-adjusted dynamic movement
✅ Seven Fully Customizable Moving Averages (MA1–MA7)
Each MA offers:
Custom timeframe
Selection of types (EMA, SMA, WMA, VWMA, HMA, LSMA, DEMA, TEMA, ALMA, RMA)
Adjustable lengths and colors
✅ Reduced Market Noise
MAs adjust only after important price actions — cutting down lag and false signals.
✅ Multi-Timeframe Analysis
You can blend moving averages from different timeframes (e.g., 15m, 1H, Daily) into a single chart — perfect for professional multi-frame strategy building.
Settings Explained
Event Trigger Type: Select Points, Percent, or ATR-based movement.
Event Threshold: The amount of price movement needed to trigger a new calculation.
ATR Length: If ATR mode is selected, this controls the sensitivity.
Each Moving Average (MA1 to MA7) has:
MA Type: Choose the smoothing method that suits your trading style.
Length: The number of bars used in the calculation.
Color: Customize visual styling.
Timeframe: Load MAs from different timeframes into your current chart.
How to Use It in Trading
🔹 Trend Confirmation
Wait for event-triggered updates. Fresh MAs after a significant move are much stronger signals than constantly refreshing MAs.
🔹 Momentum Breakouts
Combine short-term (e.g., MA1, MA2) and long-term (e.g., MA5, MA6) MAs. When short-term MAs cross above/below long-term after an event, it's a powerful breakout cue.
🔹 Dynamic Support/Resistance
Use slow-moving MAs like 100-200 length across different timeframes.
The event-based recalculation keeps them relevant to recent major price moves.
🔹 Volatility Filters
Switch to ATR-based events to adapt moving average updates during volatile periods and calm markets.
Why It Beats Traditional Moving Averages
🚀 No More Overfitting to Every Candle
You focus only on impactful price changes.
🚀 Multi-Timeframe Flexibility
Blend micro and macro views seamlessly in one chart.
🚀 Cleaner Signals, Less Noise
Event-triggered recalculations filter out useless minor price wobbles.
🚀 Customization Beyond Standard MAs
TEMA, HMA, ALMA, DEMA, VWMA — all included for ultra-fine-tuned strategies.
✨ Ready to Upgrade Your Trading?
Forget the old, slow MAs.
Use intelligence. Trade events, not noise.
→ Add Event-Based Multi MA v1.1 to your chart and experience true precision!
在腳本中搜尋"ma cross"
ICT Swiftedge# ICT SwiftEdge: Advanced Market Structure Trading System
**Overview**
ICT SwiftEdge is a powerful trading system built upon the foundation of ICTProTools' ICT Breakers, licensed under the Mozilla Public License 2.0 (mozilla.org). This script has been significantly enhanced by to combine market structure analysis with modern technical indicators and a sleek, AI-inspired statistics dashboard. The goal is to provide traders with a comprehensive tool for identifying high-probability trade setups, managing exits, and tracking performance in a visually intuitive way.
**Credits**
This script is a derivative work based on the original "ICT Breakers" by ICTProTools, used with permission under the Mozilla Public License 2.0. Significant enhancements, including RSI-MA signals, trend filtering, dynamic timeframe adjustments, dual exit strategies, and an AI-style statistics dashboard, were developed by . We express our gratitude to ICTProTools for their foundational work in market structure analysis.
**What It Does**
ICT SwiftEdge integrates multiple trading concepts to help traders identify and manage trades based on market structure and momentum:
- **Market Structure Analysis**: Identifies Break of Structure (BOS) and Market Structure Shift (MSS) patterns, which signal potential trend continuations or reversals. BOS indicates a continuation of the current trend, while MSS highlights a shift in market direction, providing key entry points.
- **RSI-MA Signals**: Generates "BUY" and "SELL" signals when BOS or MSS patterns align with the Relative Strength Index (RSI) smoothed by a Moving Average (RSI-MA). Signals are filtered to occur only when RSI-MA is above 50 (for buys) or below 50 (for sells), ensuring momentum supports the trade direction.
- **Trend Filtering**: Prevents multiple signals in the same trend, ensuring only one buy or sell signal per trend direction, reducing noise and improving trade clarity.
- **Dynamic Timeframe Adjustment**: Automatically adjusts pivot points, RSI, and MA parameters based on the selected chart timeframe (1M to 1D), optimizing performance across different market conditions.
- **Flexible Exit Strategies**: Offers two user-selectable exit methods:
- **Trailing Stop-Loss (TSL)**: Exits trades when price moves against the position by a user-defined distance (in points), locking in profits or limiting losses.
- **RSI-MA Exit**: Exits trades when RSI-MA crosses the 50 level, signaling a potential loss of momentum.
- Users can enable either or both strategies, providing flexibility to adapt to different trading styles.
- **AI-Style Statistics Dashboard**: Displays real-time trade performance metrics in a futuristic, neon-colored interface, including total trades, wins, losses, win/loss ratio, and win percentage. This helps traders evaluate the system's effectiveness without external tools.
**Why This Combination?**
The integration of these components creates a synergistic trading system:
- **BOS/MSS and RSI-MA**: Combining market structure breaks with RSI-MA ensures entries are based on both price action (structure) and momentum (RSI-MA), increasing the likelihood of high-probability trades.
- **Trend Filtering**: By limiting signals to one per trend, the system avoids overtrading and focuses on significant market moves.
- **Dynamic Adjustments**: Timeframe-specific parameters make the system versatile, suitable for scalping (1M, 5M) or swing trading (4H, 1D).
- **Dual Exit Strategies**: TSL protects profits during trending markets, while RSI-MA exits are ideal for range-bound or reversing markets, catering to diverse market conditions.
- **Statistics Dashboard**: Provides immediate feedback on trade performance, enabling data-driven decision-making without manual tracking.
This combination balances technical precision with user-friendly visuals, making it accessible to both novice and experienced traders.
**How to Use**
1. **Add to Chart**: Apply the script to any TradingView chart.
2. **Configure Settings**:
- **Chart Timeframe**: Select your chart's timeframe (1M to 1D) to optimize parameters.
- **Structure Timeframe**: Choose a timeframe for market structure analysis (leave blank for chart timeframe).
- **Exit Strategy**: Enable Trailing Stop-Loss (`useTslExit`), RSI-MA Exit (`useRsiMaExit`), or both. Adjust `tslPoints` for TSL distance.
- **Show Signals/Labels**: Toggle `showSignals` and `showExit` to display "BUY", "SELL", and "EXIT" labels.
- **Dashboard**: Enable `showDashboard` to view trade statistics. Customize colors with `dashboardBgColor` and `dashboardTextColor`.
3. **Trading**:
- Look for "BUY" or "SELL" labels to enter trades when BOS/MSS aligns with RSI-MA.
- Exit trades at "EXIT" labels based on your chosen strategy.
- Monitor the statistics dashboard to track performance (total trades, win/loss ratio, win percentage).
4. **Alerts**: Set up alerts for BOS, MSS, buy, sell, or exit signals using the provided alert conditions.
**License**
This script is licensed under the Mozilla Public License 2.0 (mozilla.org). The source code is available for review and modification under the terms of this license.
**Compliance with TradingView House Rules**
This publication adheres to TradingView's House Rules and Scripts Publication Rules. It provides a clear, self-contained description of the script's functionality, credits the original author (ICTProTools), and explains the rationale for combining indicators. The script contains no promotional content, offensive language, or proprietary restrictions beyond MPL 2.0.
**Note**
Trading involves risk, and past performance is not indicative of future results. Always backtest and validate the system on your preferred markets and timeframes before live trading.
Enjoy trading with ICT SwiftEdge, and let data-driven insights guide your decisions!

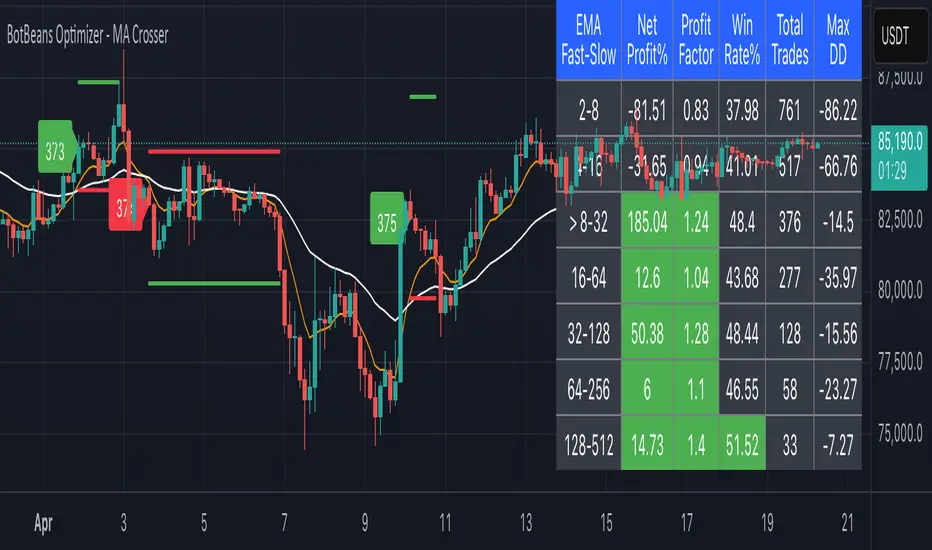
BotBeans Optimizer - MA CrosserBotBeans Optimizer - MA Crosser
This script allows you to:
1. Select up to 12 types of Moving Averages (MA)
2. Backtest 7 combinations of MA crossover strategy at a time with key metrics such as Net Profit%, Profit Factor, Win Rate%, Total Trades and Maximum Drowdown (Max DD)
3. Easy to define slow MA length by using SlowMultiplier. Slow MA length is calculated by fast MA length multiplied by SlowMultipleir.
4. Ability to plot MA lines, trading signals, slop loss and take profit levels for clarification
5. Risk Management is implemented. By default, risk only 2% for each trade.
6. The script uses 14 Average True Range (ATR) multiplied by ATRMultiplier to determine stop loss level
7. Take profit level is calculated by stop loss level multiplied by RiskRewardRatio.
8. Implemented with trading fee for more accurate backtest result
Fractal Pattern AnalysisFractal Pattern Key Elements and How to Read Them
1. Williams Fractals (Triangle Markers)
Red Triangles Pointing Down: Bearish fractals - potential resistance points and selling opportunities
Green Triangles Pointing Up: Bullish fractals - potential support points and buying opportunities
When to Act: Look for bullish fractals forming during uptrends and bearish fractals during downtrends
2. Moving Averages
Yellow Line (20 EMA): Short-term trend
Blue Line (50 EMA): Medium-term trend
Red Line (200 EMA): Long-term trend
Interpretation: When shorter MAs cross above longer MAs, it's bullish; when they cross below, it's bearish
Key Signal: The alignment of all three MAs (stacked in order) confirms a strong trend
3. Background Color
Green Background: Uptrend (all MAs aligned bullishly)
Red Background: Downtrend (all MAs aligned bearishly)
Yellow Background: Sideways/neutral market (MAs not clearly aligned)
4. Market Structure Markers (Small Circles)
Green Circles: Higher highs and higher lows (bullish structure)
Red Circles: Lower highs and lower lows (bearish structure)
Pattern Recognition: Multiple green circles suggest continuing uptrend; multiple red circles suggest continuing downtrend
5. Reversal Diamonds ("Rev" Markers)
Yellow Diamonds: Potential trend reversal points
Usage: These mark where the current trend might be changing direction
Confirmation: Wait for price to close beyond the diamond before acting
6. Bollinger Bands (Blue Lines with Fill)
Middle Band: 20-period SMA
Upper/Lower Bands: Volatility channels
Signals: Price touching upper band in uptrend is strength; touching lower band in downtrend is weakness
Squeeze: When bands narrow, expect a volatility breakout soon
7. Status Table (Top Right)
Shows current trend, volume direction, and overall signal at a glance
"BUY" signal appears when multiple bullish conditions align
"SELL" signal appears when multiple bearish conditions align

Rubotics TDI Top/Bottom Indicator**Rubotics TDI Top/Bottom Indicator (Rubots TDI T/B)**
This proprietary indicator integrates several technical analysis tools into one cohesive system to help traders identify potential top and bottom signals directly on the price chart. Unlike standard indicators that merely plot common metrics, this script uniquely fuses a custom moving average algorithm with established oscillators to enhance signal clarity and market timing.
**Core Components and Unique Features:**
- **Global Visual Settings:**
- Easily toggle visual elements (tables, background highlights) that display key metrics and trading setup information.
- Provides a detailed on-chart display of strategy data and essential trading parameters.
- **MAVW Calculation (Proprietary):**
- Computes a series of weighted moving averages using Fibonacci-inspired lengths (3, 5, 8, 13, 21, 34) to generate a dynamic moving average (MAVW).
- The MAVW line is color-coded—blue when trending upward, red when trending downward, and yellow when neutral—to offer an immediate visual cue of market direction.
- **RSI Module:**
- Calculates the RSI on a user-selected price source (default: close) with a customizable period (default: 14).
- Adjustable thresholds (default: 45 and 55) allow for fine-tuning of overbought and oversold conditions.
- **TDI Component:**
- Adapts the RSI into a dynamic channel using a simple moving average and a scaled standard deviation (multiplied by 1.6185) to form upper and lower bands.
- Incorporates both fast and slow moving averages (default periods: 2 and 7) with optional band filling to visually highlight momentum changes.
- **Note:** The TDI logic is based on public methodologies for converting RSI data into a dynamic indicator.
- **WaveTrend Oscillator:**
- Uses configurable channel and smoothing parameters to generate a WaveTrend line for additional momentum confirmation.
- The oscillator is used to further validate top and bottom signals by identifying overbought or oversold conditions.
- **Note:** The WaveTrend calculations are derived from widely available, public-domain techniques.
- **Signal Generation:**
- **Buy Signal:** Generated when the RSI is below its lower threshold, the TDI fast MA crosses above the lower band (with prior bar confirmation), the price is below the MAVW, and the WaveTrend indicates oversold conditions.
- **Sell Signal:** Generated when the RSI is above its upper threshold, the TDI fast MA crosses below the upper band (with prior bar confirmation), the price is above the MAVW, and the WaveTrend signals overbought conditions.
- Signals are visually marked on the chart with upward and downward triangles and accompanied by alert conditions.
- **Volume-Based Bar Coloring & Additional Visuals:**
- Colors price bars based on volume relative to a moving average to highlight the strength of moves.
- Provides background color changes and a dynamic table of key metric values (MAVW, RSI, TDI bands, WaveTrend) for real-time analysis.
**Customization and Originality:**
- Extensive input parameters allow traders to adjust each component to suit their trading style and market conditions.
- The unique combination of the proprietary MAVW calculation with traditional RSI, TDI, and WaveTrend elements creates a robust system for detecting market tops and bottoms.
- **Closed-Source Justification:**
This indicator is published as a closed-source script due to the proprietary enhancements integrated into the MAVW algorithm and signal generation logic. These unique modifications provide added value beyond standard public indicators.

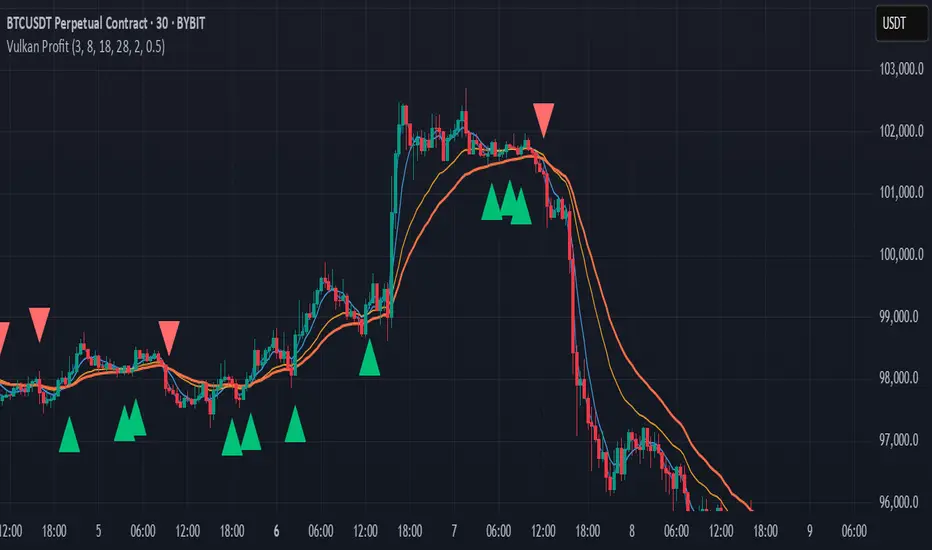
Vulkan Profit
Overview
The Vulkan Profit indicator is a trend-following tool that identifies potential entry and exit points by monitoring the relationship between short-term and long-term moving averages. It generates clear buy and sell signals when specific moving average conditions align, making it useful for traders looking to confirm trend changes across multiple timeframes.
How It Works
The indicator utilizes four different moving averages:
Fast WMA (period 3) - A highly responsive weighted moving average
Medium WMA (period 8) - A less sensitive weighted moving average
Fast EMA (period 18) - A responsive exponential moving average
Slow EMA (period 28) - A slower exponential moving average
These moving averages are grouped into two categories:
Short-term MAs: Fast WMA and Medium WMA
Long-term MAs: Fast EMA and Slow EMA
Signal Generation Logic
The Vulkan Profit indicator generates signals based on the relative positions of these moving averages:
Buy Signal (Green Triangle)
A buy signal appears when the minimum value of the short-term MAs becomes greater than the maximum value of the long-term MAs. In other words, when both short-term MAs cross above both long-term MAs.
Sell Signal (Red Triangle)
A sell signal appears when the maximum value of the short-term MAs becomes less than the minimum value of the long-term MAs. In other words, when both short-term MAs cross below both long-term MAs.
Visual Components
Moving Averages - All four moving averages can be displayed or hidden
Signal Arrows - Green triangles for buy signals, red triangles for sell signals
Colored Line - A line that changes color based on the current market stance (green for bullish, red for bearish)
Customization Options
The indicator offers several customization settings:
Toggle the visibility of moving averages
Toggle the visibility of buy/sell signals
Adjust the color, width, and position of the signal line
Choose between different line styles (Line, Stepline, Histogram)
Practical Trading Applications
Trend Identification: The relative positioning of all moving averages helps identify the current market trend
Entry/Exit Points: The buy and sell signals can be used as potential entry and exit points
Trend Confirmation: The colored line provides ongoing confirmation of the trend direction
Filter: Can be used in conjunction with other indicators as a trend filter
Trading Strategy Suggestions
Trend Following: Enter long positions on buy signals and exit on sell signals during trending markets
Confirmation Tool: Use the signals to confirm trades identified by other indicators
Timeframe Analysis: Apply the indicator across multiple timeframes for stronger confirmation
Risk Management: Place stop-loss orders below recent swing lows for long positions and above recent swing highs for short positions
Tips for Best Results
The indicator performs best in trending markets and may generate false signals in ranging or highly volatile markets
Consider the broader market context before taking trades based solely on these signals
Use appropriate position sizing and risk management regardless of the indicator's signals
The longer timeframes generally produce more reliable signals with fewer false positives
The Vulkan Profit indicator combines the responsiveness of short-term averages with the stability of long-term averages to capture significant trend changes while filtering out minor price fluctuations.
[TABLE] Moving Average Stage Indicator Table📈 MA Stage Indicator Table
🧠 Overview:
This script analyzes market phases based on moving average (MA) crossovers, classifying them into 6 distinct stages and displaying statistical summaries for each.
🔍 Key Features:
• Classifies market condition into Stage 1 to Stage 6 based on the relationship between MA1 (short), MA2 (mid), and MA3 (long)
• Provides detailed stats for each stage:
• Average Duration
• Average Width (MA distance)
• Slope (Angle) - High / Low / Average
• Shows current stage details in real-time
• Supports custom date range filtering
• Choose MA type: SMA or EMA
• Optional background coloring for stages
• Clean summary table displayed on the chart

STH Unrealized Profit/Loss Ratio (STH-NUPL) | [DeV]STH-NUPL
The Short-Term Holder Net Unrealized Profit/Loss Ratio (STH-NUPL) is an analytical tool designed to approximate the unrealized profit or loss of Bitcoin’s short-term holders (STHs)—typically those holding coins for less than 155 days—within the constraints of TradingView’s price-based environment. Drawing inspiration from the canonical STH-NUPL metric, which assesses the difference between the market value and realized value of STH-held coins, this indicator adapts the concept into a normalized ratio using Bitcoin’s price data as a proxy. It offers a window into the sentiment and behavior of short-term market participants, who are often more sensitive to price fluctuations than long-term holders.
In its raw form, STH-NUPL oscillates around a break-even threshold of 0, where positive values indicate aggregate unrealized profits for STHs (market value exceeds realized value), and negative values suggest losses. This inflection point frequently acts as a key level: in bear markets, it can signal capitulation as STHs sell at break-even or below, while in bull markets, it may reflect reluctance to realize losses, providing support. The indicator enhances this metric with smoothing, a moving average overlay, and sophisticated visualization options, delivering a statistically informed perspective on short-term holder dynamics tailored for institutional-grade analysis.
STH-NUPL Settings -
Lookback Length (Default: 150 days): Defines the SMA period for estimating realized value. This 150-day window aligns with traditional STH definitions (e.g., <155 days), capturing a broad yet relevant historical cost basis for short-term holders, ideal for assessing cyclical behavior.
Smoothing Period (Default: 5 days): Applies an EMA to the raw STH-NUPL ratio, with a short default period to maintain responsiveness to recent price shifts while filtering out daily volatility. This setting is particularly suited for tactical analysis.
Moving Average Settings -
MA Lookback Length (Default: 90 days): Sets the period for the STH-NUPL’s moving average, offering a medium-term trend signal that contrasts with the 150-day lookback, enabling detection of momentum shifts within broader market phases.
MA Type (Default: EMA): Provides six moving average types, from the straightforward SMA to the volume-sensitive VWMA. The default EMA balances smoothness and reactivity, while options like HMA or VWMA cater to specialized needs, such as emphasizing recent action or volume trends.
Display Settings -
Show Moving Average (Default: True): Toggles the visibility of the STH-NUPL MA plot, allowing users to focus solely on the smoothed ratio when desired.
Show Background Colors (Default: True): Activates dynamic background shading to visually reinforce market regimes.
Background Color Source (Default: STH-NUPL): Enables users to tie the background to either the STH-NUPL’s midline (reflecting sthNupl > 0) or the MA’s trend direction (maNupl > maNupl ), aligning the visual context with the chosen analytical focus.
Analytical Applications -
Bear Market Capitulation: When the smoothed STH-NUPL approaches or falls below zero, it often signals loss realization among STHs, a precursor to capitulation in downtrends. A declining MA crossing zero can confirm this selling pressure.
Bull Market Support: Positive STH-NUPL values with a rising MA indicate STHs are in profit and reluctant to sell at a loss, forming support zones in uptrends as sell pressure wanes.
Sentiment Extremes: Significant deviations above or below zero highlight over-optimism or despair among STHs, offering contrarian opportunities when paired with price action or other on-chain metrics.
**Limitations**
As a TradingView-based approximation, this indicator uses price data (close) rather than true on-chain STH supply and realized price, which are available through providers like Glassnode. The 150-day SMA for realized value simplifies the cost basis, potentially underrepresenting the diversity of STH transactions. Despite this, the smoothed ratio and moving average overlay provide a practical proxy for tracking STH sentiment within TradingView’s ecosystem.

Spent Output Profit Ratio (SOPR) Z-Score | [DeV]SOPR Z-Score
The Spent Output Profit Ratio (SOPR) is an advanced on-chain metric designed to provide deep insights into Bitcoin market dynamics by measuring the ratio between the combined USD value of all Bitcoin outputs spent on a given day and their combined USD value at the time of creation (typically, their purchase price). As a member of the Realized Profit/Loss family of metrics, SOPR offers a window into aggregate seller behavior, effectively representing the USD amount received by sellers divided by the USD amount they originally paid. This indicator enhances this metric by normalizing it into a Z-Score, enabling a statistically robust analysis of market sentiment relative to historical trends, augmented by a suite of customizable features for precision and visualization.
SOPR Settings -
Lookback Length (Default: 150 days): Determines the historical window for calculating the Z-Score’s mean and standard deviation. A longer lookback captures broader market cycles, providing a stable baseline for identifying extreme deviations, which is particularly valuable for long-term strategic analysis.
Smoothing Period (Default: 100 days): Applies an EMA to the raw SOPR, balancing responsiveness to recent changes with noise reduction. This extended smoothing period ensures the indicator focuses on sustained shifts in seller behavior, ideal for institutional-grade trend analysis.
Moving Average Settings -
MA Lookback Length (Default: 90 days): Sets the period for the Z-Score’s moving average, offering a shorter-term trend signal relative to the 150-day Z-Score lookback. This contrast enhances the ability to detect momentum shifts within the broader context.
MA Type (Default: EMA): Provides six moving average types, from the simple SMA to the volume-weighted VWMA. The default EMA strikes an optimal balance between smoothness and responsiveness, while alternatives like HMA (Hull) or VWMA (volume-weighted) allow for specialized applications, such as emphasizing recent price action or incorporating volume dynamics.
Display Settings -
Show Moving Average (Default: True): Toggles the visibility of the Z-Score MA plot, enabling users to focus solely on the raw Z-Score when preferred.
Show Background Colors (Default: True): Activates dynamic background shading, enhancing visual interpretation of market regimes.
Background Color Source (Default: SOPR): Allows users to tie the background color to either the SOPR Z-Score’s midline (reflecting adjustedZScore > 0) or the MA’s trend direction (zScoreMA > zScoreMA ). This dual-source option provides flexibility to align the visual context with the primary analytical focus.
Analytical Applications -
Bear Market Resistance: When the Z-Score approaches or exceeds zero (raw SOPR near 1), it often signals resistance as sellers rush to exit at break-even, a pattern historically observed during downtrends. A rising Z-Score MA crossing zero can confirm this pressure.
Bull Market Support: Conversely, a Z-Score dropping below zero in uptrends indicates reluctance to sell at a loss, forming support as sell pressure diminishes. The MA’s bullish coloring reinforces confirmation of renewed buying interest.
Extreme Deviations: Values significantly above or below zero highlight overbought or oversold conditions, respectively, offering opportunities for contrarian positioning when paired with other on-chain or price-based metrics.

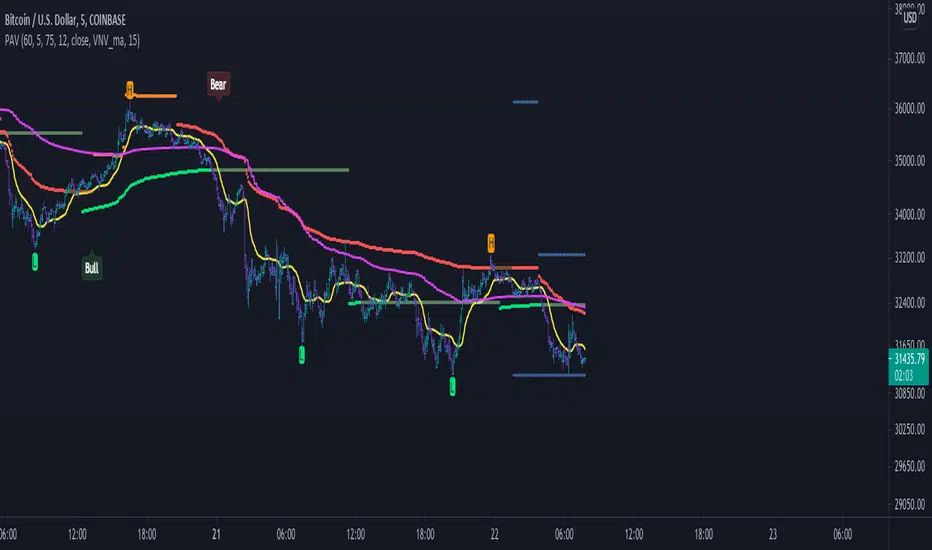
SemaforThis is the 4 Level Semafor indicator with Daily Open Line and Average Session Range. Also on the chart is the EMA Ribbon indicator.
Credit to:
Devlucem for the Semafor indicator
Quantvue for the Average Session Range
Shusterivi for the Daily Open Line
MYNAMEISBRANDON for the EMA Ribbon
The Semafors are based on the ZigZag indicator and show higher highs/lower lows of a specified period, determined by the user and applied in settings.
The default periods I use are:
10 period (hidden on this chart)
50 period-blue dots
250 period-white dots
615 period-black dots
Just as the ZigZag indicator will recalculate so to will the semafors, as additional candles are built. The semafor indicator is never to be used as a stand alone signal. It must be combined with other indicators to be used effectively. What we look for are the semafor patterns of a large white dot followed by a 1st blue dot opposite of the white. Then a 2nd blue dot in agreement with the white dot. In theory, the 2nd blue dot is seen as confirmation of the establishment of the white semafor..
When combined with Daily Open Line, ADR (Average Sessions Range), EMA cross and VWAP anchored to your 250 semafors, your odds are greatly increased. Add to that the knowledge of basic market structure and the wisdom that comes from patience and you have a very powerful weapon.
The Daily Open...I trade the M1 chart and also draw a H4 Open Line on my chart for the smaller time frames. Price will tend to trade away from the Daily Open Line. In many cases until it reaches certain levels...Fib, Gann, ADR, etc., then runs through a pullback cycle. I like the ADR levels. The ADR can give clues when entering a consolidation phase, ie trading between the buy side and sell side 15% levels. Trading away from the Daily Open(or H4 open) along with breaking the 15% level, while in agreement with a semafor pattern is a good sign.
Add to that confluence the agreement of your MA cross and the 250 semafor Anchored VWAP and you have a solid signal to help determine your actions. This trend following layout will work on any time frame. I just really like the M1 for its precision, not for crazy back and forth all day. With the exception of some strong pull back signals, I don't enter any more trades on the M1 than on M5, 15 or 30.
This is based on and follows the teachings of Xard and his trading strategy. Just as I don't want to take anyone's credit for these indicators, I won't take credit for what I have been taught either.
The trader can obviously use their favorite MA cross indicator. But this one is visually beautiful AND displays the current time frame and 1 time frame higher on the chart...awesome!
Of note, I do run into trouble at times with the 615 period semafor. I have been told it is because TradingView has trouble with extended period indicators. As a matter of fact, I would like a much higher period for my biggest semafor. I would like it set at 1250, but that seems to be a no starter. If anyone has a solution, that would be welcomed news.

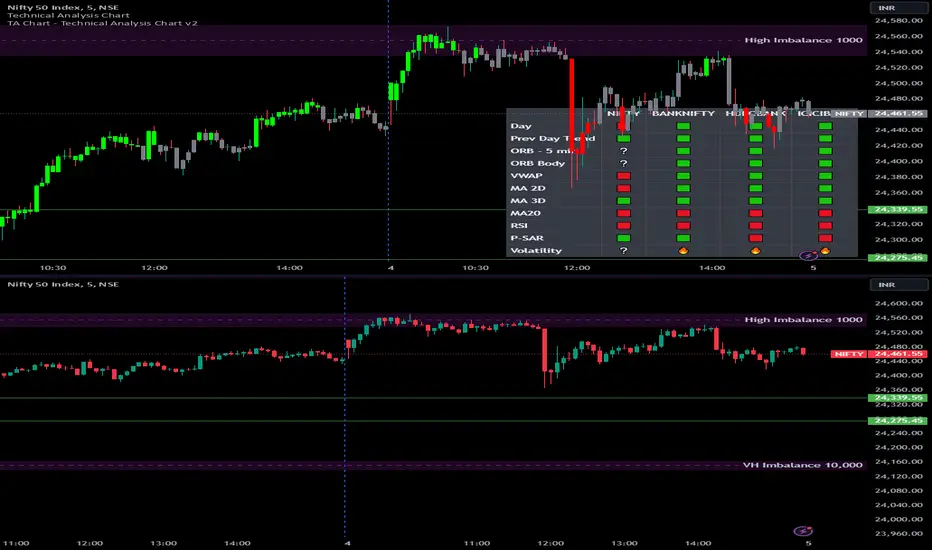
Options Series - Technical Analysis Chart➤ Simple Technical Chart Only:
➤ With MA-20 Overlay and Volatility background bars:
➤ With RSI Candles:
⭐ Overview and How It Works:
This script provides a multi-asset analysis tool to assess various market conditions across four symbols simultaneously. It combines several indicators such as daily price change, Moving Averages (MA), Bollinger Bands (BB), Parabolic SAR, RSI, and VWAP to generate buy/sell signals and trend indicators. Its strength lies in the layered use of indicators to enhance signal reliability, making it valuable for traders needing cross-validation in decision-making.
⭐ Key Features and Functionality:
The script evaluates each symbol's price against various indicators and conditions:
Daily Price Conditions: It checks if each symbol’s close price is above or below the previous day’s open, close, and intra-day ranges, forming a foundational bullish/bearish condition.
Range Breakout 1st 5min Candle (ORB): Opening Range Breakout levels are calculated and compared with current close prices, detecting breakout/breakdown conditions.
ORB Body: This basically calculates the previous day Daily candle body size, if todays Daily candle body size is greater than previous day, then we can say that we are having good momentum else its likely to be in-sidebar trading.
Moving Averages (MA): It leverages EMA-20, 2-day, and 3-day exponential moving averages to gauge short to medium-term trends.
RSI and VWAP: Relative Strength Index (RSI) determines overbought or oversold conditions, while VWAP compares prices to volume-weighted levels.
Bollinger Bands and Trend Analysis: Detects volatility and potential breakout conditions.
Concept of ORB Body:
Current_PrevDay_Body = (math.max(var_Current_PrevD_Open, var_Current_PrevD_Close) - math.min(var_Current_PrevD_Open, var_Current_PrevD_Close))
Current_Upper_ORB = var_Current_D_Open + Current_PrevDay_Body
Current_Lower_ORB = var_Current_D_Open - Current_PrevDay_Body
Current_TodayDay_Body = math.max(var_Current_D_Open, var_Current_Close) - math.min(var_Current_D_Open, var_Current_Close)
Current_ORBBody = Current_TodayDay_Body > Current_PrevDay_Body
Current_Upper_ORB_bull = (var_Current_Close > Current_Upper_ORB)
Current_Lower_ORB_bear = (var_Current_Close < Current_Lower_ORB)
🎨 Visualizations and User Experience:
The script can dynamically display colored backgrounds indicating trends when conditions are met. For example, the bgcolor function changes the background when certain trend-based criteria are satisfied, offering visual cues to users. Additionally, the checkbox input toggles trend bar visualizations, enhancing user experience by providing a quick visual reference without needing to interpret individual data points manually.
RSI-Based Candle Coloring:
➤ The script customizes candle colors based on RSI thresholds, specifically defining upper (60) and lower (40) RSI levels. When the RSI value exceeds the upper threshold, candles are colored as bullish (green), and if it falls below the lower threshold, candles are colored as bearish (red). Neutral RSI values result in a default color (gray).
➤ This setup offers a visually intuitive way to identify potential trend directions based on RSI levels, making it ideal for traders looking to gauge momentum visually.
⭐ Settings and Customization:
With multiple user-configurable inputs, the script allows for tailored analysis. Customizable parameters, such as enabling/disabling trend bars and setting various look-back periods for indicators like Bollinger Bands and Moving Averages, make it adaptable to various trading styles and preferences. It also allows users to modify visual elements like colors and styles, improving flexibility.
⭐ Uniqueness of the Concept:
The unique aspect of this script is its multi-symbol approach combined with complex conditions. By comparing not only one but four symbols simultaneously, it provides a broader market view and allows traders to correlate signals across different assets, offering a potential edge for diversified or comparative strategies. Additionally, the incorporation of ORB and multi-timeframe MAs gives it a robustness often lacking in simpler single-symbol scripts.
🚀 Conclusion:
This script is a powerful multi-indicator tool suited for traders looking for a comparative, multi-symbol analysis. With features like ORB, Bollinger Band-based trend detection, and MA cross-verification, it can assist traders in identifying and validating trend signals across assets. The user-friendly visualizations and customizable settings further enhance its usability, making it versatile for various trading strategies and preferences.
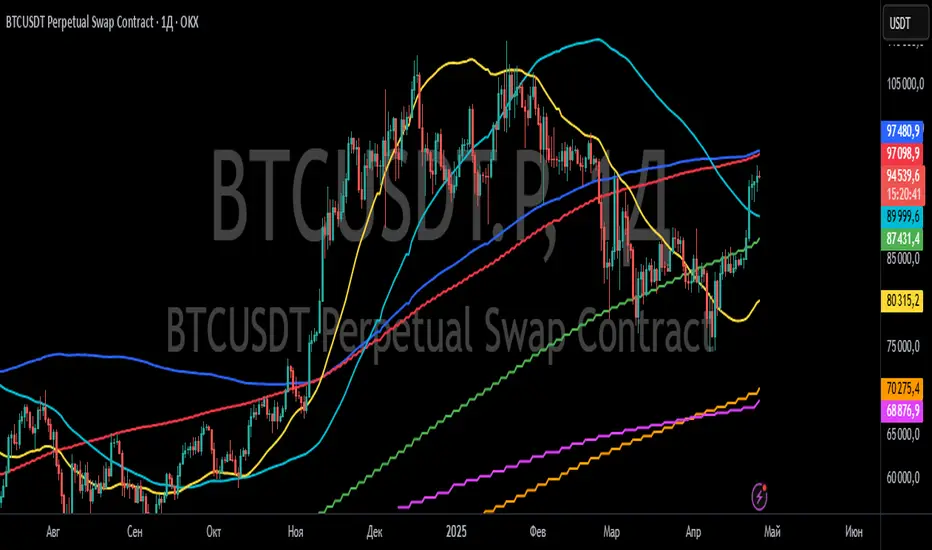
Red Light, Green Light Red Light, Green Light" is a comprehensive trading indicator designed for traders who need a clear, visual representation of market trends, applicable to any financial instrument and timeframe. It combines the analytical depth of three customizable moving averages with the visual simplicity of traffic lights. Users can adjust the length, MA type (including options like Donchian/Ichimoku baseline), source, and utilize multi-timeframe analysis, all enhanced with an offset feature for precise market alignment.
This indicator is ideal for users of Ichimoku Clouds, Donchian Channels, Price Action Scanners, Bollinger Bands, and moving average strategies, offering a new perspective in technical analysis.
The color system of the indicator simplifies trend identification:
Green indicates a strong bullish trend, suggesting traders consider long positions. This occurs when the short MA is above both the medium and long MAs, and the medium is also above the long MA.
Yellow signals caution in a bullish trend, pointing to potential consolidation or distribution phases. It appears when the short MA crosses below the medium MA while the medium remains above the long MA.
Orange reflects caution in a bearish trend, functioning similarly to yellow but under bearish conditions.
Red signifies a strong bearish trend, recommending short selling opportunities. It manifests when all MAs align in descending order, with the short MA at the lowest.
The 'cloud' feature, between the first two MAs, provides trend context akin to the Ichimoku Cloud but with a unique approach. While the Ichimoku system uses price position relative to the cloud to dictate trade bias, "Red Light, Green Light" relies on the color transitions of the MAs to guide trading decisions, with green and yellow for bullish scenarios and red and orange for bearish conditions.
Optimal use of "Red Light, Green Light" involves setting the moving average to the Donchian Baseline with default lengths of 20, 50, and 200, adjusting line thickness for visibility, and moderating cloud opacity as preferred.
Additionally, I developed this indicator primarily as a price action scanner to aid in identifying the most ideal financial instruments for trading based on their directional trends. It’s particularly useful for scanning through multiple timeframes of top-performing or bottom-performing stocks to discern which ones present the best trading opportunities. For instance, a stock that is consistently green from longer timeframes like 12M to 1D but shows yellow, orange, or red in shorter timeframes like 4H or 1H may be experiencing a minor pullback in an overall strong bullish trend, potentially signaling a buying opportunity. Conversely, in a bear market, consistent red in larger timeframes with green or yellow in shorter timeframes could indicate short-selling opportunities.
I recommend using this tool in conjunction with other indicators like Chris Moody’s Williams Vix Fix to enhance your market analysis and decision-making process.
I'm keen to receive feedback and learn about other tools on TradingView that can augment this price action scanning approach.

LineBreak Exponential Moving AverageThere are two types of charts. Timed and timeless ones.
The classic (timed) trading chart is the one shown on the right.
After each period closes, a candle closes.
Time defines the progress of this chart.
Then there are timeless charts, as shown on the left.
A candle closes only after price reaches a target, based on rules.
Price defines the progress of this chart.
Japanese invented most timeless charts to filter volatility and improve the visibility of trend changes.
To achieve consistency between these two different worlds, a simple but very useful EMA was developed.
This indicator transforms the timeless linebreak chart into a timed one to calculate EMA.
In this way, we have consistent behavior as being in a timed chart. Identical MA crossings and support/resistance.
The use of EMA is well known. It is not some new concept that needs further explanation.
The interpretation of LineBreak EMA is the same as the interpretation of your daily EMA.
Tread lightly, for this is line-broken ground.

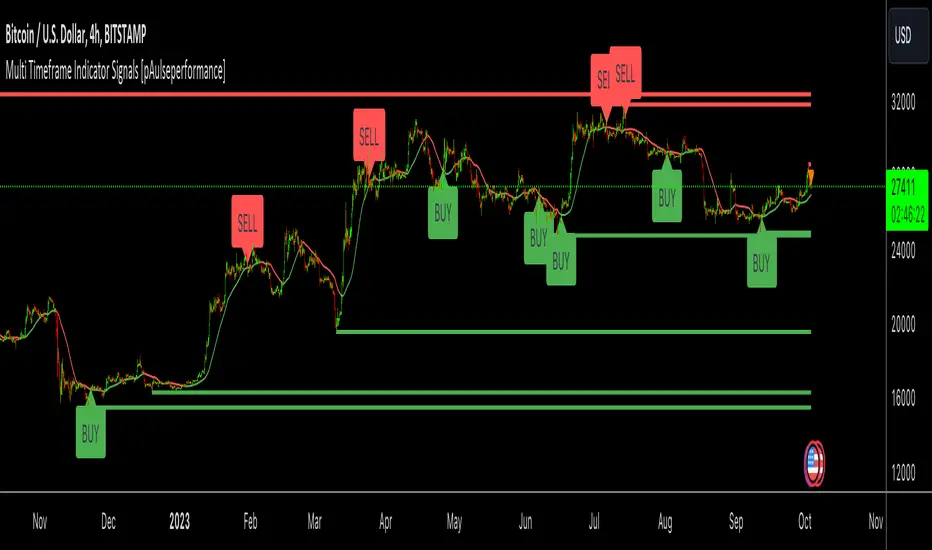
Multi Timeframe Indicator Signals [pAulseperformance]█ Concept:
In this TradingView Pine Script publication, we introduce a powerful tool that offers extensive capabilities for traders and analysts. With a focus on combining multiple indicators, analyzing various timeframes, and fine-tuning your trading strategies, this tool empowers you to make informed trading decisions.
█ Key Features:
1. Combining Multiple Rules with AND / OR Operations
• Example: You can combine the Relative Strength Index (RSI) with the Moving Average Convergence Divergence (MACD) by selecting the "AND" operation. This ensures that you only get a signal when both indicators generate signals. Alternatively, you can add custom indicators and select "OR" to create more complex strategies.
2. Selecting Multiple Indicators on Different Timeframes
• Analyze the same indicator on different timeframes to get a comprehensive view of market conditions.
3. Reversing Signals
• Reverse signals generated by indicators to adapt to various market conditions and strategies.
4. Extending Signals
• Extend signals by specifying conditions such as "RSI cross AND MA cross WITHIN 2 bars."
5. Feeding Results into Backtesting Engine
• Evaluate the performance of your strategies by feeding the results into a backtesting engine.
█ Available Indicators:
External Inputs
• Combine up to 4 custom indicators to assess their effectiveness individually and in combination with other indicators.
MACD (Moving Average Convergence Divergence)
• Analyze MACD signals across multiple timeframes and customize your strategies.
• Signal Generators:
• Signal 1: 🔼 (+1) MACD ⤯ MACD Signal Line 🔽 (-1) MACD ⤰ MACD Signal Line
• Signal 2: 🔼 (+1) MACD ⤯ 0 🔽 (-1) MACD ⤰ 0
• Filter 1: 🔼 (+1) MACD > 0 🔽 (-1) MACD < 0
RSI (Relative Strength Index)
• Utilize RSI signals with flexibility across different timeframes.
• Signal Generators:
• Signal 1: 🔼 (+1) RSI ⤯ Oversold 🔽 (-1) RSI ⤰ Overbought
• Signal 2: 🔼 (+1) RSI ⤰ Oversold 🔽 (-1) RSI ⤯ Overbought
• Filter 1: 🔼 (+1) RSI <= Oversold 🔽 (-1) RSI >= Overbought
MA1 and MA2 (Moving Averages)
• Choose from various types of moving averages and analyze them across multiple timeframes.
• Signal Generators:
• Filter 1: 🔼 (+1) Source Above MA 🔽 (-1) Source Below MA
• Filter 2: 🔼 (+1) MA Rising 🔽 (-1) MA Falling
• Signal 1: 🔼 (+1) Source ⤯ MA 🔽 (-1) Source ⤰ MA
Bollinger Bands
• Multi Time Frame
• Signal Generators:
• Signal 1: 🔼 (+1) Close ⤯ BBLower 🔽 (-1) Close ⤰ BBUpper
• Signal 2: 🔼 (+1) Close ⤰ BBLower 🔽 (-1) Close ⤯ BBUpper
Stochastics
• Customize your MTF Stochastics analysis between Normal Stochastic and Stochastic RSI.
• Signal Generators:
• Filter 1: 🔼 (+1) K < OS 🔽 (-1) K > OB
• Signal 1: 🔼 (+1) K ⤯ D 🔽 (-1) K ⤰ D
• Signal 2: 🔼 (+1) K ⤯ OS 🔽 (-1) K ⤰ OB
• Signal 3: 🔼🔽 Filter 1 And Signal 1
Ichimoku Cloud
• MTF
• Signal Generators:
• Signal 1: 🔼 (+1) Close ⤯ Komu Cloud 🔽 (-1) Close ⤰ Komu Cloud
• Signal 2: 🔼 (+1) Kumo Cloud Red -> Green 🔽 (-1) Kumo Cloud Green -> Red
• Signal 3: 🔼 (+1) Close ⤯ Kijun Sen 🔽 (-1) Close ⤰ Kijun Sen
• Signal 4: 🔼 (+1) Tenkan Sen ⤯ Kijun Sen 🔽 (-1) Tenkan Sen ⤰ Kijun Sen
SuperTrend
• MTF
• Signal Generators:
• Signal 1: 🔼 (+1) Close ⤯ Supertrend 🔽 (-1) Close ⤰ Supertrend
• Filter 1: 🔼 (+1) Close > Supertrend 🔽 (-1) Close < Supertrend
Support And Resistance
• Receive signals when support/resistance levels are breached.
Price Action
• Analyze price action across various timeframes.
• Signal Generators:
• Signal 1 (Bar Up/Dn): 🔼 (+1) Close > Open 🔽 (-1) Close < Open
• Signal 2 (Consecutive Up/Dn): 🔼 (+1) Close > Previous Close # 🔽 (-1) Close < Previous Close #
• Signal 3 (Gaps): 🔼 (+1) Open > Previous High 🔽 (-1) Open < Previous Low
═════════════════════════════════════════════════════════════════════════
Unlock the full potential of these indicators and tools to enhance your trading strategies and improve your decision-making process. With over 10 indicators and more than 30 different ways to generate signals you can rapidly test combinations of popular indicators and their strategies with ease. If your interested in more indicators or I missed a strategy, leave a comment and I can add it in the next update.
Happy trading!
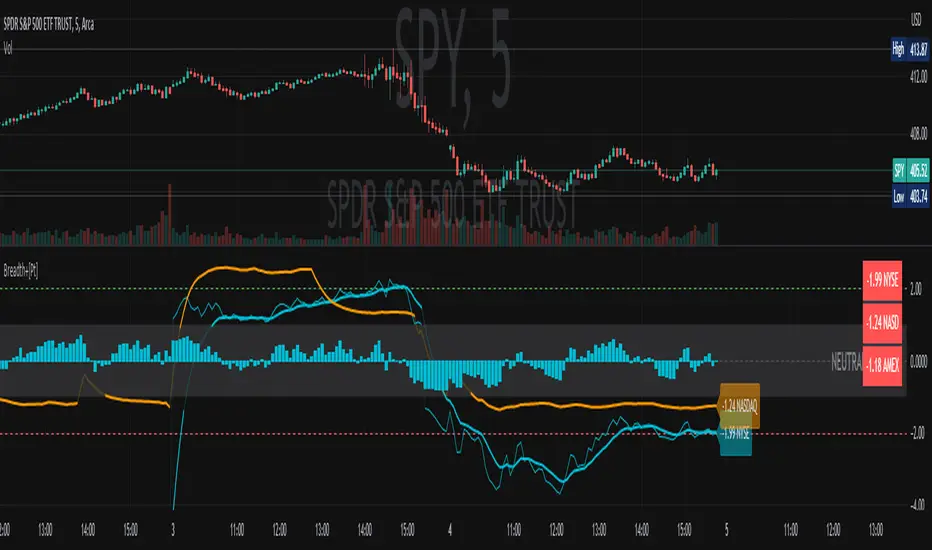
Market Breadth Ratio+ [Pt]This is a + version of my original Market Breadth Ratio Indicator
DESCRIPTION
The Market Breadth Ratio+ indicator is a tool that can help traders gain a more comprehensive understanding of market breadth by providing a ratio between Up volume (UVOL) and Down volume (DVOL).
While the VOLD indicator provides a straightforward measure of the difference between UVOL and DVOL, it doesn't account for the rate of change. The Market Breadth Ratio+ indicator, on the other hand, takes the rate of change into account, providing a plot line that is easier to interpret and understand.
The Up Volume vs Down Volume Ratios measure the strength of buying versus selling pressure in the market. A ratio greater than 1 indicates that there is more buying pressure, while a ratio less than -1 indicates more selling pressure. The ratio is calculated by dividing the total volume of stocks that closed up on the day by the total volume of stocks that closed down.
|| ------------------------------------------------------------------------------------------------------------------------------------------------------------------------------------||
This script includes the following premium unique features.
1) Custom Moving Average line for Breadth Ratio line. There are a few MA type to choose from: SMA, EMA, RMA, WMA, VWMA, HMA
- This feature provide a smoother plot for better interpretation of the market trend
- MA crossovers can also be used as trend reversal signals
2) Breadth Strength Index (BSI)
- This graph shows the relative strength of the Breadth Ratio. This is a momentum based oscillator that measure the rate of change of the Breadth Ratio. It shows the strength and weakness in the Breadth Ratio plot.
- A bar close to 1 means the market is very strong in the Bullish direction, conversely, a bar close to -1 means the market is very weak, but very strong in the Bearish direction
- Above 0 shows Bullish strength
- Below 0 shows Bearish strength
3) Two display modes for Breadth Strength Index
- Histogram
- Line
- These can be combined to show different markets together, such as NYSE and NASDAQ
4) Custom Moving Average can be applied to the BSI
- This will provide smoother graph for easier interpretation
5) Aggregated Market Strength
- This feature combines the BSI of multiple markets, such as NYSE and NASDAQ, to provide a more comprehensive view of the overall US market. Often time, one of these indices will have a stronger 'pull' on the entire market. By observing the dominant color (of your choosing), you can see which index is pulling the market. And by trading the market that has the bigger pull, traders can leverage on the possible higher volatility for greater trade opportunities.
6) Custom Moving Average can be applied to the Aggregated Market Strength
- This will provide smoother graph for easier interpretation
7) Show alternating trend colors on Aggregated Market Strength
- This provides an intuitive view of the market strength that's based on market breadth ratio
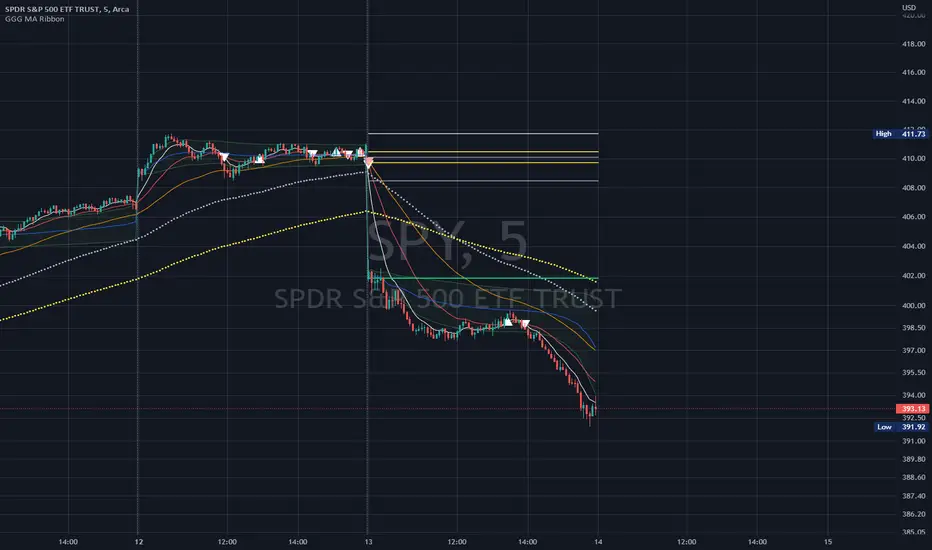
GoGoGadget MA RibbonMoving Average Ribbon with defaults for day-trading
8, 21, 50 EMAs
MA cross(over/under) markers
MA cross(over/under) alert conditions preconfigured
Reversal time periods highlight background or add labels for periods on standard days when reversals are likely (mainly useful for SPY or QQQ)
Dynamic ADX - [The Pine Guru]Dynamic ADX by The Pine Guru
What is the Dynamic ADX?
The Dynamic ADX is an indicator created using the regular ADX, Line, and additional ADX Moving Average. This MA allows the script to calculate the ADX differently to the original ADX, providing greater input and accessibility to the user. As the ADX is a volatility indicator, it is communicates to trend strength in the markets. The Dynamic ADX displays these trending Periods through user controlled visualizers like Fills, Background Color, and Bar Color.
How do I use the Dynamic ADX?
This indicator has 4 different "versions" or "conditions" in which it displays trend strength. These are achieved by checking and unchecking ADX, ADX MA and Line. Different combinations of these 3 inputs will result in a change of true condition that the script outputs.
Dynamic ADX Achieved by checking the ADX and ADX MA, results in an ADX similar to an MA Crossover, with the ADX being over the MA indicating a true or strong trend condition.
Regular ADX Achieved by Checking the ADX and Line. Results in the regular calculation of the ADX.
Mixture Achieved by Checking all three sections, which results in the calculation a normal ADX as well as the MA. Provides and extra condition or confluence into the ADX.
MA and Line Achieved by checking the ADX MA and Line. Results in a similar calculation to an original ADX but with a smoother MA.
Recommendations
This indicator will work typically in all markets with high volume and volatility. It is recommended that it is used as a confluence in a trading system, and not as an outright indicator. As always do your own testing before live use with this indicator. Do your own Research and refinements.
Please Leave a like if you enjoy this Indicator

[Fedra Algotrading Super Duper Trend Filter]All-in-one trend filter
Trend-following strategies are relatively easy to achieve, especially in backtesting. If only we knew what trend we were in! Let me help you:
- MAs crossovers
- Selection of the type of MAs
- Selection of MAs periods
-Super trend (optional)
-Trend zones based on trend lines (optional)
- Secret sauce
How to use it?
Do not open Longs if it is red
Don't open Shorts if it's green.
Apply it to your strategies and check the impact of a reliable trend filter before opening your entries.

Intraday JXMODI CrossCombination of two strategy.
MA Cross strategy + RSI strategy to decide whether the stock/crypto is currently overbought/oversold.
RSI alert when change from bull to bear, and vice verse.
Useful for quick entry and exit trade.
Whenever RSI Black color line Cross Red color MA line , Trend Changes.
For Bull side Trade on High of that candle & Stoploss Low of that candle in which Cross Occurs.(Green Shadow)
For Bear side Trade on Low of that candle & Stoploss High of that candle in which Cross occurs.(Red Shadow)
For more confirmation use SuperTrend etc indicators.

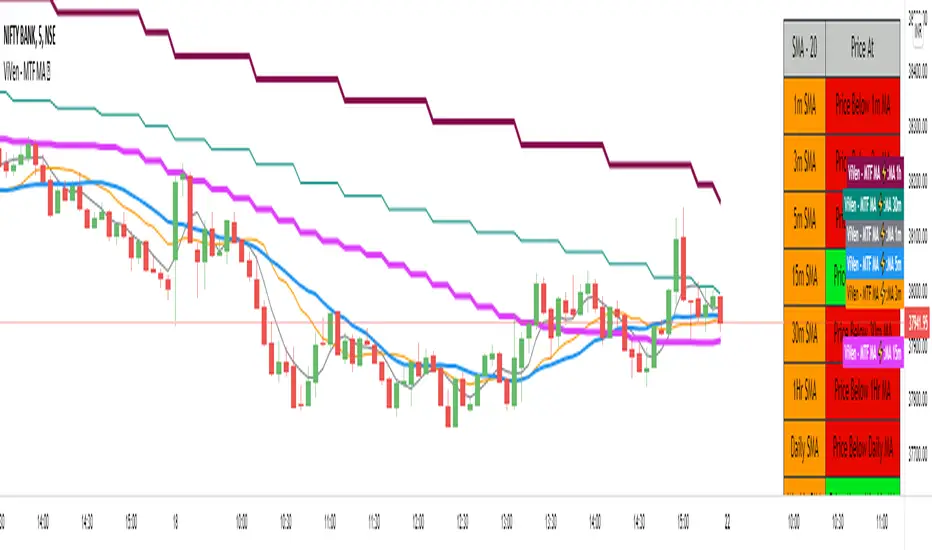
ViVen - Multi Time Frame - Moving Average StrategyHi Traders,
Indicator Description : Multiple Time Frame Moving Average lines in One Chart.
Moving Average Types : SMA, WMA, EMA
Moving Average Period : 20 Default (Variable up to 200)
MA Time Frame : 1m, 3m, 5m, 15m, 30m, 1Hr, Daily, Weekly, Monthly (All lines in one chart)
You can turn ON/OFF the moving average lines based on your requirement.
Moving Average Table : The table will give you an idea where the price is currently trading (LTP), if the price is above any of the moving average then it will show you the Price is above MA and wise versa.
Trading Method:
Monthly, Weekly, Daily and 1Hr Moving averages will tell you whether the script is in Bullish Trend or Bearish Trend.
Basically the moving averages will act as Support and Resistance Levels. With candle confirmation you can take trade.
Ready to Take Position - When 1m MA Crosses 3m MA (Upside / Downside)
BUY Strategy:
"Buy" - when 3m MA breaks 5m moving average on the upside. (Intraday/Scalp)
"Hold" - when 5m MA breaks 15m MA on the upside.
"Strong Hold" - when 15m MA breaks 1Hr MA on the upside for Long term.
"Exit" - when 3m MA breaks 5m MA on the Downside.
SELL Strategy:
"Sell" - when 3m MA breaks 5m moving average on the Downside. (Intraday/Scalp)
"Hold" - when 5m MA breaks 15m MA on the Downside. (Intraday)
"Strong Hold" - when 15m MA breaks 1Hr MA on the Downside. (Positional).
"Exit" - when 3m MA breaks 5m MA on the Downside.
If you agree with this strategy and works well please like this script, share it with your friends and Follow me for more Indicators.
In the next Version, I will come up with Strategy table that I have explained here.
Thanks for your support.
RobocanThis script is equipped with
🔵 Robo 2
It offers strategic trading entry and exit points. Truly unique tool for technical analysis for the financial market as it includes calculation of specific metrics like MACD, ATR and RSI.
🔵 Bull & Bear
The signal can be a fairly valuable tool. Momentum is one of those aspects of the market that is crucial to understanding price movements, yet it is so hard to get a solid grip on. It can be used in some instances to generate quality signals but much like with any signal generating indicator, it should be used with caution.
When indicator gives you " Bull " signal , short term momentum is now rising faster than the long term momentum. This can present a bullish buying opportunity.
When indicator gives you "Bear " signal, short term momentum is now falling faster then the long term momentum. This can present a bearish selling opportunity.
🔵 Robo's Cloud
The indicator inspired from Ichimoku CLoud, it uses an unique formula to generate clouds on its own system!
" BUY or ENTER "when the price breaks the Cloud in the direction of the breakout (UP ) and the cloud turns to green colour. Stay in the market until the cloud turns to red colour. Let's assume that You are a swing trader and use 1D candles as long as The candle is above the "green " cloud , you should continue with a trend! No need to hurry to sell until you see the " red " cloud.
🔵 Super Robo
It can perform greatly in a bull and bear market
It's unique algorithm find profitable coins based on "Early Bird + Buy 2 + Volume "gives you ENTRY and EXIT ideas
It works perfectly on the 1W - 3D - 1D charts
🔵 Hell & Moon
When the “Moon or Hell “closes below top of the closing price, a Moon - Buy signal is generated
It works perfectly on the 1W - 1D - 3H charts
🔵 Early Bird Signals
Being an early bird rather than a night owl will naturally lead you to become more successful in trading. There is no secret magic formula to success; this is something you must accept. Trading success is the result of a ‘simple’ list made up of four things: hard work, timing, persistence , and a good dose of Early Bird signals.
it provides high risk & high reward opportunities.
Dont use more than 3 Robo signals at the same time on the chart. Why?
Example, Robo 2 already included 3 different indicators in the formula.
Robo 2 : Truly unique tool for technical analysis for the financial market as it includes calculation of specific metrics like SAR + MACD + Price Movement that gives you ENTRY and EXIT ideas ( Buy 2 & Sell 2 )
If you use more than 3 robo signals, you try to use around " 10 - 12 " different indicators at the same time!
DON'T DO IT!
To get maximum results from your robo advisors, follow the advice below ;
A ) 3 robo signals
B ) 3 robo signals + 1 side strategy
A or B + Pick one bonus below
Dynamic Support Resistance,
Fibonacci Levels
Pivot Support Resistance
Robo signals :
Robo 1
Robo 2
Super EngineeringRobo
Robo 3
Robo 4
Bull & Bear
Hell & Moon
Early Bird
EngineeringRobo's cloud
Ultimate MA crossover strategy
Side strategies :
McGinley Dynamic
Bollinger Bands Strategy
MA 20 & MA 50
MA 50 & MA 200
EMA Trendlines
Robo ( 2 + 3 ) shows you that if the signals are covering each other. So, It is good to keep open it when you use Robo 2 and Robo 3 at the same time.
If you are following any signals, you should always wait for the candle close before buying or selling.
The signal can come and go anytime during the live candle. ALL indicators do that, that is not considered repainting.
Repainting is when a signal appears, the candle is closed, and when you refresh the chart it disappeared. It is logical that until the candle is closed the signal is not decided yet, hence the alert setup as Once per bar Close.
Deluxe never repaints! Yes, you heard it right: you will never have to worry about signal changing after the candle is closed.
________________________________________________________________________Timeframes_____________________________________________________________________
Our recommendations to get the best results:
Swing Trading Crypto : Use 1D Time Frame Candles
Swing Trading Stocks : Use 1W Time Frame Candles
Swing Trading Commodities : Use 1W Time Frame Candles
Day Trading Crypto : Use 3H Time Frame Candles
Day Trading Stocks : Use 1D Time Frame Candles
Day Trading Commodities : Use 1D Time Frame Candles
Not recommended any other time frames.
It gives you all the tools and information you need for day-to-day trading and investing, while also keeping a great buy and sell signals! No excuse to lose in any financial market anymore! Try now!
How can you add the algorithm into your chart?
1. Login to TradingView.com
2. From the homepage, click on ‘Chart’ in the top navigation bar
3. Select “Indicators” on the top-center-middle panel
4. In the indicator library, type "Robocan "
5. Use the website link below to obtain access to this indicator

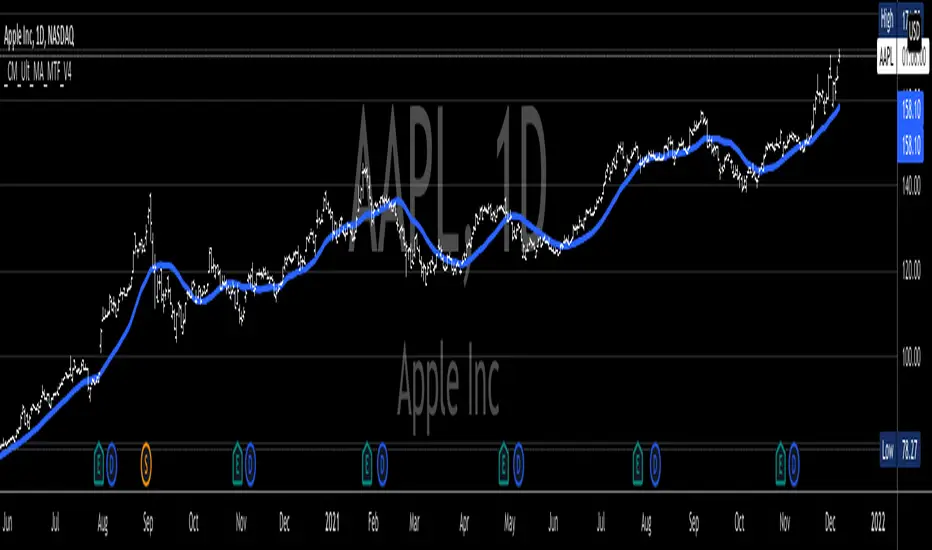
_CM_Ultimate_MA_MTF_V4***For a Detailed Video Overview Showing all of the Settings...
Click HERE to View Video
New _CM_Ultimate_MA_MTF_V4 - Update - 08-24-2021
Thanks to @SKTennis for help with code
Added Ability to Plot 1 or 2 Moving Averages - Fast MA & Slow MA
Added Ability to Plot Fast MA with Multi TimeFrame
Added Ability to Plot Slow MA with Multi TimeFrame
Added Ability to Color Fast MA Based on Slope of MA
Added Ability to Color Fast MA based on being Above/Below Slow MA
Added Ability to Plot 8 Types of Moving Averages
Simple, Exponential, Weighted, Hull, VWMA, RMA, TEMA, & Tilson T3
Added Ability to Set Alerts Based on:
Slope Change in the Fast MA Or Fast MA Crossing Above/Below Slow MA.
Added Ability to Plot "Fill" if Both Moving Averages are Turned ON
Added Ability to control Transparency of Fill
Added Alerts to Settings Pane.
Customized how Alerts work. Must keep Checked in Settings Pane, and When you go to Alerts Panel, Change Symbol to Indicator (_CM_Ultimate_MA_MTF_V4)
Customized Alerts to Show Symbol, TimeFrame, Closing Price, & Moving Average Signal Name in Alert
Alerts are Pre-Set to only Alert on Bar Close
See Video for Detailed Overview
New Updates Coming Soon!!!
***Please Post Feedback and Any Feature Requests in the Comments Section Below***
High time frame Pivot Anchored VWAP V1.0Purpose:
-----------
To provide VWAPs anchored on the high and low pivots. I have seen scripts which anchor VWAP on a session or time frame or indeed a time, but not yet one that anchors on pivot points.
Value:
--------
As many have stated, price action tends toward VWAPs. I named the VWAPs anchored on high pivots the Selling VWAP, representing the volume weighted average of the sellers. And the VWAPs anchored on the low pivots, Buying VWAP, representing the volume weighted average of the buyers.
One of these two governs the current price action.
What is unique about this script:
---------------------------------------
- Locates pivots also found in higher time frames (it does not use the Security Function, technically it does not locate high time frame pivots)
- It uses a simple technique to locate the pivots that avoids using "For Loops" , typically used with HTF Pivots and at times can cause time outs
- VWAPs are then anchored on the pivots
- High Pivots are anchored with a VWAP using the High price as the source
- Low Pivots are anchored with a VWAP using the Low price as the source
How to Use It
-----------------
- Choose the higher time frame pivots of interest, the script uses current time frame multiplier
- so on a 1 minute chart, 60 is 1 hour. On a 5 min chart the same multiplier would be 5 hours.
- Choose how many of the higher time frame bars define the pivot, the right side and left side
- the default is 8 and 4, for a 60 multiplier on a 1min chart it implies 4hrs right of the pivot and 8 hrs left of the pivot.
- A Vidya moving average is included
- When the ma crosses over the Selling VWAP then the system is dominated by the buyers and the Buying VWAP provides support
- When the ma crosses under the Buying VWAP then the system is dominated by the sellers and the Selling VWAP provides resistance
It helps by keeping you in a trade, also by using the support/resistance to add to a position.
I make those decisions in the script, and display only the dominating VWAP
Acknowledgements
------------------------
PineCoders for their functions on managing resolution.
LucF for his work on high time frame pivots.
Future considerations
--------------------------
- Provide option to show both VWAPs
- Use a different ma, such as VWMA, or provide a choice.
- Open the script, version 1.0 being what it is