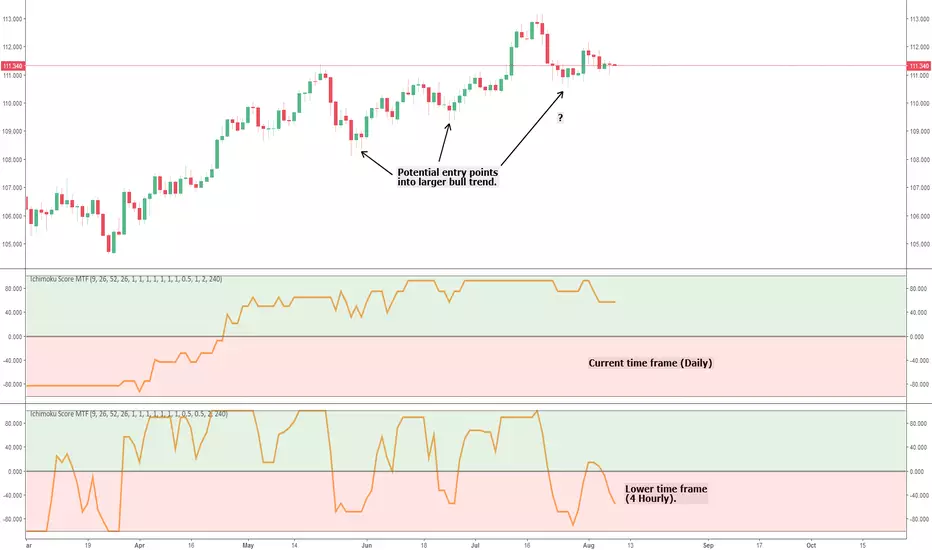
Ichimoku Cloud Score MTFThis is a simple multi time frame (MTF) conversion of the Ichimoku Cloud Score indicator.
All credit goes to the following users for the initial implementations:
- User @dashed :
- User @sjb933 :
This script calculates the Cloud Score based on the sjb933 version; all I've done is convert the script to Pinescript version 3 (to ensure the security function works as intended) and add MTF capability.
I'm a big fan of MTF analysis when using indicators (particularly oscillators). Using a higher time frame runs into the issue of the indicator repainting until the relevant higher time frame candle closes (this is inevitable and logical - so don't comment saying it repaints!). However, for lagging indicators such as this one, adding a lower time frame provides potential entry and exit signals into the larger trend, and also provides early warning of large trend shifts before the current time frame will. This can give you more control over your trades, and in my experience helps lagging indicators such as Ichimoku stay relevant in high volatility markets that are vastly different from when the indicators were conceived.
Any queries please let me know.
Cheers,
RJR
在腳本中搜尋"mtf"
MTF Dashboard Pro v2.3 © 2025 - Sachin ThakareMTF Dashboard Pro v2.3 — A premium multi-timeframe market dashboard created for professional traders.
Features include:
• MTF EMA Trend (9/21)
• MTF 200 MA System with Threshold Logic
• Session-based VWAP (Daily Reset)
• SuperTrend (Corrected Direction Engine)
• RSI / MACD / ADX / Alligator
• Stochastic (Correct Pine Signature)
• Daily PDH / PDL Bias
• 11-Signal Institutional Bias Score
• Trend Strength Classification (Strong Bull → Strong Bear)
• Multi-TF Alerts for Strong Bull / Strong Bear
• Optimized Table Engine & Enhanced Performance
Designed for Scalping, intraday, swing, and high-precision market bias evaluation across 3m → 1M timeframes.
Built & optimized by Sachin Thakare (2025 Edition).

MTF Stoch RSI Confluence + Combined AlertMTF STOCH RSI CONFLUENCE INDICATOR 1m/5m/15m ( Scalping Indicator added on SRSI 1H)
IF all three Stoch are overbought(above 80) the indicator creates a red vertical line. If all Stoch are oversold(below 20) the indicator creates a green vertical line.
RULES!!!!
NEVER TRADE AGAINST THE TREND!!! This is super important!!!!
If 1H SRSI is above 80 with MTF overbouht and ZC is red (Downtrend) then we open a MR Short- (Prefered at PA Spikes) The same for opposites MR Longs.
If 1H SRSI is above 80 with the MTF oversold and ZC green then we can open a Long position. Prefered Momo Long. The same applies for opposite, hence momo short.

MTF RSI & SMA Crossover [OB/OS Filtered Signals]MTF RSI & SMA Crossover
This custom indicator combines the power of Multi-Timeframe (MTF) RSI, Simple Moving Average (SMA), and overbought/oversold (OB/OS) conditions to provide precise buy and sell signals based on the crossovers of the RSI and its SMA. The indicator includes the following features:
MTF RSI: The Relative Strength Index (RSI) is calculated on a customizable timeframe, giving traders the ability to analyze price momentum across different timeframes.
SMA of RSI: The RSI is smoothed using a Simple Moving Average (SMA), helping to filter out market noise and identify clearer trend reversals.
Overbought/Oversold Filter: Signals are only triggered when the RSI has been in an overbought (above 70) or oversold (below 30) condition, improving the reliability of potential trend reversals.
Buy/Sell Signals:
Buy signals occur when the RSI crosses above its SMA after being oversold, indicating potential upward momentum.
Sell signals occur when the RSI crosses below its SMA after being overbought, indicating potential downward momentum.
Customizable Label Colors: Choose your own colors for the "BUY" and "SELL" labels to match your chart's design and preferences.
Alerts: Set alerts for buy and sell signals, ensuring you don't miss a potential trade.
This indicator is ideal for traders who want to capture trend reversals and momentum shifts while filtering out false signals by using overbought and oversold conditions. Customize the settings to suit your trading style and strategy.

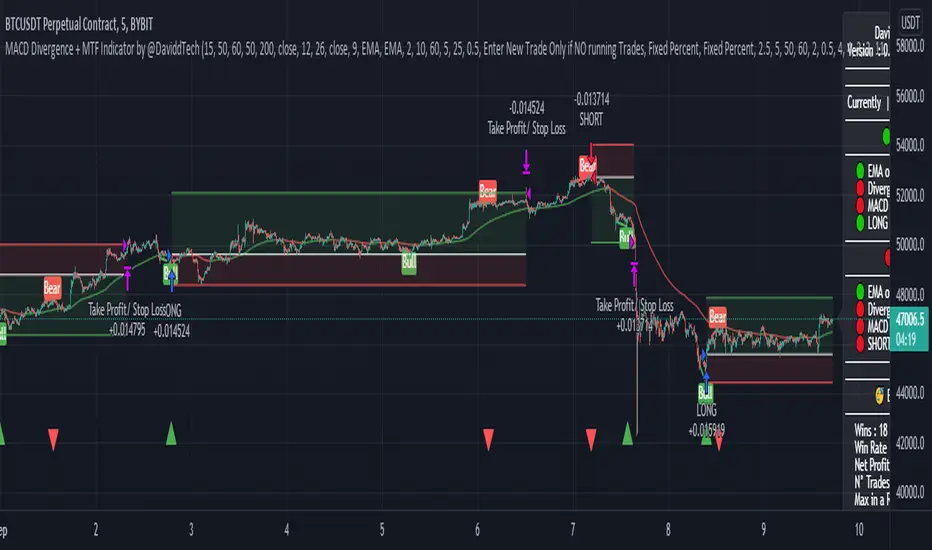
MACD Divergence + MTF EMA Reversal by @DaviddTechMACD Divergence + MTF Indicator / EMA by @DaviddTech
Long :
* Find Divergence in the MACD line
* Multi Time Frame EMA 50 15 minutes above Multi Time Frame EMA 50 60 minutes
* MACD and Signal line are below the 0 line
* MACD crosses above the Signal line
Short :
* Find Divergence in the MACD line
* Multi Time Frame EMA 50 15 minutes below Multi Time Frame EMA 50 60 minutes
* MACD and Signal line are above the 0 line
* MACD crosses below the Signal line
EMA usages instead.
* I found that as a strategy this could work better with the 200 EMA line.
* Trends reversals also gave good results.
Trend Reversals :
* Price is below EMA 200 - Take LONG on divergence.
* Price is above EMA 200 - Take SHORT on divergence.
** You may need to turn off MTF ema when using the Simple EMA 200
WARNING:
- For purpose educate only - My mission is to debunk fake strategies with code to find THE ONE.
- Plots EMAs and other values on chart.
- This script to change bars colors.
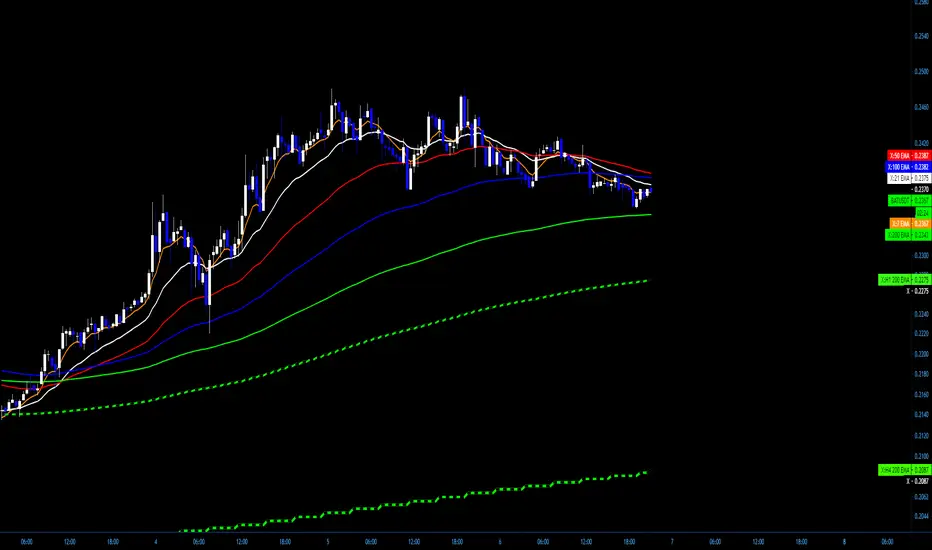
X+ - SMA/EMA Suite with MTF
I often use a mix of EMAs and SMAs in my analysis and turning them on and off and adding and removing them from the chart becomes a bit of a burden.
In this script you'll find the most common EMAs and SMAs that I use on just about every chart I look at.
If the feature ever becomes available to save settings as templates from within the script, then I will do that but for now there are two work-arounds.
www.dropbox.com
Work-Around 1: Create the suite that you want recalled by selecting what Moving Averages you want and then SAVE AS AN INDICATOR TEMPLATE. This has a fairly quick recall and you'll be able to access one that says "all EMA's" or "all SMAs" or "SMA/EMA for H4 Chart with MTF". Whatever you want.
That may work for some traders but others don't want the fuss of having their other indicators in the way or being added or removed from their templates, etc.
Work-Around 2: Add two instances or even three, whatever. I personally use two because the select on and select off can be a hassle when dealing with so many options.
I essentially use one that I have selected when I am looking at Daily or Higher Charts and then I hide that one an unhide the other one that is already setup for lower timeframe charts, from the M1 to the H4.
This allows me to run two full suites. I was looking for a way to save settings like we can with the Fibonacci tool but I simply could not find a solution. So, this will have to do.
The MTF - Multi-Time-Frame
I have it coded to display the 20 SMA from the M30, H1 and H4 Charts - no matter what timeframe you are currently viewing.
I also have the 200 EMA from the same charts (M30, H1, H4)
The Settings can be changed but the readout on the scales will stay 20 and 200.
www.dropbox.com
You can change the SMA and the EMA to whatever you want as well as the Source, an offset if desired and the timeframe from which it will display from.
Above is a screenshot of an H4 Chart with only the MTFs. So you will see the 20 SMA from the M30 as well as the H1 and H4. They have a checkered style to them that can be customized in the settings. Those are White and Black.
The Green and Black are the 200 EMAs from the M30 and the H1 and H4.
www.dropbox.com
If you want to be able to see the Label on the scale, you can head to Settings/Scales and Tick on "Indicator Name Label"
www.dropbox.com
www.dropbox.com
I have a pretty specific color format that I follow but I do a lot of teaching. For me, it's far easier to have the readout of what line is what right on the chart:
7 EMA is the 7 EMA and not just "EMA" or something even longer that takes up a good portion of your screen when you turn on the indicator name label option.
Anyway, I hope somebody finds a use for this and if so, Awesome.
Above are just some ideas of how I use it.
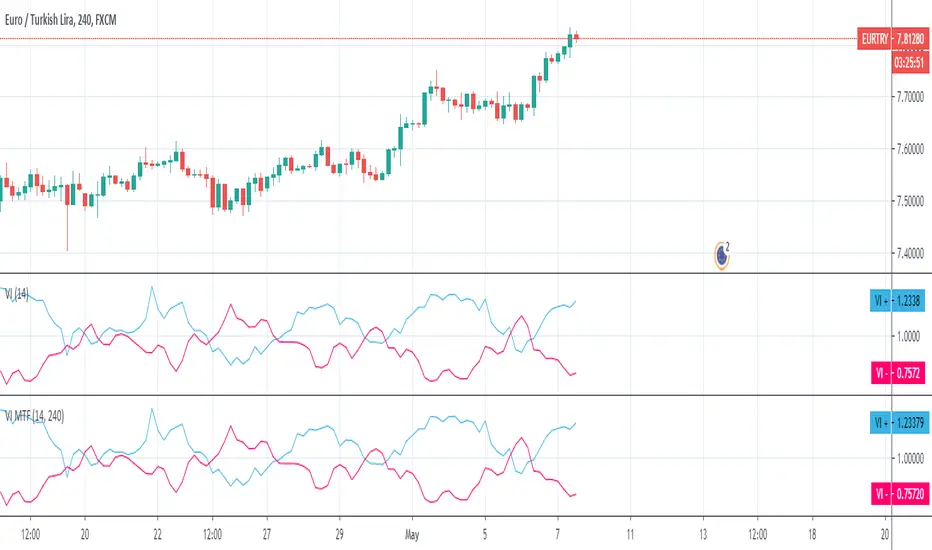
Vortex MTFUnderstanding Vortex Indicator (VI)
The vortex indicator was first developed by Etienne Botes and Douglas Siepman who introduced the concept in the January 2010 edition of “Technical Analysis of Stocks & Commodities.” The vortex indicator is based on two trendlines: VI+ and VI-.
What is the Vortex Indicator (VI)?
A vortex indicator (VI) is an indicator composed of two lines - an uptrend line (VI+) and a downtrend line (VI-). These lines are typically colored green and red respectively. A vortex indicator is used to spot trend reversals and confirm current trends.
Vortex Indicator Calculations
The calculation for the indicator is divided into four parts.
1. True range (TR) is the greatest of:
Current high minus current low
Current high minus previous close
Current low minus previous close
2. Uptrend and downtrend movement:
VM+ = Absolute value of current high minus prior low
VM- = Absolute value of current low minus prior high
3. Parameter length (n)
Decide on a parameter length (between 14 and 30 days is common)
Sum the last n period’s true range, VM+ and VM-:
Sum of the last n periods’ true range = SUM TRn
Sum of the last n periods’ VM+ = SUM VMn+
Sum of the last n periods’ VM- = SUM VMn−
4. Create the trendlines VI+ and VI-
SUM VMn+/SUM TRn = VIn+
SUM VMn-/SUM TRn = VIn−
Repeating this process daily forms the VI+ and VI- trendlines.
The traditional application of using VI- and VI+ crossovers can result in a number of false trade signals when price action is choppy. Increase the number of periods used in the indicator to reduce this, for example, using 25 periods instead of 14.
What is MTF?
Multiple Time Frame Analysis is the technique of analyzing several time frames of the same asset before entering a trade. This type of analysis is best done using a top-down approach, i.e. starting at a higher time frame and working your way down, via several lower time frames, until the execution time frame is reached where a trade could be entered. Traders who use this technique usually look at 3 or 4 different time frames to identify the general trend and find the best entries. They minimize their risk and improve the odds of success simply by taking the bigger picture into account. It can easily be combined with any trading strategy.
Time frames are usually several times apart. For example a day trader who trades hourly charts, could analyse the weekly (high time frame), the daily (7 times smaller), the 4 hour (6 times smaller) and finally the hourly time frame (execution time frame, 4 times smaller). TradingView has a chart layout feature with multiple charts per layout, so you can analyse an asset on multiple time frames under one tab in your browser.
Summary
With MTF, you can see the Vortex indicator values for a specific time period without changing the graph time period.
Smooth HA / Hull MA / MTF===========
Smooth HA / Hull MA / MTF
===========
A combination of a Smoothed Heikin Ashi Chart Line and a Hull MA Line, paints a "Long" or "Short" alert when the Hull MA changes color - editable settings for the smoothing of HA data and Hull MA Length; you can also change the time frame used (must be the same or longer as the chart).
-----------
This indicator does a real good job at finding highs and lows (otherwise known as entry and exit points!) picking up on just about every large, decent swing and making the most from those big moves! The disadvantage of all Smoothed HA strategies are when times are choppy or ranging - given the natural lag of the indicator you can be sure in choppy times you'd be buying at the top and selling at the bottom almost every time ~ No indicator is perfect!
This Smooth HA/Hull MA indicator also has a built in MTF function (Multi-Time-Frame). This means you can be using a 1hr chart and set the indicator to a 4hr chart - generally any movements on a greater time frame will overcome any movements of the smaller time frame, so this is where you should be gathering data about which direction the market is moving - as always, follow the trend.
Hope (like always) this is of at least some use to some people.
Good Luck and Happy Trading!

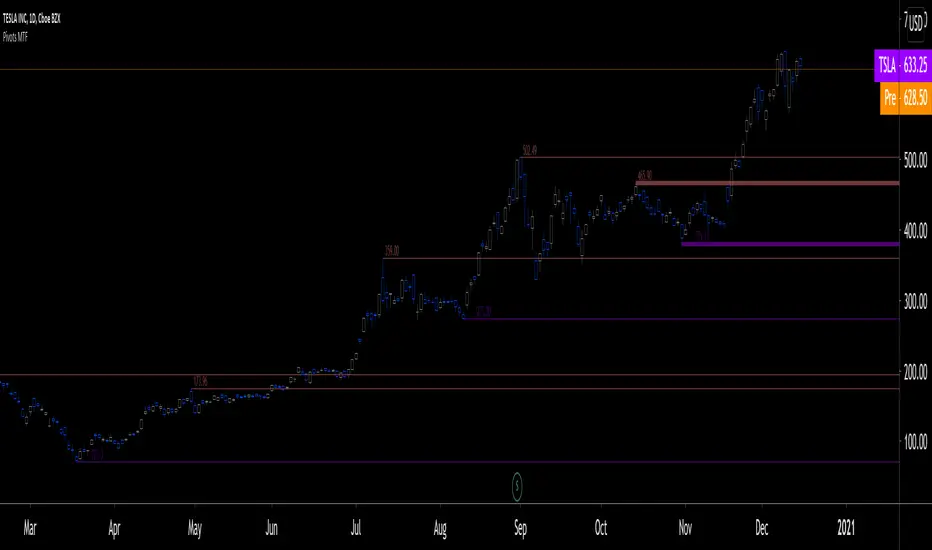
Pivots MTF [LucF]Pivots detected at higher timeframes are more significant because more market activity—or work—is required to produce them. This indicator displays pivots calculated on the higher timeframe of your choice.
Features
► Timeframe selection
— The higher timeframe (HTF) can be selected in 3 different ways:
• By steps (15 min., 60 min., 4H, 1D, 3D, 1W, 1M, 1Y). This setting is the default.
• As a multiple of the current chart's resolution, which can be fractional, so 3.5 will work.
• Fixed.
— The HTF used can be displayed near the last bar (default).
— Note that using the HTF is not mandatory. If it is disabled, the indicator will calculate on the chart's resolution.
— Non-repainting or repainting mode can be selected. This has no impact on the display of historical bars, but when no repainting is selected, pivot detection in the realtime bar will be delayed by one chart bar (not one bar at the HTF).
► Pivots
— Three color schemes are provided: green/red, aqua/pink and coral/violet (the default).
— Both the thickness and brightness of lines can be controlled separately for the hi and lo pivots.
— The visibility of the last hi/lo pivots can be enhanced.
— Prices can be displayed on pivot lines and the text's size and color can be adjusted.
— The number of bars required for the left/right pivot legs can be controlled (the default is 4).
— The source can be selected individually for hi and lo pivots (the default is hlc3 and low .
— The mean of the hi/lo pivot values of the last few thousand chart bars can be displayed. Pivots having lasted longer during the mean's period will weigh more in the calculation. The mean can be displayed in running mode and/or only showing its last level as a long horizontal line. I don't find it very useful; maybe others will.
► Markers and Alerts
— Markers can be configured on breaches of either the last hi/lo pivot levels, or the hi/lo mean. Crossovers and crossunders are controlled separately.
— Alerts can be configured using any of the marker combinations. As is usual for my indicators, only one alert is used. It will trigger on the markers that are active when you create your alert. Once your markers are set up the way you want, create your alert from the chart/timeframe you want the alert to run on, and be sure to use the “Once Per Bar Close” triggering condition. Use an alert message that will remind you of the combination of markers used when creating the alert. If you use multiple markers to trigger one alert, then having the indicator show those markers will be important to help you figure out which marker triggered the alert when it fired.
A quick look at the pattern of these markers will hopefully convince you that using them as entry/exit signals would be perilous, as they are prone to whipsaw. I have included them because some traders may use the markers as reminders.
Using Pivots
These pivots can be used in a few different ways:
— When using the high / low sources they will show extreme levels, breaches of which should be more significant.
— Another way to use them is with hlc3 (the average of the high , low and close ) for hi pivots and low for the lo pivots. This accounts for my personal mythology to the effect that drops typically reach previous lows more easily than rallies make newer highs.
— Using low for hi pivots and high for lo pivots (so backward) can be a useful way to set stops or to detect weakness in movements.
You will usually be better served by pivots if you consider them as denoting regions rather than precise levels. The flexibility in the display options of this indicator will help you adapt it to the way you use your pivots. To indicate areas rather than levels, for example, try using a brightness of 1 with a line thickness of 30. The cloud effect generated this way will show areas better than fine lines.
Realize that these pivot lines are positioned in the past, and so they are drawn after the fact because a given number of bars need to elapse before calculations determine a pivot has occurred. You will thus never see a pivot top, for example, identified on the realtime bar. To detect a pivot, it takes a number of bars corresponding to the dilation of the higher timeframe in the current one, multiplied by the number of bars you use for your pivots' right leg. Also note that the Pine native function used to detect pivots in this indicator considers a summit to be a top when the number of bars in each leg are lower or equal to that top. Bars in legs do not need to be progressively lower on each side of the pivot for a pivot to be detected.
If you program in Pine
— See the Pinecoders MTF Selection Framework for an explanation of the functions used in this script to provide the selection mechanism for the higher timeframe.
— This code uses the Pine Script Coding Conventions .
Thanks
— To the Pine coders asking questions in the Pine Script chat on TV ; your questions got me to write this indicator.
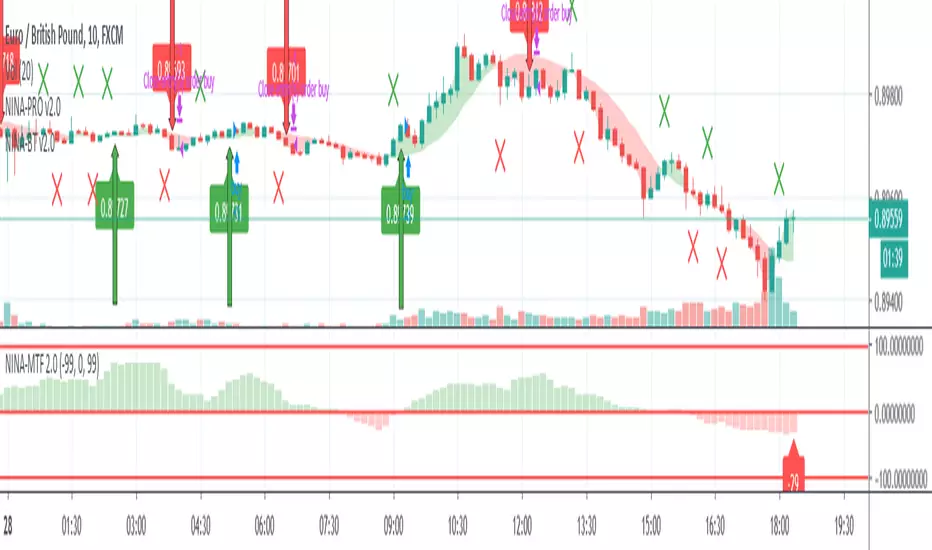
NINA-MTFHello Fellow Traders !
KikingAlgo has produced another amazing tool which is now fully operational and ready.
This Algo is called NINA-MTF (Multi Time Frame) and is based on mathematical formula over 11 timeframes to create trend signals based on the current market conditions.
The Algo can operate on any market, any pair in any timeframe and shows a clear trend direction and strength.
This is a PRO MFT version of NINA - drop private message for details.
Regards
KikingAlgo

B3 Bar Cycle MTFThis is an interesting study that can be used as a tool for determining trend direction, and also could be a trailing stop setter. I use it as a gauge on MTF settings, in the pic MTF is turned off. If on, you can look at the bar cycle of the 1h while on the 15m giving you a lot of information in one tool. If a line is missing high or low, it is because it was broken, if both exist you are trading in range and cloud appears. If both sides break you get thick gray boxes above and below bar.
Get used to editing the inputs to suit your liking. Often 3-5 length and always looking at different resolutions to get a big picture story. You could put multiple instances of the study up to see them simultaneously. I based the idea off of Krausz's 3 day cycle which you can read about in his teachings. I tend to find it looking better using Heikin Ashi bar-style.

MTF OB & FVG detector w/ Alerts v2# MTF Order Blocks & Fair Value Gaps Detector with Alerts v2
## Overview
This indicator combines **Multi-Timeframe Order Blocks (OB)** and **Fair Value Gaps (FVG)** detection with integrated bounce alerts. It displays Order Blocks and Fair Value Gaps across multiple timeframes simultaneously and generates real-time alerts when price bounces from these critical zones.
## Key Features
### 🎯 Multi-Timeframe Order Blocks Detection
- **Volumetric Analysis**: Each Order Block displays total volume and dominant side percentage
- **Multiple Timeframes**: Supports 1min, 3min, 5min, 15min, and 60min timeframes
- **Smart Combining**: Automatically merges overlapping Order Blocks from different timeframes into powerful confluence zones
- **Dynamic Extension**: Order Blocks extend until broken, providing clear visual guidance
- **Volume Distribution**: Shows bullish vs bearish volume breakdown with percentage
### 📊 Fair Value Gaps (FVG) Detection
- **Lightweight Processing**: Works on current chart timeframe only for optimal performance
- **Volume Metrics**: Displays FVG volume and dominant side percentage
- **Mitigation Tracking**: Automatically tracks when FVGs are filled or broken
- **Customizable Mitigation Source**: Choose between close price or high/low wicks
### 🔔 Comprehensive Alert System
- **Bounce Alerts**: Get notified when price bounces from OB or FVG zones
- **New Formation Alerts**: Alerts when new Order Blocks or Fair Value Gaps form
- **Combined Zone Alerts**: Special alerts when multiple Order Blocks merge into strong confluence zones
- **Customizable Thresholds**: Set minimum number of combined OBs required for strong zone alerts
### 🎨 Visual Customization
- **Inverted Color Schemes**: Optional inverted colors for both OB and FVG
- OB: Choose between traditional (Bullish=Blue, Bearish=Red) or inverted (Bullish=Red, Bearish=Blue)
- FVG: Choose between Bullish=Orange/Bearish=Aqua or inverted
- **Clean Labels**: Shows timeframe, zone type, volume, and dominant percentage
- **Combined Tags**: Optional labels for merged zones
- **Adjustable Extension**: Control how far zones extend into the future
## How It Works
### Order Blocks
Order Blocks identify institutional trading zones where large players have placed significant orders. The indicator:
1. Detects swing highs/lows using configurable swing length
2. Identifies the last opposing candle before a strong move
3. Analyzes volume distribution (bullish vs bearish)
4. Tracks zone validity until price breaks through
5. Combines overlapping zones from multiple timeframes
### Fair Value Gaps
Fair Value Gaps represent price imbalances that often get filled. The indicator:
1. Identifies 3-candle patterns with gaps between candles
2. Filters gaps by size percentile to show only significant ones
3. Calculates volume distribution within the gap
4. Tracks mitigation when price returns to fill the gap
5. Extends gaps dynamically until filled
### Bounce Detection
The indicator detects bounces using a two-step process:
1. **Touch Phase**: Tracks when price enters a zone (touchedInside flag)
2. **Bounce Phase**: Confirms bounce when price exits the zone in the expected direction
- Bullish zones: Price closes above top after touching inside
- Bearish zones: Price closes below bottom after touching inside
## Settings Guide
### General Configuration
- **Show Historic Zones**: Display invalidated/broken zones
- **Zone Invalidation**: Choose between wick or close for break detection
- **Combine Overlapping Order Blocks**: Merge OBs from different timeframes
- **Swing Length**: Controls sensitivity (smaller = more OBs, larger = fewer OBs)
- **Zone Count**: Choose from High/Medium/Low/One per timeframe
- **Invert Colors OB**: Swap bullish/bearish color scheme
### Alert Settings
- **Enable Alerts**: Master switch for all alerts
- **Alert on Bullish/Bearish Bounce**: Choose which bounce directions to monitor
- **Alert on New OB Formation**: Get notified when new Order Blocks form
- **Alert on Combined OBs**: Alerts for strong confluence zones
- **Min OBs for Strong Zone Alert**: Threshold for combined zone alerts (default: 2)
### Fair Value Gaps
- **Show Fair Value Gaps**: Toggle FVG display
- **FVG Mitigation Source**: Choose close or high/low for mitigation detection
- **Bullish/Bearish FVG**: Enable/disable each type
- **Invert FVG Colors**: Swap FVG color scheme
### Multi-Timeframe
- **Show Lower Timeframes**: Display OBs from timeframes lower than chart
- **Individual Timeframe Toggles**: Enable/disable 1min, 3min, 5min, 15min, 60min
### Style
- **Text Color**: Customize label text color
- **Extend Zones**: Set extension length in bars (default: 40)
- **Show Tag**: Display combined indicator in merged zone labels
## Usage Tips
### For Day Trading
- Enable 1min, 3min, and 5min timeframes
- Use "High" zone count for more trading opportunities
- Watch for bounces from combined zones (highest probability)
### For Swing Trading
- Enable 15min, 60min, and higher timeframes
- Use "Medium" or "Low" zone count for major zones only
- Focus on combined zones with 3+ timeframes
### For Scalping
- Use current timeframe only (disable MTF)
- Enable both OB and FVG
- Set up alerts for quick bounce notifications
### Alert Setup
1. Click "Create Alert" in TradingView
2. Choose from available alert conditions:
- **Bullish Bounce (OB/FVG)**: Long entry opportunities
- **Bearish Bounce (OB/FVG)**: Short entry opportunities
- **New OB Formation**: Early zone identification
- **Strong Combined Zone**: High-probability confluence areas
3. Set alert frequency to "Once Per Bar Close" to avoid false signals
## Technical Details
### Performance Optimizations
- Maximum 100 boxes/labels for efficient rendering
- Lightweight FVG processing on current timeframe only
- Dynamic memory management with array size limits
- Selective rendering of active zones only
### Calculations
- **ATR Multiplier**: Zones exceeding 3.5x ATR are filtered out
- **Volume Percentage**: `max(bullVol, bearVol) / totalVolume × 100`
- **FVG Size Filter**: Uses 100th percentile of last 1000 gaps
- **Overlap Detection**: Uses intersection/union ratio for combining zones
## Credits & License
This indicator combines and enhances concepts from:
- "Volumized Order Blocks" methodology
- "Volumatic Fair Value Gaps" approach
**License**: Mozilla Public License 2.0 (MPL-2.0)
## Disclaimer
This indicator is provided for **educational and informational purposes only**. Trading involves substantial risk of loss and is not suitable for every investor. Past performance is not indicative of future results. Always do your own research and consult with a licensed financial advisor before making trading decisions.
## Version History
**v2 (Current)**
- Combined OB and FVG into single indicator
- Added comprehensive alert system
- Improved performance with lightweight FVG processing
- Enhanced bounce detection with touch-inside logic
- Added volume metrics to zone labels
- Implemented dynamic zone extension until broken
- Added combined zone detection with configurable thresholds
---
### Chart Examples
The indicator displays:
- **Red Zones** (Inverted): Bullish Order Blocks / Bearish FVGs
- **Blue Zones** (Inverted): Bearish Order Blocks / Bullish FVGs
- **Orange Zones** (Inverted): Bullish Fair Value Gaps
- **Aqua Zones** (Inverted): Bearish Fair Value Gaps
Each zone shows:
- Timeframe label (e.g., "5m", "15m", "1H")
- Zone type (OB or FVG)
- Total volume in millions (e.g., "12.5M")
- Dominant side percentage (e.g., "85%")
**Example Label**: ` 5m & 15m OB 45.2M (78%)`
- Combined zone from 5min and 15min timeframes
- Order Block type
- 45.2 million total volume
- 78% volume on dominant side
---
## Support & Updates
For issues, suggestions, or questions, please leave a comment on the indicator page.
**Author**: © rasukaru666
**Compatible with**: TradingView Pine Script v6

MTF Market Structure Pro [Elykia]MTF Market Structure Pro - Fractal Flow System
Overview
The MTF Market Structure Pro is a comprehensive trading system designed to decode the fractal nature of the markets.
Most traders fail because they focus on a single timeframe, missing the "Big Picture". This algorithm simultaneously maps market structure (Highs/Lows) across 3 distinct timeframes overlaid on your chart.
It automatically identifies trends, pivot points, and price inefficiencies (EPA/FVG), giving you an X-ray vision of institutional order flow.
💎 The Strategy: "Fractal Alignment"
This tool is optimized for the "Triple Sync" strategy. Never trade against the macro trend.
1. The Bias (Sequence C / TF3): Look at the highest structure (e.g., H4). If the markers are Green/Ascending (HH/HL), the flow is Bullish. Look for buys only.
2. The Retracement (Sequence B / TF2): On the intermediate timeframe (e.g., M15), wait for price to pull back into an inefficiency zone (dashed "EPA" lines) or test a previous structural level.
3. The Entry (Sequence A / TF1): This is your trigger (e.g., M1 or M5). Wait for the structure to realign with Sequence C.
Buy Signal: TF3 is Bullish + Price retraces + TF1 breaks structure to the upside (creating a new HH).
Key Features
⚡ Multi-Timeframe Analysis (3-Layer): Displays 3 independent structures (A, B, C) with distinct colors for instant readability.
📊 Smart Dashboard: A summary panel shows real-time Trend (Bull/Bear) and Market State (Balanced or Open Gap) for each Timeframe.
🎯 Inefficiency Lines (EPA): Automatically plots unvisited price zones (Imbalances) that act as magnets for price action.
⚙️ 100% Customizable: Choose your timeframes, colors, and dashboard position.
Settings Guide
Sequence A: Your execution timeframe (e.g., Current Chart or M5).
Sequence B: Your intraday trend (e.g., M15 or H1).
Sequence C: Your macro bias (e.g., H4 or Daily).
Tip: Ensure you use distinct colors for each sequence to keep the chart clean.
⚠️ DISCLAIMER
This indicator is a technical analysis support tool and does not constitute financial advice. Trading involves a risk of capital loss. Past performance does not guarantee future results.

MTF Stoch RSI + MACD Summary“MTF Stoch RSI + MACD Summary” is a multi-timeframe momentum and trend analysis indicator designed for TradingView. Its primary function is to consolidate Stochastic RSI and MACD readings from multiple user-defined timeframes—ranging from weekly to intraday—into a compact, color-coded summary table. This allows traders to assess the alignment or divergence of momentum and trend signals across different time horizons within a single chart view, providing an efficient means to identify potential trend continuations or reversals.
The script begins by defining input parameters for both indicators. For the Stochastic RSI, the user can adjust the RSI period, stochastic length, and smoothing factors for K and D lines, while for the MACD, it allows customization of the fast and slow exponential moving average lengths. Additionally, the script offers flexibility through five user-defined timeframes, enabling multi-level signal comparison. Theme and color customization options are also included to enhance visual clarity, allowing users to personalize the display according to preference or chart background.
The computational core of the script calculates the RSI based on a chosen price source (typically the closing price) and applies a stochastic transformation with smoothing to determine momentum extremes—classifying them as overbought, mid-high, mid-low, or oversold depending on their numeric range. The MACD component, computed as the difference between the fast and slow EMAs, is evaluated to determine its state: whether it is crossing upward, crossing downward, above zero, or below zero. These states represent shifts in market momentum and potential trend direction. Both Stochastic RSI and MACD values are retrieved from each selected timeframe using the request.security() function, allowing the indicator to integrate higher and lower timeframe data in real time.
Each indicator reading is then converted into a descriptive label and paired with a specific background color for intuitive visual classification. The script organizes this information into a dynamic table displayed at the top-right corner of the chart. This table consists of three columns—timeframe, Stoch RSI status, and MACD status—and automatically updates with the latest market data on every bar close. Through this tabular format, traders can quickly interpret market conditions without having to switch between multiple charts or apply numerous separate indicators.
Overall, the MTF Stoch RSI + MACD Summary acts as a comprehensive dashboard that integrates momentum and trend indicators across multiple timeframes. By presenting data in a simplified visual layout, it enables traders to make more informed decisions based on the consistency of market signals. This facilitates clearer identification of overbought or oversold conditions, confirmation of trend strength, and early detection of potential reversals, making it a valuable tool for multi-timeframe technical analysis.

MTF Dashboard 9 Timeframes + Signals# MTF Dashboard Pro - Multi-Timeframe Confluence Analysis System
## WHAT THIS SCRIPT DOES
This script creates a comprehensive dashboard that simultaneously analyzes market conditions across 9 different timeframes (1m, 5m, 15m, 30m, 1H, 4H, Daily, Weekly, Monthly) using a proprietary confluence scoring methodology. Unlike simple multi-timeframe displays that show individual indicators separately, this script combines trend analysis, momentum, volatility signals, and volume analysis into unified confluence scores for each timeframe.
## WHY THIS COMBINATION IS ORIGINAL AND USEFUL
**The Problem Solved:** Most traders manually check multiple timeframes and struggle to quickly assess overall market bias when different timeframes show conflicting signals. Existing MTF scripts typically display individual indicators without synthesizing them into actionable intelligence.
**The Solution:** This script implements a mathematical confluence algorithm that:
- Weights each indicator's signal strength (trend direction, RSI momentum, MACD volatility, volume analysis)
- Calculates normalized scores across all active timeframes
- Determines overall market bias with statistical confidence levels
- Provides instant visual feedback through color-coded symbols and star ratings
**Unique Features:**
1. **Confluence Scoring Algorithm**: Mathematically combines multiple indicator signals into a single confidence rating per timeframe
2. **Market Bias Engine**: Automatically calculates overall directional bias with percentage strength across all selected timeframes
3. **Dynamic Display System**: Real-time updates with customizable layouts, color schemes, and selective timeframe activation
4. **Statistical Analysis**: Provides bullish/bearish vote counts and overall confluence percentages
## HOW THE SCRIPT WORKS TECHNICALLY
### Core Calculation Methodology:
**1. Trend Analysis (EMA-based):**
- Fast EMA (default: 9) vs Slow EMA (default: 21) crossover analysis
- Returns values: +1 (bullish), -1 (bearish), 0 (neutral)
**2. Momentum Analysis (RSI-based):**
- RSI levels: >70 (strong bullish +2), >50 (bullish +1), <30 (strong bearish -2), <50 (bearish -1)
- Provides overbought/oversold context for trend confirmation
**3. Volatility Analysis (MACD-based):**
- MACD line vs Signal line positioning
- Histogram strength comparison with previous bar
- Combined score considering both direction and momentum strength
**4. Volume Analysis:**
- Current volume vs 20-period moving average
- Thresholds: >150% MA (strong +2), >100% MA (bullish +1), <50% MA (weak -2)
**5. Confluence Calculation:**
```
Confluence Score = (Trend + RSI + MACD + Volume) / 4.0
```
**6. Market Bias Determination:**
- Counts bullish vs bearish signals across all active timeframes
- Calculates bias strength percentage: |Bullish Count - Bearish Count| / Total Active TFs * 100
- Determines overall market direction: BULLISH, BEARISH, or NEUTRAL
### Multi-Timeframe Implementation:
Uses `request.security()` calls to fetch data from each timeframe, ensuring all calculations are performed on the respective timeframe's data rather than current chart timeframe, providing accurate multi-timeframe analysis.
## HOW TO USE THIS SCRIPT
### Initial Setup:
1. **Timeframe Selection**: Enable/disable specific timeframes in "Timeframe Selection" group based on your trading style
2. **Indicator Configuration**: Adjust EMA periods (Fast: 9, Slow: 21), RSI length (14), and MACD settings (12/26/9) to match your analysis preferences
3. **Display Options**: Choose table position, text size, and color scheme for optimal visibility
### Reading the Dashboard:
**Symbol Interpretation:**
- ⬆⬆ = Strong bullish signal (score ≥ 2)
- ⬆ = Bullish signal (score > 0)
- ➡ = Neutral signal (score = 0)
- ⬇ = Bearish signal (score < 0)
- ⬇⬇ = Strong bearish signal (score ≤ -2)
**Confluence Stars:**
- ★★★★★ = Very high confidence (score > 0.75)
- ★★★★☆ = High confidence (score > 0.5)
- ★★★☆☆ = Medium confidence (score > 0.25)
- ★★☆☆☆ = Low confidence (score > 0)
- ★☆☆☆☆ = Very low confidence (score > -0.25)
**Market Bias Section:**
- Shows overall market direction across all active timeframes
- Strength percentage indicates conviction level
- Overall confluence score represents average agreement across timeframes
### Trading Applications:
**Entry Signals:**
- Look for high confluence (4-5 stars) across multiple timeframes in same direction
- Higher timeframe alignment provides stronger signal validation
- Use confluence percentage >75% for high-probability setups
**Risk Management:**
- Lower timeframe conflicts may indicate choppy conditions
- Neutral bias suggests ranging market - adjust position sizing
- Strong bias with high confluence supports larger position sizes
**Timeframe Harmony:**
- Short-term trades: Focus on 1m-1H alignment
- Swing trades: Emphasize 1H-Daily alignment
- Position trades: Prioritize Daily-Monthly confluence
## SCRIPT SETTINGS EXPLANATION
### Dashboard Settings:
- **Table Position**: Choose optimal location (Top Right recommended for most layouts)
- **Text Size**: Adjust based on screen resolution and preferences
- **Color Scheme**: Professional (default), Classic, Vibrant, or Dark themes
- **Background Color/Transparency**: Customize table appearance
### Timeframe Selection:
All timeframes optional - activate based on trading timeframe preference:
- **Lower Timeframes (1m-30m)**: Scalping and day trading
- **Medium Timeframes (1H-4H)**: Swing trading
- **Higher Timeframes (D-M)**: Position trading and long-term bias
### Indicator Parameters:
- **Fast EMA (Default: 9)**: Shorter period for trend sensitivity
- **Slow EMA (Default: 21)**: Longer period for trend confirmation
- **RSI Length (Default: 14)**: Standard momentum calculation period
- **MACD Settings (12/26/9)**: Standard MACD configuration for volatility analysis
### Alert Configuration:
- **Strong Signals**: Alerts when confluence >75% with clear directional bias
- **High Confluence**: Alerts when multiple timeframes strongly agree
- All alerts use `alert.freq_once_per_bar` to prevent spam
## VISUAL FEATURES
### Chart Elements:
- **Background Coloring**: Subtle background tint reflects overall market bias
- **Signal Labels**: Strong buy/sell labels appear on chart during high-confluence signals
- **Clean Presentation**: Dashboard overlays chart without interfering with price action
### Color Coding:
- **Green/Bullish**: Various green shades for positive signals
- **Red/Bearish**: Various red shades for negative signals
- **Gray/Neutral**: Neutral color for conflicting or weak signals
- **Transparency**: Configurable transparency maintains chart readability
## IMPORTANT USAGE NOTES
**Realistic Expectations:**
- This tool provides analysis framework, not trading signals
- Always combine with proper risk management
- Past performance does not guarantee future results
- Market conditions can change rapidly - use appropriate position sizing
**Best Practices:**
- Verify signals with additional analysis methods
- Consider fundamental factors affecting the instrument
- Use appropriate timeframes for your trading style
- Regular parameter optimization may be beneficial for different market conditions
**Limitations:**
- Effectiveness may vary across different instruments and market conditions
- Confluence scoring is mathematical model - not predictive guarantee
- Requires understanding of underlying indicators for optimal use
This script serves as a comprehensive analysis tool for traders who need quick, organized access to multi-timeframe market information with statistical confidence levels.

MTF Sentiment ProMTF Sentiment Pro - Advanced Multi-Timeframe Analysis
Purpose & Methodology
MTF Sentiment Pro provides traders with comprehensive market sentiment analysis across multiple timeframes. This indicator's unique innovation is its weighted scoring system that evaluates both technical indicators and volume metrics to determine market sentiment across customizable timeframes.
Unlike simple indicator overlays or basic multi-timeframe tools, this indicator:
1. Calculates sentiment using a proprietary weighted formula across 7 different timeframes
2. Incorporates volume confirmation to validate price movements (a critical element often overlooked)
3. Provides clear visualization of sentiment alignment between lower and higher timeframes
4. Uses majority-rule algorithms for overall sentiment determination (2/3 rule for LTF, 3/4 rule for HTF)
Technical Components & Integration
Each timeframe's sentiment score is derived from a combination of:
- **EMA**: Evaluates trend direction and price position relative to moving average
- **RSI**: Measures momentum with sensitivity to the 50-level for trend determination
- **MACD**: Assesses trend strength and momentum through histogram analysis
- **Bollinger Bands**: Determines price volatility and position relative to the mean
- **VWAP**: Provides volume-adjusted price reference
- **OBV**: Confirms price moves with cumulative volume analysis
What makes this combination powerful is how these components are integrated:
- Each indicator contributes a weighted value to the overall sentiment score
- User-definable weights allow customization based on strategy preferences
- Volume confirmation adds a critical dimension beyond basic price-only indicators
- Multi-timeframe analysis helps identify alignment/divergence across time horizons
Trading Applications & Limitations
This indicator works best for:
- Trend confirmation across multiple timeframes
- Identifying potential reversal zones where LTF and HTF sentiments diverge
- Entry/exit timing when paired with your primary strategy rules
- Market structure analysis across different time horizons
Note: While this indicator provides comprehensive sentiment analysis, it should be used as part of a complete trading strategy with proper risk management. No indicator can predict market movements with certainty.
Usage Instructions
1. Select appropriate timeframes for your trading style or use one of the included presets
2. Adjust indicator weights to match your analytical preferences
3. Look for timeframe alignment/divergence to identify potential opportunities
4. Use the overall LTF and HTF sentiment readings for broader market context
This indicator was developed to solve the challenge of efficiently analyzing sentiment across multiple timeframes while incorporating volume confirmation - something that would otherwise require multiple indicators and manual correlation.

MTF Moving Averages (only EMA)MTF Moving Averages (only EMA)
This script provides a Multi-Timeframe (MTF) Exponential Moving Average (EMA) indicator for traders to visualize multiple EMAs across different timeframes directly on a single chart.
The indicator dynamically calculates and plots up to four EMAs per timeframe (15-minute, 30-minute, 1-hour, and Daily) with user-defined lengths, offering valuable insight into price trends and potential entry or exit points.
Key Features:
Multiple Timeframe Support: The script allows you to view EMAs from different timeframes simultaneously. This is especially useful for traders who follow trends across different timeframes to make more informed decisions.
Customizable Lengths: For each timeframe, the lengths of the EMAs are fully customizable. You can adjust the length of up to four EMAs per timeframe to suit your strategy.
EMA Calculation: The Exponential Moving Average (EMA) is used, which gives more weight to recent prices and reacts faster to price changes compared to the simple moving average (SMA).
Timeframe Flexibility: The indicator supports the following timeframes:
15-minute: Ideal for short-term traders and scalpers.
30-minute: For intraday trading with a slightly longer perspective.
1-hour: Suitable for swing traders and those who prefer a more medium-term view.
Daily: Great for longer-term trend-following strategies.
Interactive and User-Friendly: You can toggle the visibility of each EMA on each timeframe, allowing you to choose exactly which EMAs you wish to display, depending on your trading strategy.
Color-Coded for Clarity: The script uses distinct colors for each EMA on the chart:
Blue: EMA1
Green: EMA2
Red: EMA3
Purple: EMA4
Line Width Customization: Each plotted EMA line has a customizable width for better visual clarity.
Use Case:
Traders who use multiple timeframes for analysis (e.g., those using the "multi-timeframe analysis" technique) will find this script particularly useful. For example, a trader may look at the 15-minute chart to catch short-term movements, the 30-minute chart for intraday trends, the 1-hour chart for swing positions, and the Daily chart for identifying the overarching market trend. The script enables them to view the EMAs for all these timeframes in one glance without having to manually switch between them.
By observing the relationships between EMAs across multiple timeframes, traders can gain valuable insights into market conditions such as:
Crossovers: When a shorter-term EMA crosses above or below a longer-term EMA, it can signal a potential trend reversal or continuation.
Trend Strength: Multiple EMAs in alignment across different timeframes can indicate strong trend strength.
Support and Resistance: EMAs can act as dynamic support and resistance levels, guiding traders on price action levels to watch for potential price reversals.
Instructions:
Enable/Disable EMAs: Toggle on or off the EMAs for each timeframe (15-min, 30-min, 1-hour, Daily) using the script’s settings.
Adjust EMA Lengths: Change the default lengths for each EMA to match your preferred settings for different timeframes.
Monitor Key Levels: Watch how price interacts with the plotted EMAs to spot potential trading signals based on your strategy.
This indicator is designed to enhance your multi-timeframe analysis and help make more informed, data-driven trading decisions.

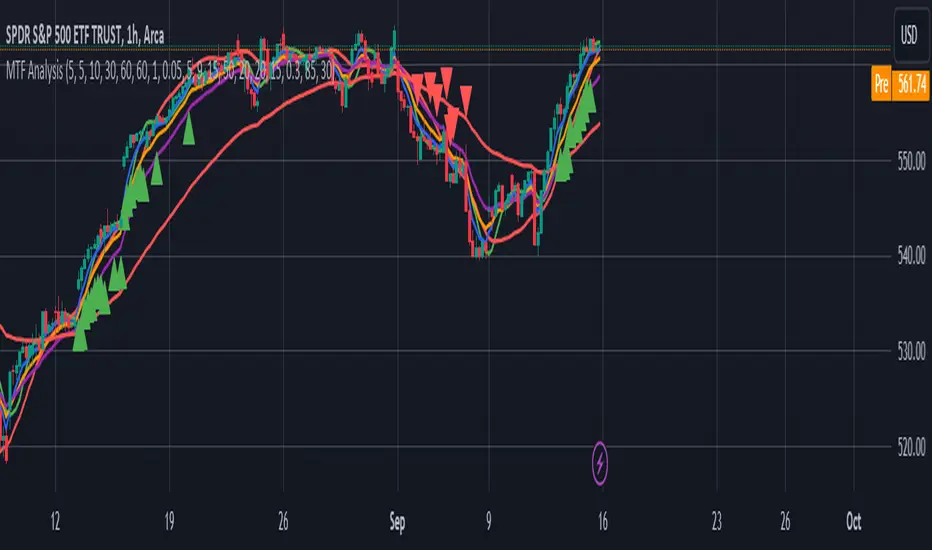
MTF AnalysisMTF Analysis - Multi-Timeframe TradingView Script
Overview: The "MTF Analysis" script provides a comprehensive approach to analyzing price trends across daily, weekly, and monthly timeframes using linear regression channels. It helps traders identify strong and weak bullish or bearish conditions based on the relationship between the current price and regression lines derived from multiple timeframes.
Key Features:
User-Defined Inputs:
Regression Lengths: Customize regression lengths for daily, weekly, and monthly timeframes.
Smoothing Length: Apply smoothing to regression lines.
Near-Zero Threshold: Filter out signals near a defined slope threshold for more refined analysis.
Daily Time Frame Filter: Optional filter to consider daily regression slope in signal generation.
Regression Line Calculation:
The script calculates linear regression lines for each timeframe (daily, weekly, monthly) and applies a smoothing function to refine the signals.
Signal Conditions:
Strong Bullish/Bearish: Signals generated when the price is consistently above/below weekly and monthly regression lines, with the option to apply the daily timeframe filter.
Weak Bullish/Bearish: Signals generated when the price is above/below the monthly regression line alone.
Visual Indicators:
The script plots regression lines on the chart with different colors for easy identification.
It also displays arrows on the chart to indicate strong or weak bullish/bearish signals.
Alerts:
Custom alerts for each signal condition help traders stay informed of potential trading opportunities.
This script is highly customizable, allowing traders to tailor it to their specific trading style and preferences.
This summary can be used to introduce the script to other traders or for publication on platforms like TradingView.
Ultimate Custom MTF ScreenerThis indicator will allow you to make your custom TradingView MTF screener without coding. Add it to the chart, select up to 10 instruments, 4 timeframes, and 4 indicators, and the screener will do the rest for you. The indicator will form a lovely table with all values and highlighted signals.
The screener is highly customizable, and you can choose its position on the chart, sorting, order of the columns, and colors for the tables. You can easily change parameters for all supported indicators and their signals.
Currently, there are 21 different custom indicators available. Current list of indicators:
Average Directional Index (ADX) - displaying the value of ADX and checking if it's higher than the threshold
Average True Range (ATR) - showing the value of ATR
Awesome Oscillator (AO) - displaying the value of AO and highlighting positive/negative values.
Bollinger Bands (BB) - showing if the price is above/below/in the channel.
Breakout Pivots - Displaying when the price is below/above the most recent pivot low/high.
Commodity Channel Index (CCI) - shows the last CCI value and highlights overbought/oversold values.
Directional Movement Index (DMI) - Up/Down signal (+DI above or below -DI)
Donchian Channel (DC) - showing if the price is above/below/in the channel.
Heikin Ashi Count (HAC) - What is the current Heikin Ashi candle color and for how long was this color?
Historical Volatility (HV) - Current value of Historical Volatility
Keltner Channel (KC) -showing if the price is above/below/in the channel.
Moving Average Convergence Divergence (MACD) - Up/Down signal (MACD above / below signal)
Moving Average Crossover (MA Cross) - Displaying MA crosses signals (SMA, EMA, WMA, HMA, VWMA, SMMA, DEMA, VWAP supported)
Moving Average Distance (MA DIST) - Displaying distance to the MA (SMA, EMA, WMA, HMA, VWMA, SMMA, DEMA, VWAP supported)
Parabolic Stop and Reverse (PSAR) - Up or Down
Relative Strength Index (RSI) - Displaying the last RSI value and highlighting overbought/oversold values.
Stochastic (STOCH) - Displaying the last Stochastic value and highlighting overbought/oversold values.
Stochastic RSI (STOCH RSI) - Displaying the last Stochastic RSI value and highlighting overbought/oversold values.
SuperTrend - Current state of the SuperTrend.
Trailing Stop-Loss (TSL) - Up or Down
True Strength Index (TSI) - Displaying the last TSI value and highlighting overbought/oversold values.
We're already working on adding a few more supported indicators. If you have any ideas about the indicators you want to see in our screener, contact us, and we'll consider them.
Disclaimer
Please remember that past performance may not be indicative of future results.
Due to various factors, including changing market conditions, the strategy may no longer perform as well as in historical backtesting.
This post and the script don’t provide any financial advice.

MTF Stochastic Zones w/ Candle and Swing Hi/Lo IndicatorsMTF Stochastic Zones w/ Candle and Swing Hi/Lo Indicators by // © KaizenTraderB
This indicator will display the Stochastic RSI as color zones utilizing 3 Timeframes of your choice as well as key reversal candles:
Entry Timeframe StochRSI Crossovers and Long Wick Reversal Candles (Hammer and Hanging Man) and Engulfing Candles
That correlate with Swing Highs and Lows.
When the higher timeframe is bullish it will be green and when bullish, red.
When the middle timeframe is counter the higher, it will appear brownish.
The entry timeframe will print Candle Labels and Swing Highs and Lows at bullish and bearish Stochastic RSI crossovers when oversold and overbought, respectively,
In the direction of the higher timeframe directional bias when the middle timeframe is counter that direction to catch reversals in corrections.
(It also prints Bull/Bear StochRSI Crossovers that correlated with Swing Highs and Lows that are not Hammers, Hanging Men or Engulfing Candles.)
The options allow you to turn the zones, swing highs and lows, candle indicators and entry StochRSI Crossovers on and off, as well as which Timeframes you choose to view.
Entry - 1Hr, 15m, 5m or 1m Middle Timeframe - Daily, 4Hr, 1Hr or 15m Higher Timeframe - Monthly, Weekly, Daily, 4Hr or 1Hr
You can change the Swing High and Low Lookback periods, as well as
The Stochastic RSI Lookback for each of the three timeframes and the level of Overbought and Oversold:
When 8 is chosen for RSI Lookback, Stochastic Lookback = 5, SmoothK = 3, Smooth D = 3 For 13 - 8, 5, 5 For 21 - 13, 8, 8 For 34 - 21, 13, 13
Its good practice to adjust settings so Higher Timeframe zones (green/red) correlate with longer trend movements,
Medium Timeframe with corrections and reversal areas (brown) and Entry Timeframe with key reversal candles.
For example, to adjust the Daily Higher Timeframe, turn the Higher Timeframe to Daily, turn off the others and bring up the Daily Chart.
Look at chart for last 200 bars or so and go through the different settings until you find the one that best correlates with recent past price action.
Do the same procedure for the Middle and Entry Timeframe. Once all the settings are how you prefer, view the Indicator on the Entry Timeframe to find trades.
Coding included to prevent repainting
Can be used in conjunction with the MTF Stochastic RSI w/ Zones which is displayed in the lower panel.
Need the same settings in both indicators for them to correlate or use different settings for different views,
Message me with feedback to improve upon this indicator or requested additions.
I will soon be releasing a Strategy based on this indicator!

SuperJump QQE MOD MTFThis is a QQE MOD MTF version.
Mihkel00 modified Glaz's script, I modified Mihkel00 's script again.
This is a QQE Mod original version by Mihkel00 :
I simply changed the above script to update pine script 5.0 and extracted two functions.
Thank you to the two authors for sharing such a great script.

ORB Parabolic SAR Multi Time Frame (PSAR MTF)
This is an adaptation of the inbuilt PSAR function in a Multi Time Frame .
When MTF enabled It will plot two timeframe simultaneously as follows:-
1 Min with 5 Min (HTF)
5 Min with 15 Min(HTF)
15 Min with 1H(HTF)
1H with 4H(HTF)
4H with Daily(HTF)
Daily with Weekly(HTF)
Weekly with Monthly(HTF)
The higher timeframe(HTF) will get plotted in bigger circled lines.
By enabling plotting of all levels, you can see all current levels of all TF( M1 ,M5,M15,H,4H,D,W,M) on the same screen as "X" on the right side.
Alerts allow you to get alerts when these crossover happens.
