Renko and SMABasic trading script for crypto that buys when close goes above SMA, and sells when close is less than previous close
在腳本中搜尋"renko"


DWMY Opens (for aggr. charts) by Koenigsegg🟣 DWMY Opens (for Aggregated Charts) by Koenigsegg
Revolutionary compatibility with aggregated charts – This indicator represents a significant breakthrough in displaying Daily, Weekly, Monthly, and Yearly opening levels on aggregated chart types where traditional DWMY indicators have historically failed to function properly.
Complete aggregated chart support – Unlike previous Daily Weekly Monthly Yearly Opens indicators that experienced severe limitations when pulling data from non-standard chart types, this version is specifically engineered to work flawlessly with aggregated charts, range bars, Renko charts, Point & Figure charts, and all other non-time-based chart constructions.
Persistent horizontal reference lines – The indicator draws four distinct horizontal lines representing the opening prices of the current Daily, Weekly, Monthly, and Yearly periods, extending these levels forward into future bars to provide clear reference points for key support and resistance analysis.
Advanced customization capabilities – Features comprehensive user controls including custom label naming for each timeframe, adjustable line colors with independent color selection for Daily, Weekly, Monthly, and Yearly levels, configurable line width settings, and variable label font sizes ranging from tiny to huge.
Dynamic label positioning system – Implements a sophisticated label placement mechanism with configurable tick offset positioning and fixed end-bars-ahead projection, ensuring labels remain visible and properly positioned regardless of chart zoom level or timeframe.
Intelligent period detection logic – Utilizes advanced Pine Script time change detection algorithms specifically optimized for aggregated charts, accurately identifying new Daily, Weekly, Monthly, and Yearly periods even when traditional time-based functions fail on non-standard chart types.
Performance-optimized architecture – Built with efficient persistent variable storage using the var keyword, minimizing computational overhead while maintaining real-time updates across all timeframe levels simultaneously.
Professional visual presentation – Delivers clean, uncluttered chart visualization with strategically positioned labels that clearly identify each timeframe level without interfering with price action analysis.
Universal market compatibility – Functions seamlessly across all asset classes including stocks, forex, cryptocurrencies, commodities, and indices, adapting automatically to different tick sizes and price scales through syminfo.mintick integration.
Pine Script v6 foundation – Leverages the latest Pine Script version 6 capabilities, ensuring optimal performance, stability, and compatibility with current and future TradingView platform updates.
This indicator solves a critical limitation that has long plagued traders using aggregated chart types, finally enabling reliable access to essential Daily, Weekly, Monthly, and Yearly opening levels that serve as fundamental support and resistance zones in technical analysis. The breakthrough lies in its ability to maintain accurate period detection and level plotting regardless of the underlying chart construction methodology.
🟣 How It Works
Automatic period detection – The indicator continuously monitors for time changes across four distinct timeframes using ta.change(time()) functions for Daily and Weekly periods, month transitions for Monthly levels, and year changes for Yearly opens, ensuring precise identification of new period beginnings.
Real-time level updates – When a new period is detected, the indicator captures the opening price at that exact moment and immediately establishes a horizontal line from that bar extending forward to a configurable number of bars ahead, creating persistent reference levels.
Dynamic line management – Each timeframe maintains its own dedicated line object and label, with the indicator continuously updating the endpoint coordinates and label positions as new bars form, ensuring the levels always project the specified distance into the future.
Intelligent label placement – Labels are positioned at the end of each line with automatic vertical offset based on the symbol’s minimum tick size, preventing overlap with price action while maintaining clear identification of each timeframe level.
🟣 Pro Tips for Optimal Usage
Multi-timeframe confluence – Look for areas where multiple DWMY levels converge within close proximity, as these zones typically act as stronger support or resistance levels due to increased market participant attention at these psychological price points.
Breakout confirmation strategy – When price breaks above or below a significant DWMY level with strong volume, the broken level often transforms into support (if broken upward) or resistance (if broken downward), providing excellent entry and exit reference points.
Range trading opportunities – On ranging markets, use Daily and Weekly opens as potential reversal zones, especially when price approaches these levels during low-volume periods or near session opens when institutional activity increases.
Timeframe alignment technique – For swing trading, prioritize trades that align with the direction of the break from Weekly or Monthly opens, while using Daily opens for precise entry timing and position management.
Chart type optimization – This indicator excels on Renko, Range, and Point & Figure charts where traditional time-based DWMY indicators fail, making it invaluable for traders who prefer these aggregated chart types for cleaner price action analysis.
Important Disclaimer:
This indicator is provided for educational and informational purposes only. It is not financial advice, investment advice, or a recommendation to buy or sell any financial instrument. All trading involves risk, and past performance does not guarantee future results. Please conduct your own research and consult with a qualified financial advisor before making any trading decisions. The author is not responsible for any losses incurred from using this indicator.

Stochastic RSI Momentum TranformThis is my version of Stochastic RSI, but not the stochastic RSI alone, hell no, it's a lagging indicator, I don't like lagging indicators.
This is a leading indicator that has momentum calculations in it and not only that, it has a momentum shifting calculation based on modified ehler's transformation !
Simple for user, a hell to program !
Price and how to get access to ? contact me in PM !

Trader Set - Modified MTF BOTTOMThis is a modified formula for MFT. It's prefabricated with numbers that would work best with my methodology and system.
Please don't ask for getting access. Only my students can get access to these indicators.
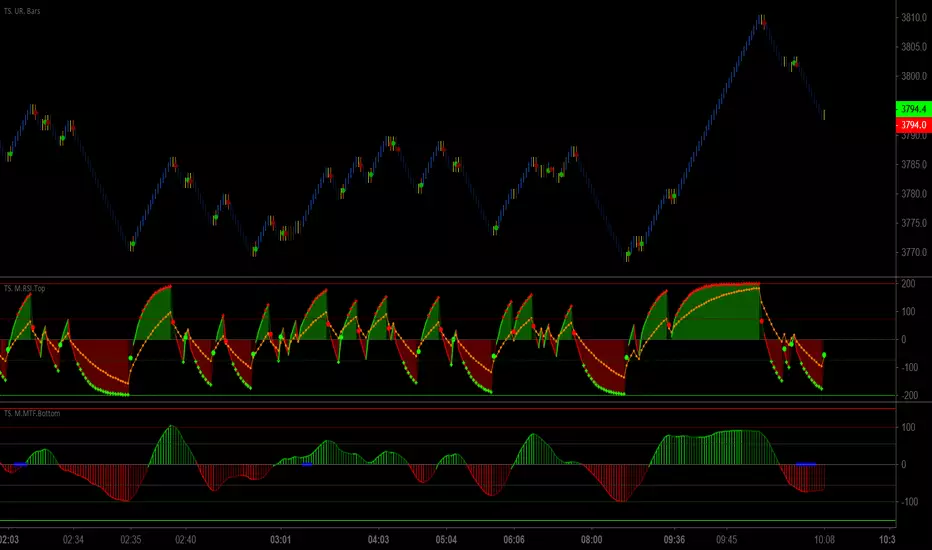
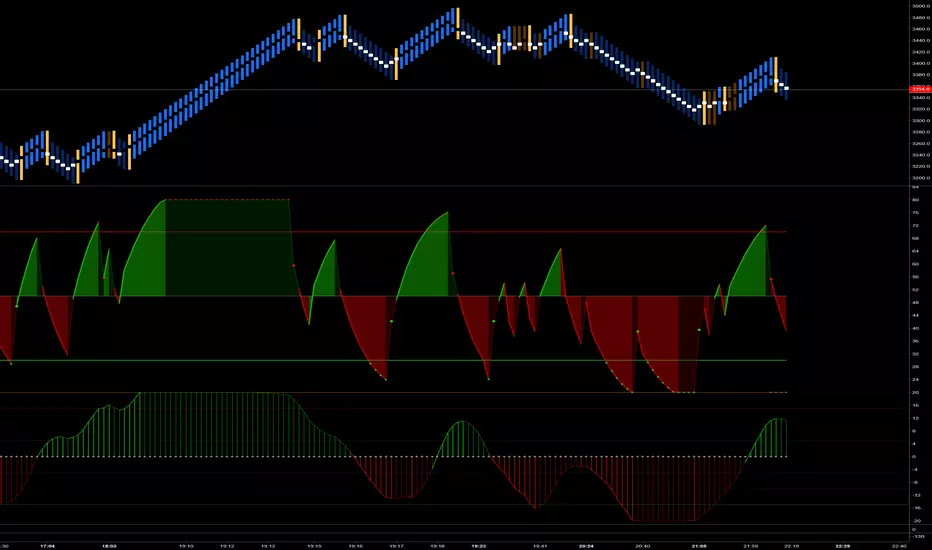
Trader Set - Modified RSI TOPThis is a modified RSI formula that draws two different RSI time frames on top of eachother with additional signal points on it.
Please don't ask for getting access. Only my students can have access to these tools because they are part of my methodology and prefabricated with fixed numbers that would work ONLY on my system.
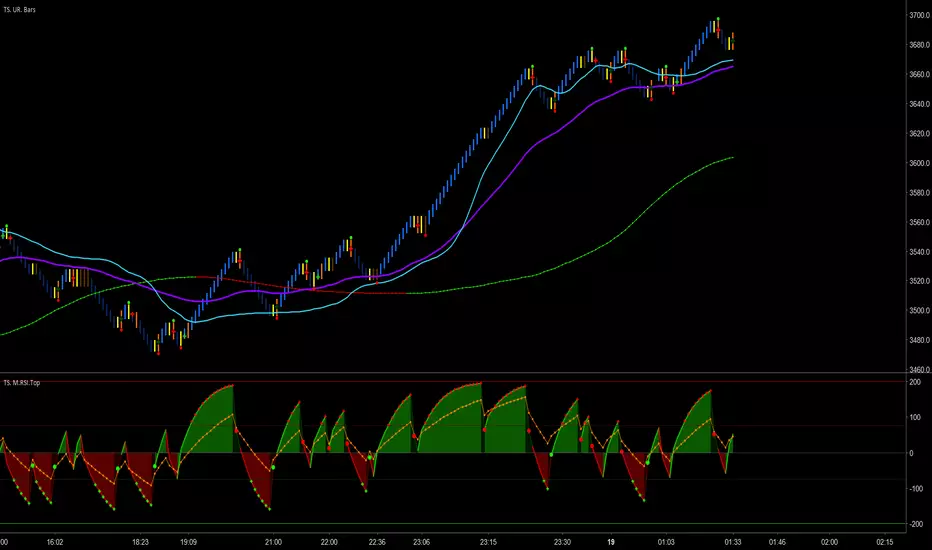
Trader Set - Modified RSI MTFThis is a modified version of RSI MTF, a similar indicator can be found in public library if anyone is interested, mine, is fabricated to work with my methology with all the addition i will add to this (just like others when i added the ability to change the moving types in critical places of formula) so that students can experiment with them (it will come in next version). also, I normalize both sections for better visualization.
Please don't ask me for getting access. "CM Modified RSI MFI" search it for the base and almost similar indicator without my additions. This script will be available only for my students at the time being. like other scripts, if the learning material will be ready i will be announce in comment section, and like others, again, if i decide to sell this separated from courses i will announce in the comment section too.
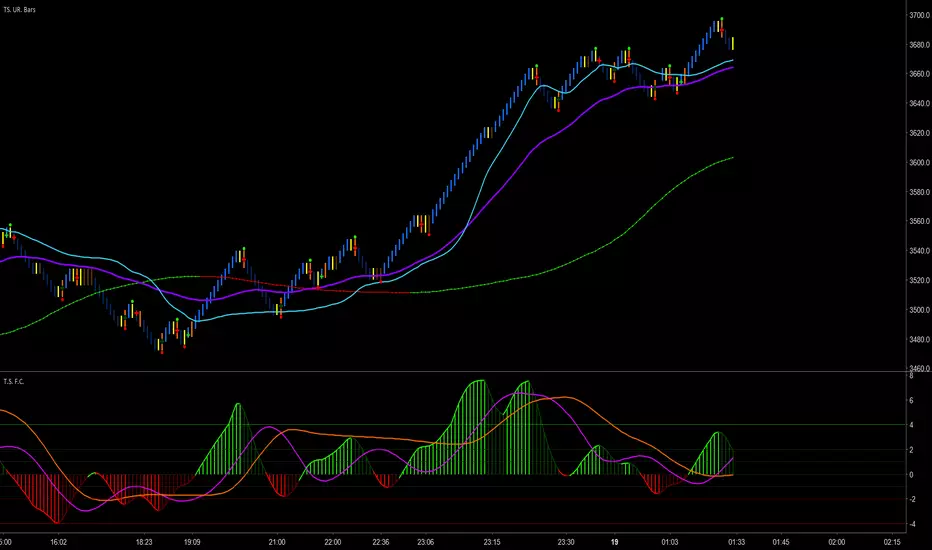
Trader Set - Fisher CycleUnfortunately, the fihser transform's formula has specifications that are not compatible with newer versions of pine script (calling mutable variables on security function).
So, I had to separate this section of "Cycle" script to it's own little world and remove the versioning from the script.
That, means that i can't even write the name of the oscillator on the right hand side (show_last is not there in older versions).
Welcome to the world of pine script and haphazard updates of trading view without thinking about consequences of their new move !
SAT_LIBLibrary "SAT_LIB"
TODO: This library regroups indicator's functions and functions i use a lot
getRENKOLEVELS(upColor1, dnColor1, HIGH, LOW, ATR)
TODO: RenkoLevels indicator by Mongolor function
Parameters:
upColor1 : TODO: (Type: color) renko up color
dnColor1 : TODO: (Type: color) renko down color
HIGH : TODO: (Type: float)
LOW : TODO: (Type: float)
ATR : TODO: (Type: float)
Returns: TODO: Renkolevels

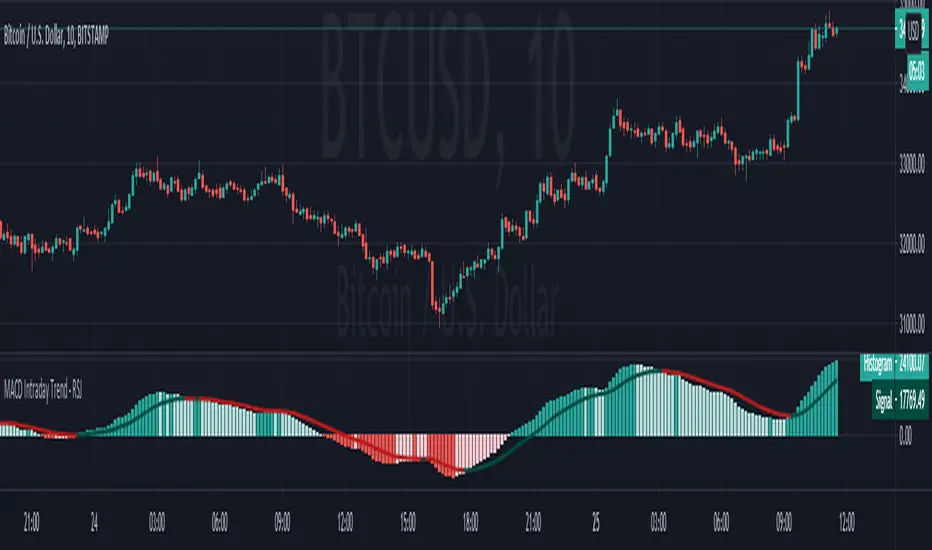
MACD Intraday Trend - RSJMACD Intraday Trend is an Indicator developed through an adaptation made of the original MACD created by Gerald Appel in the 1960s.
Through years of trading it was observed that by changing the parameters of the MACD with Fibonacci proportions we achieve a better presentation of the continuity of the trend movements, making that it is possible to more efficiently detect the beginning and end of a price trend.
Due to its efficiency in detecting price trends, it is also possible to identify very clearly the divergences of tops and bottoms, thus taking better advantage of trading opportunities.
-> Every time the histogram is positive and crosses the signal line down there is a high probability that an uptrend will end and a downtrend will start.
-> Every time the histogram is negative and crosses the signal line up there is a high probability of ending a downtrend and starting an uptrend.
The Indicator MACD Intraday Trend works with any currency pair, at any candlesticks timeframe and with Renko charts.
The Indicator has an amazing performance on Renko charts.
------------------------------------------------------------------------------------------------------------------------------------------------------------------------
MACD Intraday Trend é um Indicador desenvolvido através de uma adaptação feita do MACD original criado por Gerald Appel nos anos 1960.
Através de anos de trading foi observado que alterando os parâmetros do MACD com proporções de Fibonacci conseguimos uma melhor apresentação de continuidade dos movimentos de tendência, fazendo com que seja possível detectar de forma mais eficiente o início e fim de uma tendência de preços.
Devido sua eficiência em detecção de tendências de preços é possível também identificar com muita clareza as divergências de topos e fundos, desta forma aproveitando melhor as oportunidades de trading.
-> Toda vez que o histograma estiver positivo e cruzar a linha de sinal para baixo existe uma alta probabilidade de fim de uma tendência de alta e início de uma tendência de baixa.
-> Toda vez que o histograma estiver negativo e cruzar a linha de sinal para cima existe uma alta probabilidade de fim de uma tendência de baixa e início de uma tendência de alta.
O Indicador MACD Intraday Trend funciona com qualquer par de moedas, em qualquer tempos gráficos com candlesticks e gráficos do tipo Renko.
O Indicador tem uma performance surpreendente em gráficos do tipo Renko.
Weis Wave ChartThis indicator is based on the Weis Wave described by David H. Weis in his book Trades About to Happen: A Modern Adaptation of the Wyckoff Method, more info how to use this indicator can be found in this video . The Weis Wave is an adaptation of Richard D. Wyckoff’s method Wave Charts. It works in all time periods and can be applied to all asset types.
Unlike other implementations I found here on TradingView, this implementation make use of a Renko-like zig zag pattern, very similar to how it is described in David H. Weis' book. The settings for the zig zag pattern are very similar to the standard Renko settings here on TradingView, in the "Renko Assignment Method" you either chose "ATR" or "Traditional" (read more about it here ). The ATR length or the brick size is then entered in the textbox "Value". You can also chose another setting in the "Renko Assignment Method" drop down named "Part of Price" which calculate the brick size from the current close and divide it by the value in the text box "Value". It is also possible to chose if the zig zag pattern shall use the high/low, the open/close or just the close as the most extreme values in its calculation, you select this in the drop down "Price Source".
TradingView's pine script does currently not support to print non-static text on the chart, so it is not possible at this point to write out the volume on the zig zag chart. It is also not possible to have both an overlay and separate chart pane in the same indicator, therefor this indicator is split up in two.
You can find the volume indicator here:

Weis Wave VolumeThis indicator is based on the Weis Wave described by David H. Weis in his book Trades About to Happen: A Modern Adaptation of the Wyckoff Method, more info how to use this indicator can also be found in this video . The Weis Wave is an adaptation of Richard D. Wyckoff’s method Wave Charts. It works in all time periods and can be applied to all asset types. For assets that do not support volume Weis propose in his book to use the true range instead, so if you want to use this indicator for assets that do not support volume, make sure to enable the checkbox "Use True Range instead of Volume".
Unlike other implementations I found here on Trading, this implementation make use of a Renko-like zig zag pattern, very similar to how it is described in David H. Weis' book. The settings for the zig zag pattern are very similar to the standard Renko settings here on TradingView, in the "Renko Assignment Method" you either chose "ATR" or "Traditional" (read more about it here ). The ATR length or the brick size is then entered in the textbox "Value". You can also chose another setting in the "Renko Assignment Method" drop down named "Part of Price" which calculate the brick size from the current close and divide it by the value in the text box "Value". It is also possible to chose if the zig zag pattern shall use the high/low, the open/close or just the close as the most extreme values in its calculation, you select this in the drop down "Price Source". If you want the price to oscillate around a zero value, enable the "Oscillating" checkbox.
TradingView's pine script does currently not support to print non-static text on the chart, so it is not possible at this point to write out the volume on the zig zag chart. It is also not possible to have both an overlay and separate chart pane in the same indicator, therefor this indicator is split up in two.
You can find the zig zag indicator here:

FTX Index Advance Decline LineAs of publishing, all the tickers from FTX with the word "index" in it, plus bitcoin.
This is your regular ADL except instead of hundreds in the basket you've got them condensed into 7 (for now) and in open/close candle form instead of a line.
I'm a bit disappointed because I thought I'd lever more utility from indexes. It may just need some tweaking.
Doesn't it look like Renko?
Some notes:
Reason why it expands:
Total number of constituents is a static 7, to fix that use time to change the total variable based on dates of introduction.
Reallly looks like Renko:
Renko with ATR, length 14, hourly chart.

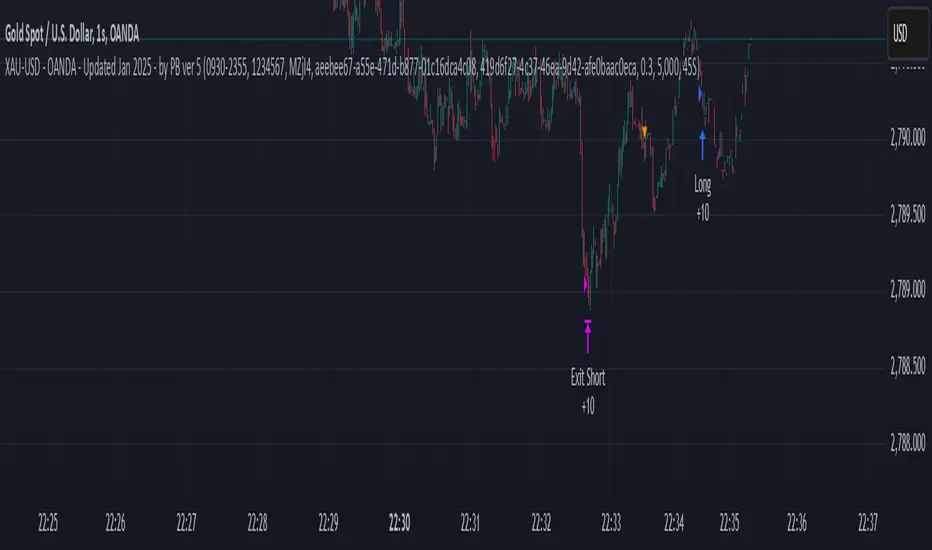
XAU-USD - OANDA - Updated Jan 2025 - by PB ver 5Script Title: XAU-USD - OANDA - Updated Jan 2025 - by PB ver 5
Description:
This strategy is designed for trading XAU/USD (Gold) on the OANDA platform, optimized with a session-based filter and Renko bar indicators for enhanced price action analysis. The script utilizes trailing stop loss functionality to manage risk effectively and allows flexibility for both long and short trades.
Key Features:
Date Filter: This strategy includes a time filter to backtest the performance from January 1st, 2025 to December 31st, 2025. Users can enable or disable the filter based on their preference.
Session Filter: Customizable session inputs allow the user to define the active trading session using a time range (default is 09:20-15:16) and the days of the week (default is all days, 1-7). The strategy will only enter trades during the active session, ensuring more controlled and focused trading.
Renko Bar Strategy: This strategy uses Renko charts, a popular price action tool, to detect buy and sell signals based on the crossover of Renko close and open prices. Users can adjust the Renko block size and the Renko value used for detecting price action shifts.
Trailing Stops: The script applies a trailing stop loss mechanism for both long and short trades. The trailing stop is dynamically updated to follow the market as prices move in favor of the trade. It uses a 5000-point trailing stop (adjustable by the user).
Flexible Trade Settings: Users can enable or disable long and short positions through simple toggle switches. The strategy allows for full control over trade entry and exit.
How It Works:
Long Trades: A long position is entered when the Renko close crosses above the Renko open. The position will be exited using a trailing stop, which follows the price in the market.
Short Trades: A short position is entered when the Renko close crosses below the Renko open. The position will also exit using a trailing stop.
The strategy will automatically close positions if the session ends or if the user manually exits the trades.
Customization Options:
Backtest Date Range: Set the start and end dates to backtest the strategy over a specific time period.
Session and Days: Adjust the session time and which days of the week the strategy is active.
Renko Block Size: Customize the Renko block size for finer control over price action signals.
Trailing Stop Distance: Adjust the trailing stop loss to your preferred risk levels.
Limitations and Considerations:
Renko Charting: Renko charts may not suit every trading style, as they are based on price movement rather than time. This strategy is designed for traders who prefer this style of charting.
Backtest Results: Always review the strategy's backtest results with realistic parameters. The strategy uses historical data, and past performance is not indicative of future results. Be aware of slippage and commission costs in real-world trading scenarios.
Manual Intervention: Users should monitor active trades and intervene manually if required.
Ideal Usage:
This strategy is suited for traders looking to use price action-based strategies with Renko charts for XAU/USD on the OANDA platform.
Ideal for those who want to automate their entry and exit points with trailing stop mechanisms while having control over the session time and backtesting period.
Disclaimer:
Past performance does not guarantee future results. Always use caution when using trading strategies and adjust parameters based on market conditions. The strategy is provided for educational purposes and should be tested on paper before live trading.
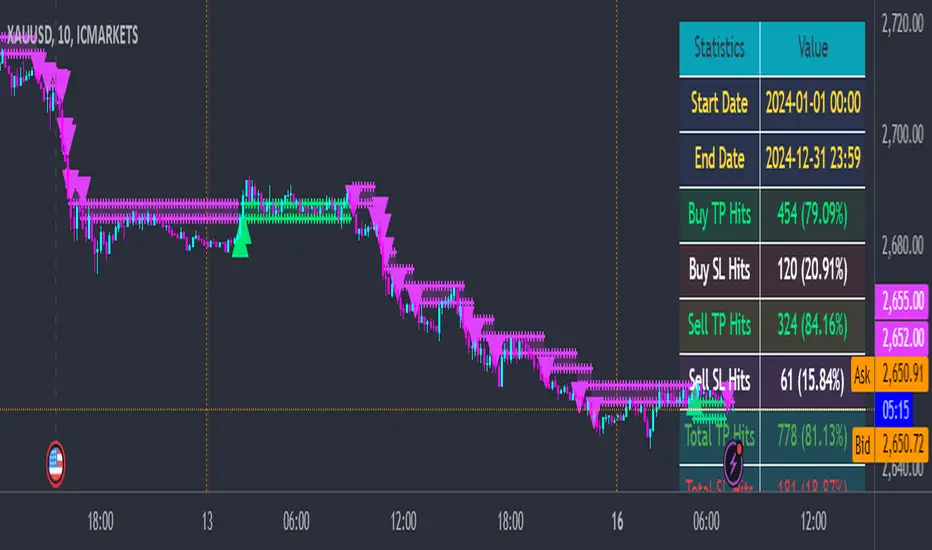
Quantum ChronoRenko Dynamics Edge - Traditional### **Quantum ChronoRenko Dynamics Edge - Traditional**
**Description:**
The **Quantum ChronoRenko Dynamics Edge - Traditional** is an advanced Renko-based indicator designed for precision trading. It leverages the power of Renko charts to detect price movements, highlight critical trading signals, and dynamically track profit and risk levels. This indicator is built with modern trading strategies in mind, offering robust tools for all traders, from beginners to professionals.
**Key Features:**
1. **Renko-Based Signal Generation**:
- Detects **Buy Signals** when the price closes above the Renko high level.
- Detects **Sell Signals** when the price closes below the Renko low level.
- Ensures signals are non-repainting and confirmed on bar closures.
2. **Take Profit (TP) and Stop Loss (SL) Tracking**:
- Automatically calculates and plots TP and SL levels for every signal.
- Dynamic levels are displayed directly on the chart for better decision-making.
3. **Advanced Signal Management**:
- Prevents duplicate signals within the same Renko range.
- Resets signal conditions when a new Renko range is formed.
4. **Visual Enhancements**:
- Renko high and low levels are plotted with customizable colors and styles.
- TP and SL levels are marked with distinct cross shapes for clarity.
- Optional fill between Renko levels to highlight price ranges.
5. **Real-Time Alerts**:
- Generates alerts for Buy and Sell signals when a candle closes above or below the Renko levels.
- Alerts are designed to help traders react quickly to opportunities.
6. **Comprehensive Statistics**:
- Tracks the number of Buy/Sell signals.
- Calculates the number of TP and SL hits for each signal type.
- Displays detailed percentages and totals in an easy-to-read table.
**Key Benefits**:
- **Non-Repainting Logic**: Ensures stable and reliable signals based on confirmed price movements.
- **Customizability**: Flexible settings for Renko brick size, TP/SL values, and visual enhancements.
- **Professional-Level Insights**: Provides detailed statistics for tracking strategy performance.
**Use Cases**:
- Perfect for intraday and swing traders who rely on Renko charts for clear trend signals.
- Suitable for identifying key breakout opportunities and managing trades with precise TP/SL levels.
Example Usage:
For daily scalping, set the following parameters:
Brick Size: 3
Time Frame: 10 Minutes
This setup provides clean trend signals and dynamic TP/SL tracking for short-term trades.
**Why "Traditional"?**
This version uses the **Traditional Renko method**, ensuring consistent price-based calculations that align with professional trading strategies.
---
**Disclaimer**:
This indicator is a tool to aid trading decisions but does not guarantee profits. Always use proper risk management.
---
Point and Figure (PnF) RSIThis is live and non-repainting Point and Figure Chart RSI tool. The script has it’s own P&F engine and not using integrated function of Trading View.
Point and Figure method is over 150 years old. It consist of columns that represent filtered price movements. Time is not a factor on P&F chart but as you can see with this script P&F chart created on time chart.
P&F chart provide several advantages, some of them are filtering insignificant price movements and noise, focusing on important price movements and making support/resistance levels much easier to identify.
P&F RSI is calculated and shown by using its own P&F engine.
If you are new to Point & Figure Chart then you better get some information about it before using this tool. There are very good web sites and books. Please PM me if you need help about resources.
Options in the Script
Box size is one of the most important part of Point and Figure Charting. Chart price movement sensitivity is determined by the Point and Figure scale. Large box sizes see little movement across a specific price region, small box sizes see greater price movement on P&F chart. There are four different box scaling with this tool: Traditional, Percentage, Dynamic (ATR), or User-Defined
4 different methods for Box size can be used in this tool.
User Defined: The box size is set by user. A larger box size will result in more filtered price movements and fewer reversals. A smaller box size will result in less filtered price movements and more reversals.
ATR: Box size is dynamically calculated by using ATR, default period is 20.
Percentage: uses box sizes that are a fixed percentage of the stock's price. If percentage is 1 and stock’s price is $100 then box size will be $1
Traditional: uses a predefined table of price ranges to determine what the box size should be.
Price Range Box Size
Under 0.25 0.0625
0.25 to 1.00 0.125
1.00 to 5.00 0.25
5.00 to 20.00 0.50
20.00 to 100 1.0
100 to 200 2.0
200 to 500 4.0
500 to 1000 5.0
1000 to 25000 50.0
25000 and up 500.0
Default value is “ATR”, you may use one of these scaling method that suits your trading strategy.
If ATR or Percentage is chosen then there is rounding algorithm according to mintick value of the security. For example if mintick value is 0.001 and box size (ATR/Percentage) is 0.00124 then box size becomes 0.001.
And also while using dynamic box size (ATR or Percentage), box size changes only when closing price changed.
Reversal : It is the number of boxes required to change from a column of Xs to a column of Os or from a column of Os to a column of Xs. Default value is 3 (most used). For example if you choose reversal = 2 then you get the chart similar to Renko chart.
Source: Closing price or High-Low prices can be chosen as data source for P&F charting.
you can use PNF type RSI or RENKO type RSI.
What is the difference between them?
While calculating PNF type RSI, the script checks last X/O column's closing price but when using RENKO type RSI the scipt calculates RSI on every price changes according to number of boxes. and also with RENKO type RSI, calculation is made for each boxes on price changes.
Important note if you use this PNF script with reversal = 2 then you get RENKO chart. So, with this RENKO chart better to use RENKO type RSI ;)

Negroni Opening Range StrategyStrategy Summary:
This tool can be used to help identify breakouts from a range during a time-zone of your choosing. It plots a pre-market range, an opening range, it also includes moving average levels that can be used as confluence, as well as plotting previous day SESSION highs and lows.
There are several options on how you wish to close out the trades, all described in more detail below.
Back-testing Inputs:
You define your timezone.
You define how many trades to open on any given day.
You decide to go: long only, short only, or long & short (CAREFUL: "Long & Short" can open trades that effectively closes-out existing ones, for better AND worse!)
You define between which times the strategy will open trades.
You define when it closes any open trades (preventing overnight trades, or leaving trades open into US data times!!).
This hopefully helps make back-testing reflect YOUR trading hours.
NOTE: Renko or Heikin-Ashi charts
For ALL strategies, don’t use Renko or Heikin-Ashi charts unless you know EXACTLY the implications.
Specific to my strategy, using a renko chart can make this 85-90% profitable (I wish it was!!) Although they can be useful, renko charts don’t always capture real wicks, so the renko chart may show your trade up-only but your broker (who is not using renko!!) will have likely stopped you out on a wick somewhere along the line.
NOTE: TradingView ‘Deep backtesting’
For ALL strategies, be cynical of all backtesting (e.g. repainting issues etc) as well as ‘Deep backtesting’ results.
Specific to this strategy, the default settings here SHOULD BE OK, but unfortunately at the time of writing, we can’t see on the chart what exactly ‘deep backtesting’ is calculating. In the past I have noted a number of trades that were not closed at the end of the day, despite my ‘end of day’ trade closing being enabled, so there were big winners and losers that would not have materialized otherwise. As I say, this seems ok at these settings but just always be cynical!!
Opening Range Inputs
You define a pre-market range (example: 08:00 - 09:00).
You define an opening range (example: 09:00 - 09:30).
The strategy will give an update at the close of the opening range to let you know if the opening range has broken out the pre-market range (OR Breakout), or if it has remained inside (OR Inside). The label appears at the end of the opening range NOT at the bar that ‘broke-out’.
This is just a visual cue for you, it has no bearing on what the strategy will do.
The strategy default will trade off the pre-market range, but you can untick this if you prefer to trade off the opening range.
Opening Trades:
Strategy goes long when the bar (CLOSE) crosses-over the ‘pre-market’ high (not the ‘opening range’ high); and the time is within your trading session, and you have not maxed out your number of trades for the day!
Strategy goes short when the bar (CLOSE) crosses-under the ‘pre-market’ low (not the ‘opening range low); and the time is within your trading session, and you have not maxed out your number of trades for the day!
Remember, you can untick this if you prefer to trade off the opening range instead.
NOTES:
Using momentum indicators can help (RSI and MACD): especially to trade range plays in failed breakouts, when momentum shifts… but the strategy won’t do this for you!
Using an anchored vwap at the session open can also provide nice confluence, as well as take-profit levels at the upper/lower of 3x standard deviation.
CLOSING TRADES:
You have 6 take-profit (TP) options:
1) Full TP: uses ATR Multiplier - Full TP at the ATR parameters as defined in inputs.
2) Take Partial profits: ATR Multiplier - Takes partial profits based on parameters as defined in inputs (i.e close 40% of original trade at TP1, close another 40% of original trade at TP2, then the remainder at Full TP as set in option 1.).
3) Full TP: Trailing Stop - Applies a Trailing Stop at the number of points, as defined in inputs.
4) Full TP: MA cross - Takes profit when price crosses ‘Trend MA’ as defined in inputs.
5) Scalp: Points - closes at a set number of points, as defined in inputs.
6) Full TP: PMKT Multiplier - places a SL at opposite pre-market Hi/Low (we go long at a break-out of the pre-market high, 50% would place a SL at the pre-market range mid-point; 100% would place a SL at the pre-market low)'. This takes profit at the input set in option 1).

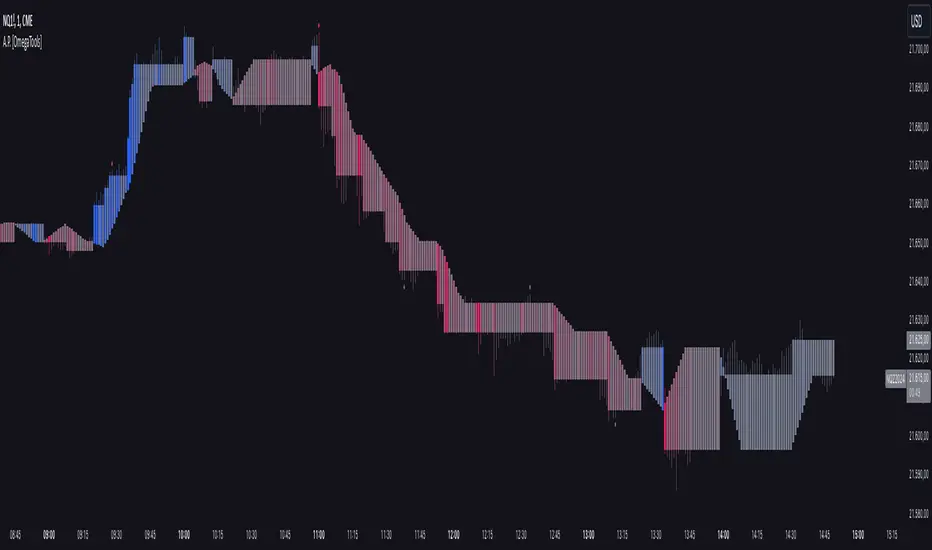
Alternative Price [OmegaTools]The Alternative Price script is a sophisticated and flexible indicator designed to redefine how traders visualize and interpret price data. By offering multiple unique charting modes, robust customization options, and advanced features, this tool provides a comprehensive alternative to traditional price charts. It is particularly useful for identifying market trends, detecting patterns, and simplifying complex data into actionable insights.
This script is highly versatile, allowing users to choose from five distinct charting modes: Candles, Line, Channel, Renko, and Bubbles. Each mode serves a unique purpose and presents price information in an innovative way. When using this script, it is strongly recommended to hide the platform’s default price candles or chart data. Doing so will eliminate redundancy and provide a clearer and more focused view of the alternative price visualization.
The Candles mode offers a traditional candlestick charting style but with added flexibility. Users can choose to enable smoothed opens or smoothed closes, which adjust the way the open and close prices are calculated. When smoothed opens are enabled, the opening price is computed as the average of the actual open price and the closing prices of the previous two bars. This creates a more gradual representation of price transitions, particularly useful in markets prone to sudden spikes or irregularities. Similarly, smoothed closes modify the closing price by averaging it with the previous close, the high-low midpoint, and an exponential moving average of the high-low-close mean. This technique filters out noise, making trends and price momentum easier to identify.
In the Line mode, the script displays a simple line chart that connects the smoothed closing prices. This mode is ideal for traders who prefer minimalism or need to focus on the overall trend without the distraction of individual bar details. The Channel mode builds upon this by plotting additional lines representing the highs and lows of each bar. The resulting visualization resembles a price corridor that helps identify support and resistance zones or price compression areas.
The Renko mode introduces a more advanced and noise-filtering method of visualizing price movements. Renko charts, constructed using the ATR (Average True Range) as a baseline, display blocks that represent a specific price range. The script dynamically calculates the size of these blocks based on ATR, with separate thresholds for upward and downward movements. This makes Renko mode particularly effective for identifying sustained trends while ignoring minor price fluctuations. Additionally, the open and close values of Renko blocks can be smoothed to further refine the visualization.
The Bubbles mode represents price activity using circles or bubbles whose size corresponds to relative volume. This mode provides a quick and intuitive way to assess market participation at different price levels. Larger bubbles indicate higher trading volumes, while smaller bubbles highlight periods of lower activity. This visualization is particularly valuable in understanding the relationship between price movements and market liquidity.
The coloring of candles and other chart elements is a core feature of this script. Users can select between two color modes: Normal and Volume. In Normal mode, bullish candles are displayed in the user-defined bullish color, while bearish candles use the bearish color. Neutral elements, such as midpoints or undecided price movements, are shaded with a neutral color. In Volume mode, the candle colors are dynamically adjusted based on trading volume. A gradient color scale is applied, where the intensity of the bullish or bearish colors reflects the volume for that particular bar. This feature allows traders to visually identify periods of heightened activity and associate them with specific price movements.
Engulfing patterns, a popular technical analysis tool, are automatically detected and marked on the chart when the corresponding setting is enabled. The script identifies long engulfing patterns, where the current bar's range completely encompasses the previous bar’s range and indicates a potential bullish reversal. Similarly, short engulfing patterns are identified where the current bar fully engulfs the previous bar in the opposite direction, suggesting a bearish reversal. These patterns are visually highlighted with circular markers to draw the trader’s attention.
Each feature and mode is highly customizable. The colors for bullish, bearish, and neutral movements can be personalized, and the thresholds for patterns or smoothing can be fine-tuned to match specific trading strategies. The script's ability to toggle between various modes makes it adaptable to different market conditions and analysis preferences.
In summary, the Alternative Price script is a comprehensive tool that redefines the way traders view price charts. By offering multiple visualization modes, customizable features, and advanced detection algorithms, it provides a powerful way to uncover market trends, volume relationships, and significant patterns. The recommendation to hide default chart elements ensures that the focus remains on this innovative tool, enhancing its usability and clarity. This script empowers traders to gain deeper insights into market behavior and make informed trading decisions, all while maintaining a clean and visually appealing chart layout.
Keep in mind that some of the modes of this indicator might not reflect the actual closing price of the underlying asset, before opening a trade, check carefully the actual price!
SUPER RSI [Gabbo]RSI revolutionizes the classic RSI by allowing you to modify its behavior based on different chart types and dynamic multi-source calculations.
It’s designed for traders who want greater precision and adaptability in momentum analysis across various market conditions.
Whether you want to apply the RSI on alternative candles like Heikin Ashi, Renko, or even combine multiple data sources, this tool provides maximum flexibility.
🔷 Key Features
🟩Customizable Chart Inputs
Apply RSI calculations not only on traditional candles but also on alternative bar types like Heikin Ashi, Kagi, Line Break, Point & Figure, and Renko for a deeper understanding of trend strength.
🟩Multi-Source Aggregation
Blend multiple sources together to create a more stable and refined RSI signal. Combine 2, 3, 4, or even 5 different sources into a single input.
🟩Dynamic RSI and Bands
Unlock advanced options to dynamically adjust the RSI itself and its surrounding bands based on real-time price action.
🔷 Technical Details and Customizable Inputs
1️⃣ Bar Type Selection:
Choose the type of chart structure used for RSI calculation:
Candles (classic)
Heikin Ashi
Kagi
Line Break
Point & Figure
Renko
2️⃣ Use Different Source???
Activate multi-source RSI by combining multiple elements:
2 sources : (Source 1 + Source 2) ÷ 2
3 sources : (Source 1 + Source 2 + Source 3) ÷ 3
4 sources : (Source 1 + Source 2 + Source 3 + Source 4) ÷ 4
5 sources : (Source 1 + Source 2 + Source 3 + Source 4 + Source 5) ÷ 5
3️⃣ Use Dynamic RSI???
Enable a dynamic RSI calculation that adjusts in real-time to market behavior for greater responsiveness.
4️⃣ Use Dynamic Band???
Enable dynamic bands that adapt to price action rather than relying on fixed static thresholds.
🔍 How to Use Dynamic RSI Source Pro
📈 Choose Your Candle Type
Select the bar format that best matches your strategy needs—classic candles, Heikin Ashi, Renko, and more.
🧩 Customize Your Data Source
Activate multi-source input to create smoother, more reliable RSI signals.
⚡ Unlock Dynamic Adaptation
Enable dynamic RSI and bands to adjust automatically to live price movements and enhance signal accuracy.
☄️ With Dynamic RSI Source Pro, you can elevate your RSI analysis by applying it dynamically across multiple candle types and sources, giving you a new level of control and precision.

Donchian Channel Alerts R1 by JustUncleLThis idea is based on the Donchain Channel centre line Price action. When price moves from the highest/lowest point, the price will move to the center line first. At this point, the center line acts as dynamic support/resistance and often price will bounce back up. However, if price successfully breaks the centre line (primary entry condition), then prices will tend to catch up to the bottom channel line, many times making further moves in that direction (secondary entry condition).
This script alert idea is designed to be used with Renko (10pip brick recommended) Renko or Heikin Ashi (1 hour recommended) charts. It combines the Donchian Channel centre line price action with a directional coloured EMA (default length 8) to provide entry and exit signals.
There are three options to exit trade:
MA Cross (default exit) = exit occur when price breaks EMA in opposite direction.
Centre Cross = exit occurs when price breaks back passed the centre line in opposite direction.
Brick Colour = exit when a brick/bar paints in the opposite colour to trade direction.
Each Entry and Exit signal creates an Alertcondition that can be picked up by the TradingView Alarm system.
TIPS:
This type of Trading technique only works well in a trending market. Do not try to trade this technique in a ranging/flat market, wait for market to return to trend or pick another pair.
To get 10pip Bricks set Renko to "Traditional" type bricks and 0.001 for non-JPY currency pairs and 0.1 for JPY currency pairs. Also set chart Time frame to 5min or 15mins.
Renko chart:

Vix_Fix Enhanced MTF [Cometreon]The VIX Fix Enhanced is designed to detect market bottoms and spikes in volatility, helping traders anticipate major reversals with precision. Unlike standard VIX Fix tools, this version allows you to control the standard deviation logic, switch between chart styles, customize visual outputs, and set up advanced alerts — all with no repainting.
🧠 Logic and Calculation
This indicator is based on Larry Williams' VIX Fix and integrates features derived from community requests/advice, such as inverse VIX logic.
It calculates volatility spikes using a customizable standard deviation of the lows and compares it to a moving high to identify potential reversal points.
All moving average logic is based on Cometreon's proprietary library, ensuring accurate and optimized calculations on all 15 moving average types.
🔷 New Features and Improvements
🟩 Custom Visual Styles
Choose how you want your VIX data displayed:
Line
Step Line
Histogram
Area
Column
You can also flip the orientation (bottom-up or top-down), change the source ticker, and tailor the display to match your charting preferences.
🟩 Multi-MA Standard Deviation Calculation
Customize the standard deviation formula by selecting from 15 different moving averages:
SMA (Simple Moving Average)
EMA (Exponential Moving Average)
WMA (Weighted Moving Average)
RMA (Smoothed Moving Average)
HMA (Hull Moving Average)
JMA (Jurik Moving Average)
DEMA (Double Exponential Moving Average)
TEMA (Triple Exponential Moving Average)
LSMA (Least Squares Moving Average)
VWMA (Volume-Weighted Moving Average)
SMMA (Smoothed Moving Average)
KAMA (Kaufman’s Adaptive Moving Average)
ALMA (Arnaud Legoux Moving Average)
FRAMA (Fractal Adaptive Moving Average)
VIDYA (Variable Index Dynamic Average)
This gives you fine control over how volatility is measured and allows tuning the sensitivity for different market conditions.
🟩 Full Control Over Percentile and Deviation Conditions
You can enable or disable lines for standard deviation and percentile conditions, and define whether you want to trigger on over or under levels — adapting the indicator to your exact logic and style.
🟩 Chart Type Selection
You're no longer limited to candlestick charts! Now you can use Vix_Fix with different chart formats, including:
Candlestick
Heikin Ashi
Renko
Kagi
Line Break
Point & Figure
🟩 Multi-Timeframe Compatibility Without Repainting
Use a different timeframe from your chart with confidence. Signals remain stable and do not repaint. Perfect for spotting long-term reversal setups on lower timeframes.
🟩 Alert System Ready
Configure alerts directly from the indicator’s panel when conditions for over/under signals are met. Stay informed without needing to monitor the chart constantly.
🔷 Technical Details and Customizable Inputs
This indicator includes full control over the logic and appearance:
1️⃣ Length Deviation High - Adjusts the lookback period used to calculate the high deviation level of the VIX logic. Shorter values make it more reactive; longer values smooth out the signal.
2️⃣ Ticker - Choose a different chart type for the calculation, including Heikin Ashi, Renko, Kagi, Line Break, and Point & Figure.
3️⃣ Style VIX - Change the visual style (Line, Histogram, Column, etc.), adjust line width, and optionally invert the display (bottom-to-top).
📌 Fill zones for deviation and percentile are active only in Line and Step Line modes
4️⃣ Use Standard Deviation Up / Down - Enable the overbought and oversold zone logic based on upper and lower standard deviation bands.
5️⃣ Different Type MA (for StdDev) - Choose from 15 different moving averages to define the calculation method for standard deviation (SMA, EMA, HMA, JMA, etc.), with dedicated parameters like Phase, Sigma, and Offset for optimized responsiveness.
6️⃣ BB Length & Multiplier - Adjust the period and multiplier for the standard deviation bands, similar to how Bollinger Bands work.
7️⃣ Show StdDev Up / Down Line - Enable or disable the visibility of upper and lower standard deviation boundaries.
8️⃣ Use Percentile & Length High - Activate the percentile-based logic to detect extreme values in historical volatility using a customizable lookback length.
9️⃣ Highest % / Lowest % - Set the high and low percentile thresholds (e.g., 85 for high, 99 for low) that will be used to trigger over/under signals.
🔟 Show High / Low Percentile Line - Toggle the visual display of the percentile boundaries directly on the chart for clearer signal reference.
1️⃣1️⃣ Ticker Settings – Customize parameters for special chart types such as Renko, Heikin Ashi, Kagi, Line Break, and Point & Figure, adjusting reversal, number of lines, ATR length, etc.
1️⃣2️⃣ Timeframe – Enables using SuperTrend on a higher timeframe.
1️⃣3️⃣ Wait for Timeframe Closes -
✅ Enabled – Displays Vix_Fix smoothly with interruptions.
❌ Disabled – Displays Vix_Fix smoothly without interruptions.
☄️ If you find this indicator useful, leave a Boost to support its development!
Every feedback helps to continuously improve the tool, offering an even more effective trading experience. Share your thoughts in the comments! 🚀🔥

Intrabar Analyzer [Kioseff Trading]Hello!
This indicator (Intrabar Analyzer) presents intrabar data in various derivative forms.
On-Chart Features
Traditional price data down to 1 min.
Heikin-Ashi price data down to 1 min.
Kagi price data down to 1 min.
Point & Figure price data down to 1 min.
Renko price data down to 1 min.
Linebreak price data down to 1 min.
LinReg channel
SMA
EMA
ALMA
Echomorphic Average (A @kaigouthro special!)
HMA
RMA
WMA
VWMA
VWAP
SWMA
SAR
Supertrend
On-Chart Features
Price x Volume graph
Intrabar technical rating
Positive volume index
Negative volume index
Price volume trend
RSI
%k
ROC
MFI
MFC
OBV
CCI
BBW
CMO
COG
KCW
MOM
RANGE
%r
Let's look at the objects populated by the indicator!
The image above shows what data correlates to the populated graphs!
Let's dial in on the price x volume graph.
The image above provides an example/explanation of the price x volume graph. All data is sourced from a lower timeframe (configurable - default = 1 minute).
Colors are configurable; the plot characters are configurable.
The numbers above show an alternative view of the price x volume graph!
Price graph
The price graph can populate 6 variations of price data: traditional, heikin-ashi, renko, point & figure, line break, and kagi.
The subsequent images will show all available forms of price data, in addition to a randomly selected, on-chart technical indicator!
Kagi + LinReg
Traditional + EMA
Renko + SAR
Point & Figure + ALMA
Heikin-Ashi + Supertrend
Line Break + VWAP
You can display up to three indicators concomitantly - all calculated using intrabar data!
Lastly, the indicator displays the TradingView calculated technical rating for the intrabar.
The technical ratings are multiplied by x100 and oriented left & right of the price box. Left values are negative; right values are positive. The "0" value is not shown; therefore, if the technical rating isn't highlighted then the rating is "0".
The image above shows the technical rating system in action (:
That's it!
This was a fun project and I'm certainly willing to add more - let me know if there's anything you'd like included.
Additionally, a future feature involves compatibility with any custom indicator! Stay tuned; thank you for checking this out (:
Thank you to @kaigouthro, TradingView and @PineCoders for providing some cool libraries to play with!
