Trader Set - Volume MomentumThis is a Momentum indicator but on "Volume" The formula is heavily tweaked version of TSI with chance of using different averaging types, the period numbers are fixed and user don't need to type anything for them!
Please don't contact me for getting access, these tools are available for my students only. These are part of my "methodology" that I teach. The English version of the website and learning material is under development and I will announce it under each related script when they are ready so that those who are interested can participate in the course.
在腳本中搜尋"renko"
Trader Set - Ergodic MomentumThis is a price momentum indicator that is based on Ergodic formula (TSI), but the formula is tweaked and different types of averaging is allowed. by changing the type of average calculation and some predefined values (totally different from what is suggested by now) we get a nasty indicator that can easily be used both for cycle observation side by side with momentum of the price itself !
Please don't contact me for getting access, these tools are available for my students only. These are part of my "methodology" that I teach. The English version of the website and learning material is under development and I will announce it under each related script when they are ready so that those who are interested can participate in the course.

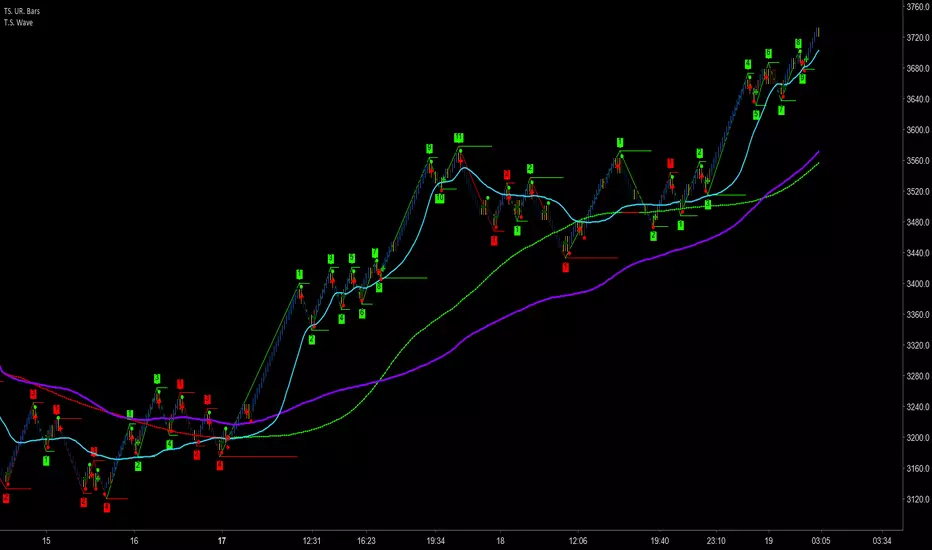
Trader Set - Wave CountThis is a wave counting tool for my methodology with little addition of drawing high low sections of wave reversal as local support / resistance.
Please don't contact me for getting access, these tools are only available for my students. The English version of website and learning materials are under development and soon they will be ready. I will announce it under every script related to my methodology so that you get informed and participate in the course if you want to.
Trader Set - Choppiness Index HelperThis is simply a helper indicator that sits on the chart to mimic the color code of the choppiness index oscillator. It can be used when you maximize the chart to better focus on the chart and other parts of the system.
Please don't ask for getting access, these indicators are available only for my students. The English website and the related learning materials are under development and soon they will be published and I will announce it in the comment section of every related indicator.

Trader Set - Choppiness IndexFinally made this work as desired, time to publish another super useful script in the tool set for my methodology. This indicator easily shows when the market is moving as a CHOPPY market so that traders either don't take position or be very cautious with their positions.

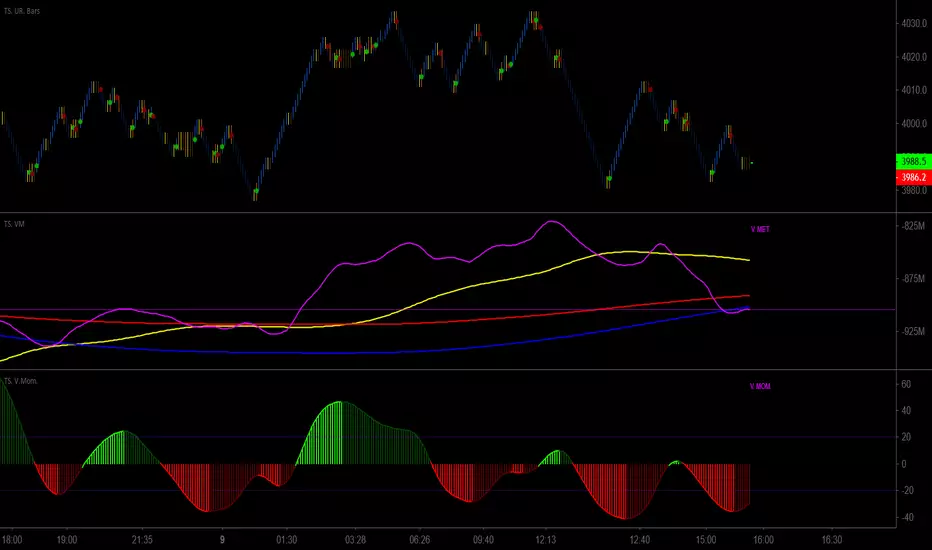
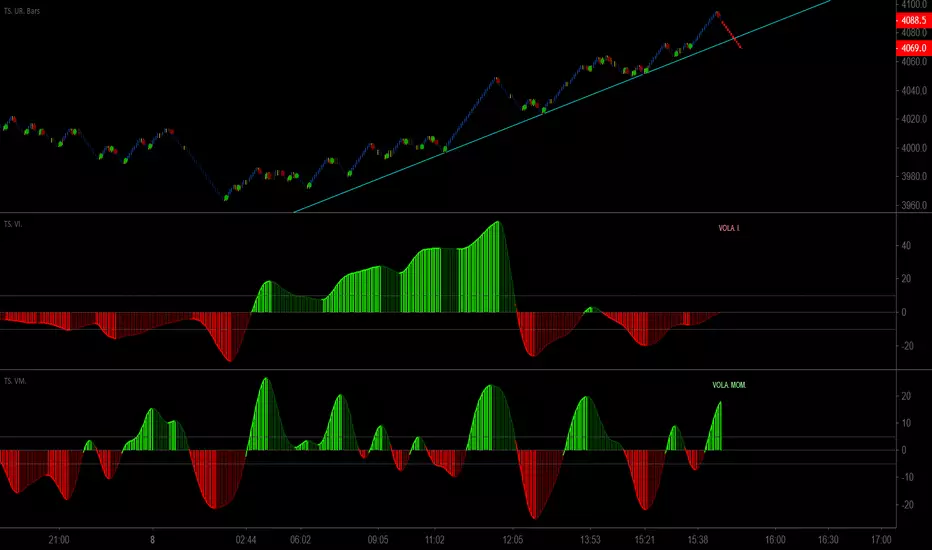
Trader Set - Volatility IndexOne of the last tools I forgot to publish till today. This is a Volatility Index Oscillator that uses a custom and original formula. This tool will be used hand in hand with's momentum one to easily identify the trend reversal points before it actually happens !
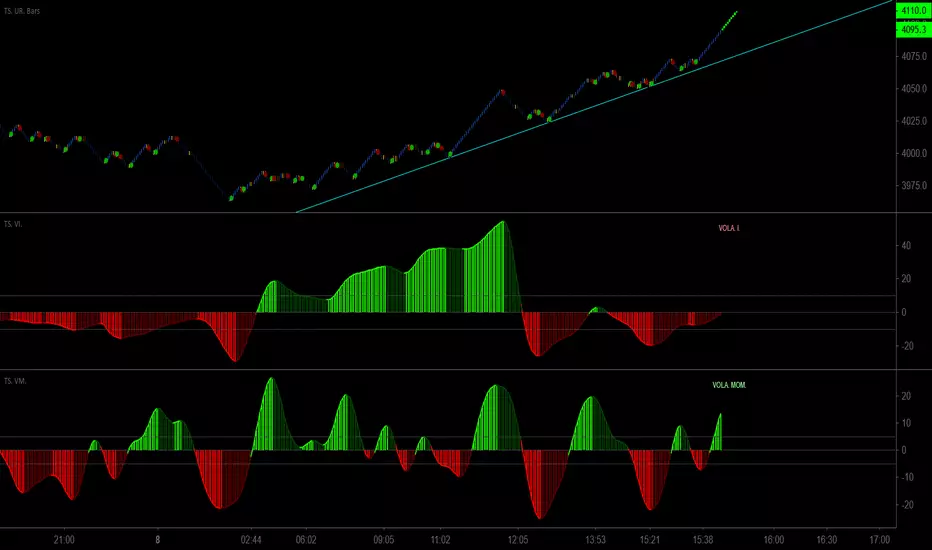
Trader Set - Volatility MomentumThis another one of the tools I missed publishing till today, this is a momentum indicator of volatility index (original formula), it will work hand in hand with volatility index oscillator (will publish right after this one) to easily identify divergences just before the market's direction change !
Paisa Wave SetupPaisa wave setup is made up of below ideas
Trend
****************************
Wave Tunnel
Raghee Wave
Trend pattern
Propulsion (TODO)
Support/ Resistance
****************************
Pivots -Renko
HL levels
Darvas box (TODO)
Oscillators (Individual scripts)
****************************
Slow Stoch
Awesome Oscillator
Trend is your friend.
Base of this script is Trend.
Look for trend on bigger timeframes like 1D, 4Hr & ride the trend with lower timeframes like 1Hr, 30min or 15min.
I have explained my setup many times on my tweet handle TraderPaisa and will continue to do so.
I will be adding more features and more explanation here later.

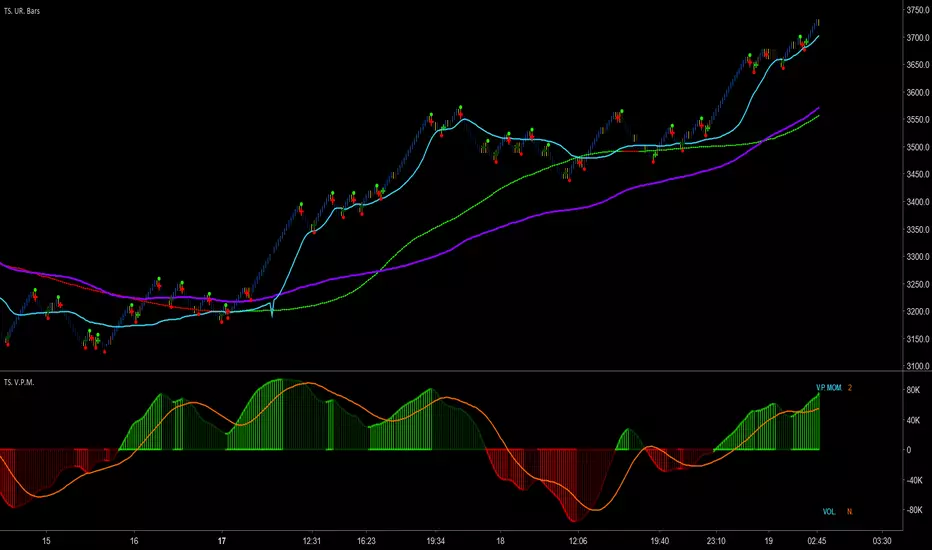
Trader Set - Volume Price MomentumThis is the latest tool in my methodology, a momentum indicator that combines PRICE and VOLUME.
There are two modes that you can use this : Normal, and Power Of Two. In the picture, the top one is set to normal, as you can see, it goes in the negative zone on each retrace, on the bottom one, we set it to the power of two mode, it still shows the same divergence in momentum vs price move but there is no negative section, instead, it only shows the POWER of the momentum without any direction indication.
Please don't contact me for getting access to these tools, they are only available to my students. Right now, the English version of the website and learning material is under development. The moment they are ready, I will announce it under every related script in the comment section.
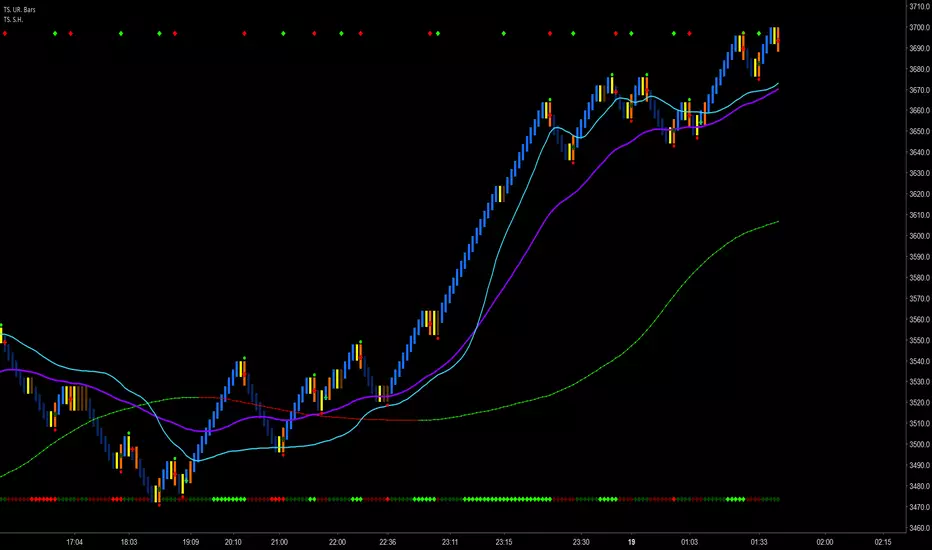
Trader Set - Signal HelperThis is a signalling helper indicator that combines parts of signalling sections of my methodology. Using the provided two parts, it's easy to identify good signals from false ones.
This helper indicator is developed just to make the trader's life easier to identify if there is a possible signal or not, if there is a signal, he/she would need to check other filters and sections of my methodology for approval of a possible trade.
Please don't contact me for access to the script. It'll will only be available for my students. Right now the English part of the website and learning material is under development, as soon as they are ready, I will announce it under each related script for those who are interested for participating in courses.
PpSignal Step Moving AverageStep Moving Average
The indicator calculates the moving average and draws price movement in steps. To some extent, it is similar to a Renko chart, because a new horizontal line is drawn after the prices moves a fixed distance in any direction.

Trader Set - Buy Sell PowerThis is an original oscillator I Developed for my methodology, the Idea and base thought of formula came from MACD, we all know that momentum, if being set correctly, is a leading indicator and actually, it's one of few real leading indicators, keeping that in mind a heavy R&D was done and the result is a formula that can show the momentum of buyers or sellers in the market, for buying momentum, the formula is totally different than selling momentum, but knowing that the correlation is there, I added both formulas into one oscillator that would be easy to understand and use in my methodology.
Please don't contact me for the access, access is given only to my students, the English version of the website and learning material is under development. As soon as they are ready, I will announce it under every related script in comment section.

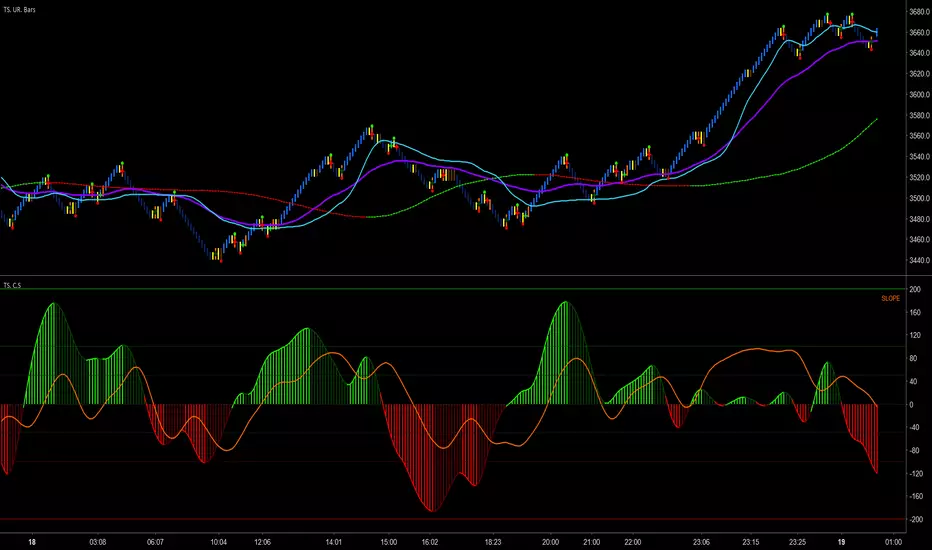
Trader Set - CCI Slope ComboThis is an oscillator that I was doing R&D for developing it, it took near three weeks. If you ever use Super CCI and keep it side by side with slope oscillator, in more than few cases, day in day out, you would find that both of them show similarities. These similarities suggest that there should be a way to combine these two and get a unique indicator that would do both jobs at the same time without the complexity of CCI and WITH simplicity of Slope!
The answer for the R&D was in ehlers books. Well, not the formulas he gave to the world but the concept! Here is a combination behavior of CCI and Slope, if you ever drop ehlers Universal Oscillator near this, you would see where the concept came but they are totally different in look and behavior.
Please don't contact me for access. This is part of my personal methodology that I teach to my students and soon, the English section of my website will be ready with English course for the methodology. When the course is ready I will announce it under every related indicator and those who participate will have access to these indicators.
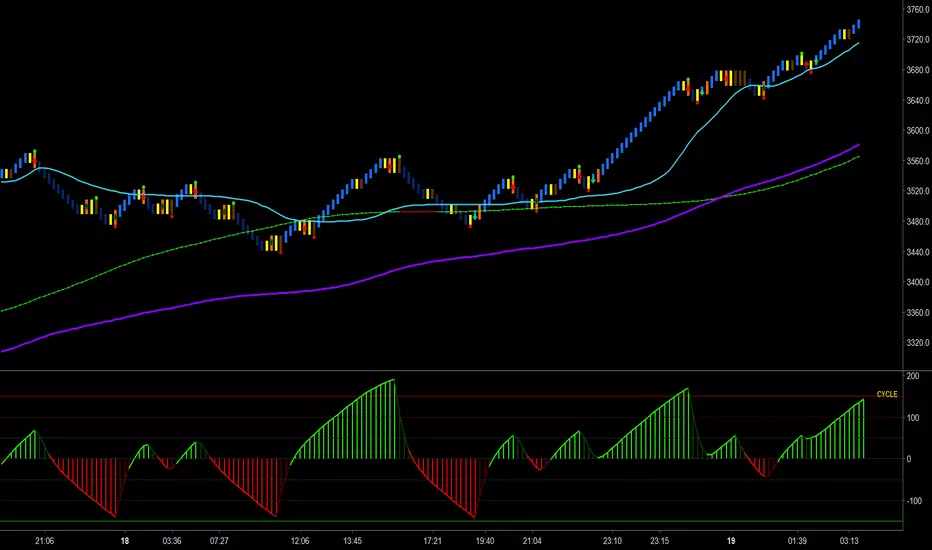
Trader Set CycleA very heavily modified stochastic. As you can see in the picture, not only the range of movement is changes, but also, it's not clamped at 100 and will not clamp at -100. No more nasty noises when stochastic "sticks" to 100 when the price is constantly goes up or vice versa.
Please, don't ask for access, only my students from my classes will have access to this indicator, at least for time being. If at any time in future I wish to sell, you will find the price and how to buy in the comments bellow.
[STRATEGY] MA Cross ElevenThis script is a crossing of eleven different MA, with alerts and SL and TP.
The simplest is what works best...
SMA --> Simple
EMA --> Exponential
WMA --> Weighted
VWMA --> Volume Weighted
SMMA --> Smoothed
DEMA --> Double Exponential
TEMA --> Triple Exponential
HMA --> Hull
TMA --> Triangular
SSMA --> SuperSmoother filter
ZEMA --> Zero Lag Exponential
Using "once per bar close" repaint is 0%, but if you like risk can choose "once per bar", better profit.
Thanks to JustUncleL and his amazing sripts.
Enjoy!
www.tradingview.com
"Note: When using non-standard (Renko, Kagi, Line Break, Point and Figure, Heikin Ashi, Spread Charts) types of chart as a basis for strategy, you need to realize that the result will be different. The orders will be executed at the prices of this chart (e.g.for Heikin Ashi it’ll take Heikin Ashi prices (the average ones) not the real market prices). Therefore we highly recommend you to use standard chart type for strategies."

KTS 1.0IMPORTANT: The indicator documentation can be found by clicking this link .
After a long time in development, it's finally here!
KTS 1.0 is now officially released, featuring massive improvements under the hood compared to the previous beta release.
Kawaii Trading Suite is a full-featured trading suite for TradingView that gives you all the support/resistance information you could possibly need, as well as giving very helpful indicators of several key market states.
Also bundled with KTS are several cryptocurrency-optimized versions of popular indicators.
The completely unique and proprietary indicators are:
Altcoin Sentiment Overlay
Daily/Hourly Support/Resistance Levels
Live Support/Resistance Levels
Extended Support/Resistance Clouds
Overtrend Support/Resistance Clouds
Weak Hands Signal
Live Prediction Levels
Whale Movement Overlay
Whale Movement Hint Overlay
And the bundled, pre-optimized indicators are:
Renko Overlay
Ichimokou Clouds
Moving Averages (2)
Golden Cross Signalling
Bollinger Bands
Keltner Channels
Heiken Ashi Overlay
Of course, there's a mountain of information out there on this stuff and I can't fit everything here. Check out the indicator documentation here.
KTS can be purchased for 0.1BTC.

SapphireTrade indicator based on standard deviation models. To avoid the numerous false trades this can trigger on normal charts, suggested use is with renko charts.

Multi Chart TypeAll the alternate chart types in one renko, kagi, line break, heikin and p&f with a heap of indicators to go with

[BoTo] ATH/2 OverlayThan this indicator is useful?
Can help you to understand this indicator who main in the market now. Bulls or bears.
How it works
All-Time-High ('ATH') - the highest point in price that a cryptocurrency has been in history.
Step 1: The 'ATH' line is drawn
Step 2: 'ATH/2' line is drawn.
Step 3: If the price became more than 'ATH' it means the market bulls have taken, and the price it will be more probable to increase. And vice versa. If the price became less than 'ATH/2' it means that the market was taken by bears, and the price it will be more probable to fall.
Step 4: If it is the bull market, then the green background is drawn. And vice versa. If it is the bear market, then the red background is drawn. If the market has changed, then the background will be gray color. Only one candle.
How to use it
It is possible to use any timeframes, and any symbol.
It is possible to use chart type only the japanese candles, the line or bars. Don't use Kagi, Renko or Haiken Ashi!
The background can be not shown. You can make 1 or 2 lines. If you have chosen only 1 line, then in the bull market you will see only 'ATH/2' line. And vice versa. In the bear market you will see only the 'ATH' line.
You need just to turn on this indicator once to understand what to wait in this market, big falling or big rockets for. And to switch off it that he didn't prevent to analyze.
It is the good help for long-term investments (the position can be longer than 1 year)
For an example
'Ethereum'
'Ripple'
We tried for you. We want to receive your like for good work.

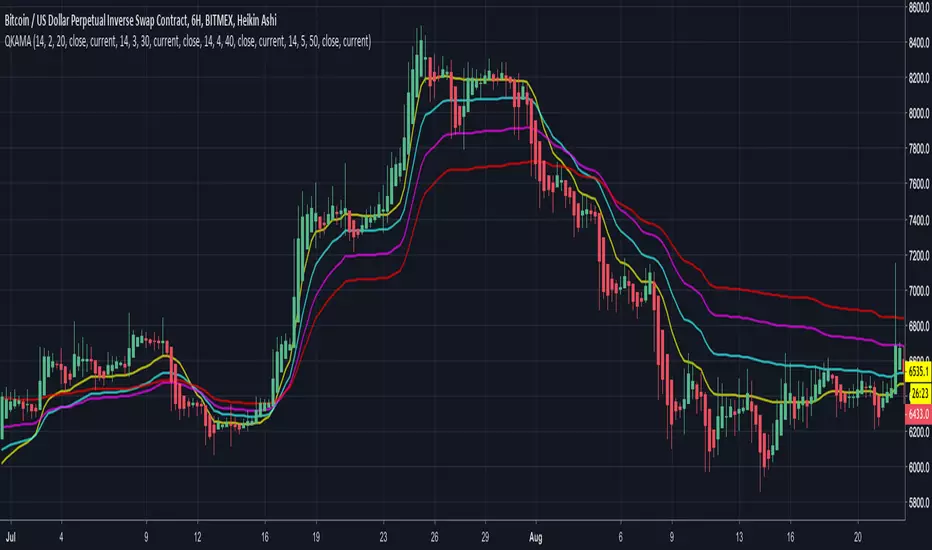
Quadruple Kaufman Adaptive Moving AverageFour Kaufman Adaptive Moving Averages in one script. Useful for identifying trends and setting points to add to positions / exit trades. KAMA's are great for keeping you in trending markets and avoiding sideways chops and ranges. Try them out by tweaking the fast/slow ma's and lengths to get the right set for your charts that removes the thinking about whether to be long or short and when to add to positions.
A suggested trading strategy is to tweak the ma's (often you'll want larger values) until they span the price action well on past trends. Then each time price action closes and crosses one of your KAMA lines is an opportunity to add to your position. Once all lines are cleared and you've loaded up your position, hopefully your average price of entry falls short of the highest KAMA line's value. Once this happens you don't need to get out the trade until such time as a price close crosses again that largest KAMA line. For eager profit takers, close positions once any KAMA line is crossed once you're successfully loaded up on a direction.
I use this script with a renko chart and values -> 26 length 6 fast ma 100 slow ma, 26 8 100, 26 10 100, 26 12 100 and it's good to see these moving averages, unlike regular moving averages, bend around choppy action that come when trends pause, keeping me successfully in winning trades. Give it a try.
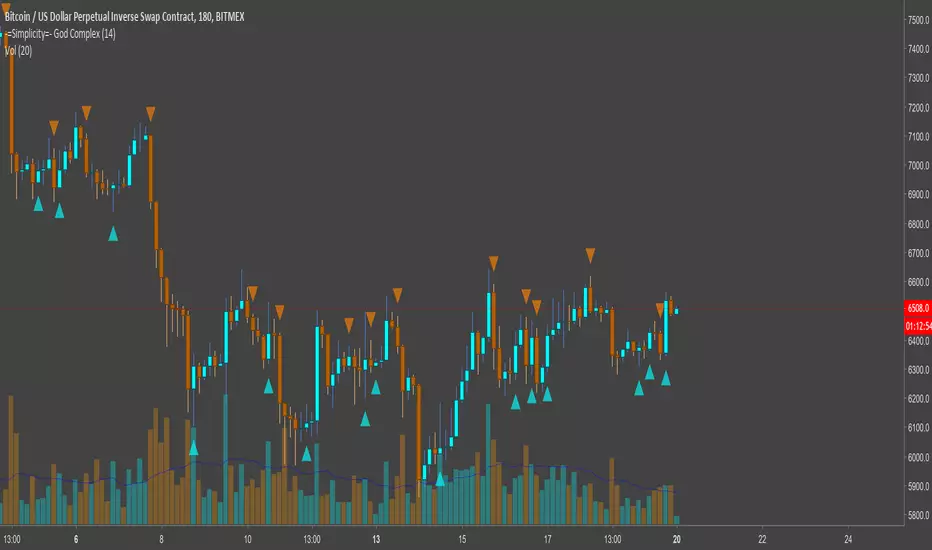
-=Simplicity=- God ComplexMaking money is simple when you wield untold power
-=Simplicity=- God Complex is a non-repaint, set-and-forget indicator for identifying optimum times to enter and exit the market, with both longs and shorts.
Applicable to any asset-type, market, candle type and timeframe, God Complex is a quintessential tool for both new and veteran traders.
With only one variable to change it will take a minimal amount of time to find a value that suits you. As a rule of thumb, the higher the value the less it will fire signals, but the safer those signals will be.
You can also opt to only enable 'Long' or 'Short' signals on the chart. This is meaningful when trading leverage or margin along trend that you are able to identify.
This can be used as a guide for manual trading, but is best utilized as a tool for automating trades so that you don't miss out on any market activity.
This is a link to a document elucidating a little more on the script: docs.google.com
---------------------
Here are a few charts showing how the script performs against them. Enjoy.
Below is a chart depicting XBTUSD (BitMEX) on a 30M timeframe. Both longs and shorts are enabled and the variable is set to a value of 144.
Below here we have a chart for BNBBTC (Binance) on a 1HR timeframe with variable set to a value of 14 on Heikin Ashi candles. Large orange arrows are shorts and smaller blue arrows are closing shorts. There's a clear downtrend, hence we're only shorting.
This is EOSBTC (Bitfinex) on a 2HR timeframe with a variable set to 7 on Renko charts. Small orange arrows are exiting a long position and large blue arrows are entering a long position. The uptrend is obvious to see, so that's why we're mainly displaying longs here.
Not that I reccommend anyone to trade such a small timeframe, but this is for all you scalpers out there. XBTUSD (BitMEX) on a 1M timeframe with a variable value of 233. Both longs and shorts are enabled for this chart. Normal bar candles apply.
Finally, this is ARKBTC (BitTrex) on a 2HR timeframe against a 500R chart with a variable of 377. Only shorts are enabled, as we're in a downtrend.
---------------------
Please contact @overttherainbow on Telegram if you'd like to discuss anything, alternatively reach out to me here (although Telegram is better for a quick response; I'll be around 9AM-11PM GMT)