forex session - Opening-Range- JayyMy first try on anything forex. Let me know if it needs adjustment.
This is Opening Range for forex
Targets set at 127% , 162%, 200 %, 262 %, 362%, 423%, 685%, 1109% and 1794%
of the selected opening range. You can adjust targets as you like in the dialogue box
362%, 423%, 685%, 1109% and 1794% levels will not show unless selected in the dialogue box.
Check any one (only one) of the time periods to change the opening range period to suit.
New York opens at 8:00 am to 5:00 pm EST (EDT)
Tokyo opens at 7:00 pm to 4:00 am EST (EDT)
Sydney opens at 5:00 pm to 2:00 am EST (EDT)
London opens at 3:00 am to 12:00 noon EST (EDT)
Because the actual forex day starts at 5pm it is not possible to plot some time periods correctly
ie try 120 minutes on the New York session. (Although this is not a problem with the other sessions)
If you keep to an hour or less and use periods that divide evenly into an hour all will be fine. All periods will actually work but will start looking a little funny.
No such problem occurs if you just use 5pm est to 5 pm est. other sessions could be put in as options or hard wired in with a few lines of script changes
There is an option in the dialogue box to display fib targets within Opening Range itself.
In the far past I adapted some original work created by Chris Moody from a 7-07-2014 script - there have been multiple adaptations . The script layout/ structure remains similar and messages regarding targets achieved (lines 224 - 230) are from the original script. In the original Chris gave Special Thanks To "The Coding Genius Behind The Curtain" - so hat tip to both.
在腳本中搜尋"session"

Code for All 4 Forex Sessions W/ Background Highlight!!!This is one indicator including the New York Session, Australia Session, Asian Session, Europe Session. IMPORTANT - This template is set up based on East Coast (NY Time). Currently you have to go in to code to change times. Link in 1st Post to VIDEO walking you through the steps. Specific details in 1st Post.

Dual Session Range Boxes with FIB Lines█ OVERVIEW
The Dual Session Range Boxes with FIB Lines indicator is a powerful tool for identifying and visualizing Range Breakout or Inside Boxes Strategy setups with dual session tracking, customizable Fibonacci extensions, and trade zone levels. Perfect for traders who focus on session-based strategies across multiple markets.
█ FEATURES
◆ DUAL SESSION RANGES
- Range 1: Defines the Range (ORB) based on a specific time window
- Range 2: Extends the Range levels throughout a second session for trade management
- Both ranges can be independently configured with preset sessions or custom times
◆ SESSION PRESETS
- Tokyo Session (00:00 - 09:00)
- London Session (08:00 - 17:00)
- New York Session (14:00 - 21:00)
- Pre Market Session (10:00 - 15:30)
- Custom Time: Define your own session windows
◆ FIBONACCI EXTENSION LEVELS
- Automatically calculated from Range 1 High/Low
- Buy Side Levels: Projected above the range (green)
- Sell Side Levels: Projected below the range (red)
- 10 customizable Fib levels with individual on/off toggles:
- 23.6%, 38.2%, 50%, 61.8%, 78.6%, 100%, 127.2%, 161.8%, 200%, 261.8%
- Special color highlighting for key levels (50%, 100%, 200%)
- All percentage values are fully editable
◆ INSIDE TRADE ZONES
- Two horizontal lines drawn inside the Range 1 box
- Configurable percentage from High/Low (default: 10%)
- Helps identify premium/discount zones within the range
◆ LABELS & DISPLAY OPTIONS
- Show/hide price values on labels
- Show/hide percentage values on labels
- Adjustable label size (Tiny, Small, Normal, Large, Huge)
- Configurable label offset (distance above lines)
- Multiple rounding options for price display:
- 0.25 (quarter points - ideal for indices)
- 0.1 (tenth points)
- 0.01 (two decimals)
◆ STYLE CUSTOMIZATION
- Independent fill and border colors for both ranges
- Adjustable border width (1-5)
- Line style options: Solid, Dashed, Dotted
- Separate color settings for:
- Buy side Fibonacci levels
- Sell side Fibonacci levels
- Trade zone lines
- Special levels (50%, 100%, 200%)
◆ HISTORICAL DATA CONTROL
- Toggle to show/hide historical sessions
- Current session always remains visible
- Clean chart view when analyzing only the active session
█ HOW TO USE
1. Set your timezone in General settings
2. Configure Range 1 to capture your desired Opening Range period
3. Configure Range 2 to define how long levels should extend
4. Adjust Fibonacci levels based on your trading strategy
5. Use Trade Zones to identify key areas within the range
6. Toggle historical data on/off based on your analysis needs
█ USE CASES
- Opening Range Breakout (ORB) strategies
- Session-based trading (London, New York, Tokyo, Pre-Market)
- Fibonacci extension targets for breakout trades
- Identifying support/resistance from session ranges
- Multi-session analysis and confluence zones
█ NOTES
- Indicator works on timeframes lower than Daily
- All times are based on the selected timezone setting
- Range 2 only activates after Range 1 completes
- Fibonacci levels extend from Range 1 start to Range 2 end
Let me know if you like to have any enhancements.
Leave a like if you like it!

Asia & London Session Boxes (NY Time) + 4H SwingsAsia & London Session Boxes + 4H Swings
Description
A multi-timeframe session analysis tool designed for forex and futures traders operating on NY time. This indicator visualizes major trading sessions with automatic high/low range boxes while simultaneously tracking 4-hour swing levels, giving you a complete picture of institutional trading activity and key price levels.
How It Works
Session Boxes (NY Time Zone)
Asia Session (20:00 – 00:00 NY): Blue-shaded box marking the complete range from open to close
London Session (02:00 – 06:00 NY): Yellow-shaded box capturing the high-volatility London open
Each session box automatically records the highest high and lowest low during that timeframe, providing instant reference for session extremes and potential supply/demand zones.
4-Hour Swing Levels
Detects swing highs and lows on a 30-minute timeframe for ultra-responsive level identification
Red lines: Swing highs (resistance levels)
Green lines: Swing lows (support levels)
Lines extend to the right for continuous monitoring
Auto-removes touched levels: When price breaches a swing, it automatically deletes that level to keep your chart clean and focused on active levels
Key Features
Session-Based Trading Analysis: Identify which session created important price levels and ranges
Multi-Timeframe Architecture: Analyzes 30-minute swings while tracking 4-hour patterns on your current chart
Smart Level Cleanup: Touched swings automatically remove themselves, eliminating clutter
NY Time Conversion: All times automatically adjust to your NY timezone for consistency
Institutional Perspective: View exactly where institutions are trading during major session hours
Zero Lag Detection: Real-time identification of swing extremes
Ideal For
Forex traders (especially EUR/USD, GBP/USD) targeting session breakouts
Scalpers and swing traders needing precise support/resistance levels
Market structure traders analyzing institutional price action
Session traders looking to trade Asia/London opens
1-minute to 4-hour timeframe charts
Trading Applications
Trade Asia session breakouts into London
Identify liquidity zones from previous sessions
Detect swing extremes for entry/exit planning
Confirm trend direction using multi-session structure
Find support/resistance on intraday pullbacks
Default Settings Optimized For
NASDAQ futures and forex pairs
Scalping and short-term swing trading
NY timezone trading (automatically converts UTC-4)
30-minute swing detection for precise level identification

WorldCup Dashboard + Institutional Sessions© 2025 NewMeta™ — Educational use only.
# Full, Premium Description
## WorldCup Dashboard + Institutional Sessions
**A trade-ready, intraday framework that combines market structure, real flow, and institutional timing.**
This toolkit fuses **Institutional Sessions** with a **price–volume decision engine** so you can see *who is active*, *where value sits*, and *whether the drive is real*. You get: **CVD/Delta**, volume-weighted **Momentum**, **Aggression** spikes, **FVG (MTF)** with nearest side, **Daily Volume Profile (VAH/POC/VAL)**, **ATR regime**, a **24h position gauge**, classic **candle patterns**, IBH/IBL + **first-hour “true close”** lines, and a **10-vote confluence scoreboard**—all in one view.
---
## What’s inside (and how to trade it)
### 🌍 Institutional Sessions (Sydney • Tokyo • London • New York)
* Session boxes + a highlighted **first hour**.
* Plots the **true close** (first-hour close) as a running line with a label.
**Use:** Many desks anchor risk to this print. Above = bullish bias; below = bearish. **IBH/IBL** breaks during London/NY carry the most signal.
### 📊 CVD / Delta (Flow)
* Net buyer vs seller pressure with smooth trend state.
**Use:** **Rising CVD + acceptance above mid/POC** confirms continuation. Bearish price + rising CVD = caution (possible absorption).
### ⚡ Volume-Weighted Momentum
* Momentum adjusted by participation quality (volume).
**Use:** Momentum>MA and >0 → trend drive is “real”; <0 and falling → distribution risk.
### 🔥 Aggression Detector
* ROC × normalized volume × wick factor to flag **forceful** candles.
**Use:** On spikes, avoid fading blindly—wait for pullbacks into **aligned FVG** or for aggression to cool.
### 🟦🟪 Fair Value Gaps (with MTF)
* Detects up to 3 recent FVGs and marks the **nearest** side to price.
**Use:** Trend pullbacks into **bullish FVG** for longs; bounces into **bearish FVG** for shorts. Optional threshold to filter weak gaps.
### 🧭 24h Gauge (positioning)
* Shows current price across the 24h low⇢high with a mid reference.
**Use:** Above mid and pushing upper third = momentum continuation setups; below mid = sell the rips bias.
### 🧱 Daily Volume Profile (manual per day)
* **VAH / POC / VAL** derived from discretized rows.
**Use:** **POC below** supports longs; **POC above** caps rallies. Fade VAH/VAL in ranges; treat them as break/hold levels in trends.
### 📈 ATR Regime
* **ATR vs ATR-avg** with direction and regime flag (**HIGH / NORMAL / LOW**).
**Use:** HIGH ⇒ give trades room & favor trend following. LOW ⇒ fade edges, scale targets.
### 🕯️ Candle Patterns (contextual, not standalone)
* Engulfings, Morning/Evening Star, 3 Soldiers/Crows, Harami, Hammer/Shooting Star, Double Top/Bottom.
**Use:** Only with session + flow + momentum alignment.
### 🤝 Price–Volume Classification
* Labels each bar as **continuation**, **exhaustion**, **distribution**, or **healthy pullback**.
**Use:** Align continuation reads with trend; treat “Price↑ + Vol↓” as a caution flag.
### 🧪 Confluence Scoreboard & B/S Meter
* Ten elements vote: 🔵 bull, ⚪ neutral, 🟣 bear.
**Use:** Execution filter—take setups when the board’s skew matches your trade direction.
---
## Playbooks (actionable)
**Trend Pullback (Long)**
1. London/NY active, Momentum↑, CVD↑, price above 24h mid & POC.
2. Pullback into **nearest bullish FVG**.
3. Invalidate under FVG low or **true-close** line.
4. Targets: IBH → VAH → 24h high.
**Range Fade (Short)**
1. Asia/quiet regime, **Price↑ + Vol↓** into **VAH**, ATR low.
2. Nearest FVG bearish or scoreboard skew bearish.
3. Invalidate above VAH/IBH.
4. Targets: POC → VAL.
**News/Impulse**
Aggression spike? Don’t chase. Let it pull back into the aligned FVG; require CVD/Momentum agreement before entry.
---
## Alerts (included)
* **Bull/Bear Confluence ≥ 7/10**
* **Intraday Target Achieved** / **Daily Target Achieved**
* **Session True-Close Retests** (Sydney/Tokyo/London/NY)
*(Keep alerts “Once per bar” unless you specifically want intrabar triggers.)*
---
## Setup Tips
* **UTC**: Choose the reference that matches how you track sessions (default UTC+2).
* **Volume threshold**: 2.0× is a strong baseline; raise for noisy alts, lower for majors.
* **CVD smoothing**: 14–24 for scalps; 24–34 for slower markets.
* **ATR lengths**: Keep defaults unless your asset has a persistent regime shift.
---
## Why this framework?
Because **timing (sessions)**, **truth (flow)**, and **location (value/FVG)** together beat any single signal. You get *who is trading*, *how strong the push is*, and *where risk lives*—on one screen—so execution is faster and cleaner.
---
**Disclaimer**: Educational use only. Not financial advice. Markets are risky—backtest and size responsibly.

TLA20 - Multi-Session Box and Level ToolTLA20 is a highly customizable indicator designed to enhance intraday analysis by marking predefined trading sessions, key levels, and midpoints directly on your charts. With its versatile features, TLA20 is ideal for traders looking to visualize multiple time zones, daily price ranges, and historical reference levels efficiently.
Key Features:
Session Visualization: Mark up to three custom trading sessions with distinct start and end times, adjustable for different time zones and weekend inclusions.
Dynamic Highlights: Automatically draw session highs, lows, midlines, and open prices with options to extend beyond session bounds.
Custom Styling: Configure border colors, styles, and fill options for each session box to match your chart preferences.
Historical Levels: Highlight previous daily highs/lows, weekly highs/lows, and monthly highs/lows for improved context in your trading.
Intuitive Adjustments: Enable or disable each feature and customize settings for precise alignment with your trading strategy.
Use Cases:
Track trading sessions across different markets and time zones.
Identify key price levels like session midpoints and opens for entry/exit strategies.
Overlay historical levels to recognize potential support and resistance areas.
This indicator does not provide direct trading signals but serves as a robust tool for enhancing technical analysis.
Disclaimer: The script is provided “as is” without warranties of any kind. Always test on a demo account before applying in live markets.

NY Killzone (Morning, Lunch, Afternoon)Indicator for New York session that splits Morning, Lunch and Afternoon part of the session.
Works on Time Frames of 30m and below.
Range Deviations PRO | Trade SymmetryRange Deviations PRO — Extended Session Levels
An enhanced version of the original Range Deviations by @joshuuu, retaining the full core logic while adding a key upgrade:
🔹 All session ranges, midlines, and deviation levels now extend into the next trading session, giving seamless multi-session context.
Supports Asia, CBDR, Flout, ONS, and Custom Sessions — with options for half/full standard deviations, equilibrium, and range boxes exactly as in the original.
Extending these levels helps identify:
• Liquidity sweeps
• Trap moves / false breaks
• Daily high/low projections
• Premium–discount behavior across sessions
Ideal for traders using ICT concepts who want clearer continuation of session structure into the next day.
Credit: Original logic by @joshuuu — enhancements by TradeSymmetry.
Disclaimer: Educational use only. Not financial advice.

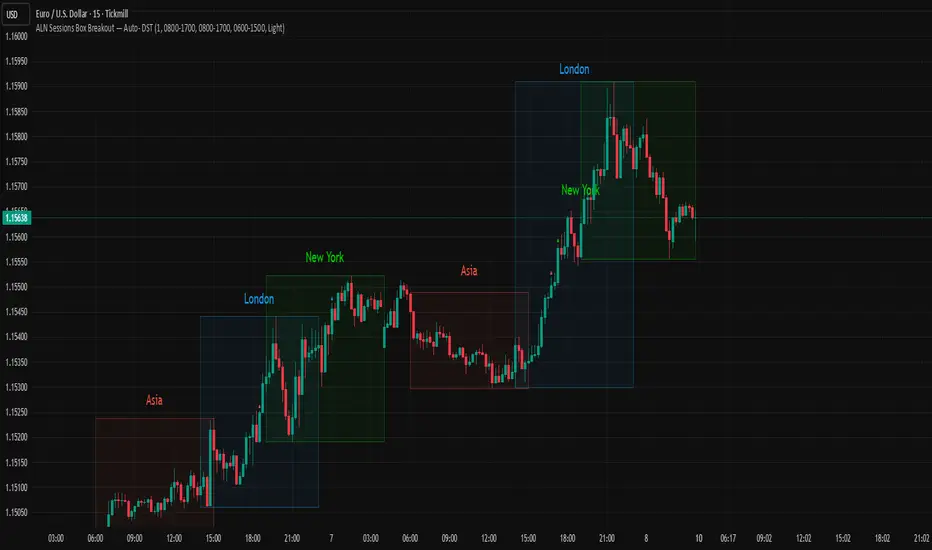
ALN Sessions Box — Auto- DSTDevoleper: Sheikh Rakib
What it does
Draws candle-synced high/low range boxes for the three major sessions—Asia (Dhaka view), London, and New York—on any timeframe. London and New York are DST-aware (times auto-shift on DST changes). Boxes update live with session high/low and close exactly on the session’s final bar.
Key features
Auto-DST: Uses Europe/London and America/New_York time zones, so session windows auto-adjust when DST turns on/off.
Asia (BDT) window: Default 06:00–15:00 Asia/Dhaka (no DST).
Candle-linked boxes: Top/bottom track session High/Low; right edge finalizes on the session end bar—clean breakout zones.
Clean UI: Optional labels, outline toggle, and three opacity presets (Dark/Medium/Light).
Plug & play: Drop in, customize colors/times, done.
Inputs you can tweak
Time Range (LOCAL) for each session
Defaults: Asia 06:00–15:00 (Asia/Dhaka), London 08:00–17:00 (Europe/London), New York 08:00–17:00 (America/New_York)
For equities, switch New York to 09:30–16:00—DST handling remains automatic.
Colour per session, Show Session Labels, Show Range Outline, Opacity Preset.
UTC Offset input is retained for compatibility but not used for session detection.
Quick BDT reference (for the default 08:00–17:00 local windows)
London → DST ON (BST): 13:00–22:00 BDT · DST OFF (GMT): 14:00–23:00 BDT
New York → DST ON (EDT): 18:00–03:00 BDT (next day) · DST OFF (EST): 19:00–04:00 BDT (next day)
Asia (Dhaka) → 06:00–15:00 BDT (no DST)
Tips
If you see dotted vertical lines, that’s TradingView Session breaks (Chart Settings → Appearance). Turn off if you prefer a cleaner view.
Some symbols don’t trade during parts of a session—adjust Time Range as needed.
Labels are placed inside the box; adjust opacity/colors to suit your theme.
A sharp, professional session map for spotting breakouts, reversals, and volatility windows at a glance.
AutoDay MA (Session-Normalized)📊 AutoDay MA (Session-Normalized Moving Average)
⚡ Daily power, intraday precision.
AutoDay MA automatically converts any N-day moving average into the exact equivalent on your current intraday timeframe.
💡 Concept inspired by Brian Shannon (Alphatrends) – mapping daily MAs onto intraday charts by normalizing session minutes.
🛠 How it works
Set Days (N) (e.g., 5, 10, 20).
Define Session Minutes per Day (⏱ 390 = US RTH, 🌍 1440 = 24h).
The indicator detects your chart’s timeframe and computes:
Length = (Days × SessionMinutes) / BarMinutes
Applies your chosen MA type (📐 SMA / EMA / RMA / WMA) with rounding (nearest, up, down).
Displays all details in a clear corner info panel.
✅ Why use it
Consistency 🔄: Same 5-day smoothing across all intraday charts.
Session-aware 🕒: Works for equities, futures, FX, crypto.
Transparency 🔍: Always shows the math & final MA length.
Alerts built-in 🔔: Cross up/down vs. price.
📈 Examples
5-Day on 1m → 1950-period MA
5-Day on 15m → 130-period MA
5-Day on 65m → 30-period MA
10-Day on 24h/15m (crypto) → 960-period MA

Bullish Breakaway Dual Session-Publish-Consolidated FVG
Inspired by the FVG Concept:
This indicator is built on the Fair Value Gap (FVG) concept, with a focus on Consolidated FVG. Unlike traditional FVGs, this version only works within a defined session (e.g., ETH 18:00–17:00 or RTH 09:30–16:00).
Bullish consolidated FVG & Bullish breakaway candle
Begins when a new intraday low is printed. After that, the indicator searches for the 1st bullish breakaway candle, which must have its low above the high of the intraday low candle. Any candles in between are part of the consolidated FVG zone. Once the 1st breakaway forms, the indicator will shades the candle’s range (high to low). Then it will use this candle as an anchor to search for the 2nd, 3rd, etc. breakaways until the session ends.
Session Reset: Occurs at session close.
Repaint Behavior:
If a new intraday (or intra-session) low forms, earlier breakaway patterns are wiped, and the system restarts from the new low.
Counter:
A session-based counter at the top of the chart displays how many bullish consolidated FVGs have formed.
Settings
• Session Setup:
Choose ETH, RTH, or custom session. The indicator is designed for CME futures in New York timezone, but can be adjusted for other markets.
If nothing appears on your chart, check if you loaded it during an inactive session (e.g., weekend/Friday night).
• Max Zones to Show:
Default = 3 (recommended). You can increase, but 3 zones are usually most useful.
• Timeframe:
Best on 1m, 5m, or 15m. (If session range is big, try higher time frame)
Usage
1. Avoid Trading in Wrong Direction
• No bullish breakaway = No long trade.
• Prevents the temptation to countertrade in strong downtrends.
2. Catch the Trend Reversal
• When a bullish breakaway appears after an intraday low, it signals a potential reversal.
• You will need adjust position sizing, watch out liquidity hunt, and place stop loss.
• Best entries of your preferred choices: (this is your own trading edge)
Retest
Breakout
Engulf
MA cross over
Whatever your favorite approach
• Reversal signal is the strongest when price stays within/above the breakaway candle’s
range. Weak if it breaks below.
3. Higher Timeframe Confirmation
• 1m can give false reversals if new lows keep forming.
• 5m often provides cleaner signals and avoids premature reversals.
Failed Trade Example:
This indicator will repaint if a new intraday session low is updated. So it is possible to have a failed trade. Here is an example from the same session in 1m chart. However, if you enter the trade later at another bullish breakaway candle signal. The loss can be mitigated by the profit.
Therefore you should use smaller position size for your 1st trade. You should also considering using 5m chart to avoid 1m bull trap. In this example, if you use 5m chart, you can totally avoid this failed trade.
If you enter the trade, you will see the intraday low is stop loss hunted. You can also see the 1st bullish breakaway candle is super weak. There are a lot of candles below the breakaway candle low, so it is very possible to fail.
In the next chart, you can see the failed traded get stop loss hunted. However you can enter another trade with huge profit to win back the loss from the 1st trade if you follow the rule.
Summary
This indicator offers 3 main advantages:
1. Prevents wrong-direction trades.
2. Confirms trend entry after reversal signals.
3. Filters false positives using higher timeframes.
How to sharp your edge:
1. ⏳Extreme patience⏳: Do not guess the bottom during a downtrend before a confirmed bullish breakaway candle. If you get caught, have the courage to cut loss. This is literally the most important usage of this indicator. Again, this is the most important rule of this indicator and actually the hardest rule to follow.
2. 🛎Better Entry🛎: After a confirmed bullish breakaway, you will always have a good opportunity to enter the trade using established trading technique. Your edge will come from the position size, draw down, stop loss placement, risk/reward ratio.
3. ✂Cut loss fast✂: If you enter a trade according to the rule, but you are still not making profit for a period of time, and the price is below the low of the breakaway candle. It is very likely you may hit stop loss soon (intraday session low). It won't be a bad idea to cut loss before stop loss hit.
4. 🔂Reentry with confidence after stop loss🔂: a stop loss will not invalidate the indicator. If you see a second chance to reenter, you should still follow the trade guide and rule.
5. 🕔Time frame matter🕔: try 1m, 3m, 5m, 10m, 15m time frame. Over time, you should know what time frame work best for you and the market. Higher time frame will reduce the noise of false positive trade, but it comes with a higher stop loss placement and less max profit, however it may come with a lower draw down. Time frame will matter depending on the range of the session. If the session range is small (<0.5%), lower time frame is good. If session range is big (>1%), 5m time frame is better. Remember to wait for candle to close, if you use higher time frame.
Last Mention:
The indicator is only used for bullish side trading.

ADR/ATR Session No Probability Table by LKHere you go—clear, English docs you can drop into your script’s description or share with teammates.
ADR/ATR Session by LK — Overview
This indicator summarizes Average Daily Range (ADR) and Average True Range (ATR) for two horizons:
• Session H4 (e.g., 06:00–13:00 on a 4‑hour chart)
• Daily (D)
It shows:
• Current ADR/ATR values (using your chosen smoothing method)
• How much of ADR/ATR today/this bar has already been consumed (% of ADR/ATR)
• ADR/ATR as a percent of price
• Optional probability blocks: likelihood that %ADR will exceed user‑defined thresholds over a lookback window
• Optional on‑chart lines for the current H4 and Daily candles: Open, ADR High, ADR Low
⸻
What the metrics mean
• ADR (H4 / D): Moving average of the bar range (high - low).
• ATR (H4 / D): Moving average of True Range (max(hi-lo, |hi-close |, |lo-close |)).
• % of ADR (curr H4): (H4 range of the current H4 bar) / ADR(H4) × 100. Updates live even if the current time is outside the session.
• % of ADR (Daily): (today’s intra‑day range) / ADR(D) × 100.
• % of ATR (curr H4 / Daily): TR / ATR × 100 for that horizon.
• ADR % of Price / ATR % of Price: ADR or ATR divided by current price × 100 (a quick “volatility vs. price” gauge).
Session logic (H4): ADR/ATR(H4) only update on bars that fall inside the configured session window; outside the window the values hold steady (no recalculation “bleed”).
Daily range tracking: The indicator tracks today’s high/low in real‑time and resets at the day change.
⸻
Inputs (quick reference)
Core
• Length (ADR/ATR): smoothing length for ADR/ATR (default 21).
• Wait for Higher TF Bar Close: if true, updates ADR/ATR only after the higher‑TF bar closes when using request.security.
Timeframes
• Session Timeframe (H4): default 240.
• Daily Timeframe: default D.
Session time
• Session Timezone: “Chart” (default) or a fixed timezone.
• Session Start Hour, End Hour (minutes are fixed to 0 in this version).
Smoothing methods
• H4 ADR Method / H4 ATR Method: SMA/EMA/RMA/WMA.
• Daily ADR Method / Daily ATR Method: SMA/EMA/RMA/WMA.
Table appearance
• Table BG, Table Text, Table Font Size.
Lines (optional)
• Show current H4 segments, Show current Daily segments
• Line colors for Open / ADR High / ADR Low
• Line width
Probability
• H4 Probability Lookback (bars): number of H4 bars to examine (e.g., 300).
• Daily Probability Lookback (days): number of D bars (e.g., 180).
• ADR thresholds (%): CSV list of thresholds (e.g., 25,50,55,60,65,70,75,80,85,90,95,100,125,150).
The table will show the % of lookback bars where %ADR ≥ threshold.
Tip: If you want probabilities only for session H4 bars (not every H4 bar), ask and I can add a toggle to filter by inSess.
⸻
How to read the table
H4 block
• ADR (method) / ATR (method): the session‑aware averages.
• % of ADR (curr H4): live progress of this H4 bar toward the session ADR.
• ADR % of Price: ADR(H4) relative to price.
• % of ATR (curr H4) and ATR % of Price: same idea for ATR.
H4 Probability (lookback N bars)
• Rows like “≥ 80% ADR” show the fraction (in %) of the last N H4 bars that reached at least 80% of ADR(H4).
Daily block
• Mirrors the H4 block, but for Daily.
Daily Probability (lookback M days)
• Rows like “≥ 100% ADR” show the fraction of the last M daily bars whose daily range reached at least 100% of ADR(D).
⸻
Practical usage
• Use % of ADR (curr H4 / Daily) to judge exhaustion or room left in the day/session.
E.g., if Daily %ADR is already 95%, be cautious with momentum continuation trades.
• The probability tables give a quick historical context:
If “≥ 125% ADR” is ~18%, the market rarely stretches that far; your trade sizing/targets can reflect that.
• ADR/ATR % of Price helps normalize volatility between instruments.
⸻
Troubleshooting
• If probability rows are blank: ensure lookback windows are large enough (and that the chart has enough history).
• If ADR/ATR show … (NA): usually you don’t have enough bars for the chosen length/TF yet.
• If line segments are missing: verify you’re on a chart with visible current H4/D bars and the toggles are enabled.
⸻
Notes & customization ideas
• Add a toggle to count only session bars in H4 probability.
• Add separate thresholds for H4 vs Daily.
• Let users pick minutes for session start/end if needed.
• Add alerts when %ADR crosses specified thresholds.
If you want me to bundle any of the “ideas” above into the code, say the word and I’ll ship a clean patch.

ADR/ATR Session by LK## **Features**
1. **Custom ADR & ATR Calculation**
* Calculates **Average Daily Range (ADR)** and **Average True Range (ATR)** separately for:
* **Session timeframe** (default H4 / 06:00–13:00)
* **Daily timeframe**
* Independent smoothing method selection (**SMA, EMA, RMA, WMA**) for H4 ADR, H4 ATR, Daily ADR, and Daily ATR.
2. **Percentage Metrics**
* % of ADR / ATR covered by the **current H4 bar**.
* ADR / ATR expressed as a percentage of the **current price**.
* % of ADR already reached for the **current day**.
* % of Daily ATR vs current day’s True Range.
3. **Dynamic Chart Lines**
* Draws **3 lines for H4**: Session Open, ADR High, ADR Low.
* Draws **3 lines for Daily**: Daily Open, ADR High, ADR Low.
* Lines **extend to the right** so they stay visible across the chart.
* Colors and widths are fully customizable.
4. **Real-Time Data Table**
* Compact table displaying all ADR/ATR values and percentages.
* Adjustable table font size (**tiny, small, normal, large, huge**).
* Transparent background option for minimal chart obstruction.
5. **Flexible Session Settings**
* Select session start and end time in hours/minutes.
* Choose session timezone (chart timezone or major financial centers).
* Toggle H4 lines, Daily lines separately.
6. **Lookahead Control**
* Option to wait for higher-timeframe candle close before updating values (more accurate, less repainting).
---
## **How to Use**
### **1. Adding the Indicator**
* Copy and paste the Pine Script into TradingView’s Pine Editor.
* Click **“Add to chart”**.
* Make sure your chart supports the higher timeframes you choose (e.g., H4 and Daily).
### **2. Setting Your Session**
* **Session Start Hour** & **End Hour** → Defines the intraday session to measure ADR/ATR (default: 06:00–13:00).
* **Session Timezone** → Pick “Chart” or a major financial center (e.g., New York, London, Tokyo).
### **3. Choosing Smoothing Methods**
* For each ADR/ATR (H4 and Daily), choose:
* SMA (Simple)
* EMA (Exponential)
* RMA (Wilder’s smoothing)
* WMA (Weighted)
### **4. Adjusting Chart Display**
* **Show H4 Lines** → Displays session open and ADR High/Low for the current H4 session.
* **Show Daily Lines** → Displays daily open and ADR High/Low.
* Customize line colors and widths.
### **5. Reading the Table**
* **H4 Section**
* ADR / ATR values for the selected session.
* % of ADR/ATR covered by the **current H4 bar**.
* ADR/ATR as % of the current price.
* **Daily Section**
* ADR / ATR for the daily timeframe.
* % of ADR already covered by today’s range.
* ADR/ATR as % of price.
### **6. Pro Tips**
* Use **H4 ADR %** to gauge intraday exhaustion — if current range is near 100%, market may slow or reverse.
* Use **Daily ADR %** for swing trade context — if a day has moved beyond its ADR, expect lower continuation probability.
* Combine with support/resistance to identify high-probability reversal zones.

[Smith] VWAP Deviation + VWAP Deviation +
Short Description:
Advanced VWAP indicator with deviation bands, smart signal filtering, and session-based performance tracking. Features log-space scaling, RSI confirmation, volume filters, and market regime detection.
Full Description:
The VWAP Deviation + is a comprehensive trading indicator that combines Volume Weighted Average Price (VWAP) analysis with advanced signal filtering to identify high-probability trade opportunities. This indicator goes beyond basic VWAP by incorporating multiple confirmation layers and intelligent market analysis.
🎯 Key Features
Core VWAP Analysis:
- Custom volume-weighted mean calculation with deviation bands (2σ and 3σ)
- Optional log-space scaling for proportional price movements
- Real-time VWAP line with customizable visibility
Smart Signal Detection:
- RSI confirmation for all trade signals
- Volume filter requiring above-average trading activity
- Market regime detection (trending vs ranging markets)
- Optional RSI divergence analysis
Advanced Filtering:
- Multi-condition signal validation
- Session-based performance tracking (Asian, London, NY)
- Real-time win rate calculation
- Strong vs regular signal classification
Visual Features:
- Clean, professional interface with customizable colors
- Optional signal shapes and annotations
- Performance statistics table
- Filled deviation bands for easy visualization
📊 How It Works
The indicator identifies trade opportunities when:
1. Price touches VWAP deviation bands (2σ or 3σ)
2. RSI confirms oversold/overbought conditions
3. Volume exceeds the specified threshold
4. Market regime conditions are favorable
Signal Types:
- LONG : Price at lower bands + RSI oversold + volume confirmation
- SHORT : Price at upper bands + RSI overbought + volume confirmation
- STRONG : Same conditions but at 3σ bands for higher conviction trades
⚙️ Customization Options
Core Settings:
- VWAP length and source selection
- Adjustable deviation multipliers
- Log-space scaling toggle
Signal Filters:
- RSI length and threshold levels
- Volume filter with customizable multiplier
- Market type filtering options
Advanced Features:
- Session statistics tracking
- RSI divergence detection
- Market regime analysis
Visual Controls:
- Show/hide individual components
- Custom color schemes
- Signal display toggles
🔔 Alert System
Built-in alerts for:
- Long and short trade opportunities
- Strong signal confirmations
- RSI divergence signals
💡 Best Practices
- Use higher timeframes (15m+) for more reliable signals
- Combine with additional confirmation indicators
- Pay attention to session statistics for timing optimization
- Monitor market regime indicators for context
This indicator is suitable for day traders, swing traders, and anyone looking to improve their VWAP-based trading strategies with advanced filtering and market analysis.

Market Session Boxes with Volume Delta [algo_aakash]This script highlights four key forex trading sessions — Tokyo, London, New York, and Sydney — by drawing color-coded boxes directly on the chart. For each session, it shows:
High and low of the session
Total volume traded
Volume delta (bullish vs bearish pressure)
Optional extension of session highs/lows into future candles
Cleanly labeled time range and stats
Users can:
Select which sessions to display
Customize session times (in UTC+0)
Choose colors per session
Toggle session labels and extension lines
Use Case: Designed to help intraday and short-term traders visualize market rhythm, liquidity zones, and session-based volatility. The volume delta metric adds an extra layer of sentiment analysis.
This tool works best on intraday timeframes like 15m, 30m, or 1H.
Disclaimer:
This indicator is for educational and visual analysis purposes. It does not constitute trading advice or guarantee results. Always conduct your own analysis before making trading decisions.

ALN Sessions - for NQ2/24/25 - v1
This script does not calculate any stats.
It uses the sessions and stats from NQStats/ALNSessions
Option to draw boxes around the session times.
Options to adjust the table text/background colors/position.
The logic will determine how the Asia and London sessions interact.
Once the New York session starts (8am), it will then display the appropriate stats.
Script quirk...fyi. The script removes the stats table at 6PM.
That's just how it works. I used grok to assist with the code, and it got funky. It works, so I left it that way.
The appropriate stats table will then be displayed when the next New York session begins.
---
There is another table I used just for troubleshooting to show the values of the Asia/London session highs/lows. This can just be ignored.
3/3/25 - republished.

Opening Range with Breakouts & Targets [LuxAlgo]Opening Range with Breakouts & Targets is based on the long-standing Opening Range Breakout strategy popularized by traders such as Toby Crabel and Mark Fisher.
This indicator measures and displays the price range created from the first period within a new trading session, along with price breakouts from that range and targets associated with the range width.
🔶 USAGE
The Opening Range (OR) can be a powerful tool for making a clear distinction between ranging and trending trading days. Using a rigid structure for drawing a range, provides a consistent basis to make judgments and comparisons that will better assist the user in determining a hypothesis for the day's price action.
NOTE: During a suspected "Range Day", the Opening Range can be used for reversion strategies, typically targeting the opposite extreme of the range or the mean of the range. However, more commonly the Opening Range is used for breakouts on suspected "Trend Days", targeting further upward or downward market movement.
The common Opening Range Breakout Strategy (ORB) outlines a structure to enter and exit positions based on rigid points determined by the Opening Range. This methodology can be adjusted based on markets or trading styles.
Determine Opening Range High & Low: These are the high and low price within a chosen period of time after the market opens. This can be customized to the user's trading style and preference. Common Ranges are from 5-60 mins.
Watch for a Breakout with Volume: A Breakout occurs when price crosses the OR High (ORH) or OR Low (ORL), an increase in volume is typically desired when witnessing these breakouts to confirm a stronger movement.
Manage Risk: Based on user preference and the appropriately determined amount of risk, multiple ways can be determined to manage risk by using Opening Range.
For Example: A stop-loss could be set at OR Mean (ORM) or the opposite side of the range, while a profit target could optionally be set at the first price target generated by the script.
Alternatively, a user might want to use a Moving Average (MA) as an adaptive stop-loss and use price targets to scale out. These are just 2 examples of the possible options, both capable with this tool.
🔹 Signals
Signals will fire based on the break of the opening range, this is indicated by arrows above and below the range boundaries.
Optionally, a bias can be added to these signals to aid in mitigating false signals by using a directional filter based on the current day's OR relative to the previous day's OR.
Regardless of the signal bias being enabled, the Opening Range Zone will always be colored directionally according to this.
If the current day's OR is above the previous day's OR, the Zone will be Green.
If the current day's OR is below the previous day's OR, the Zone will be Red.
By enabling the signal bias, signals in the opposite direction of the daily bias will fire on the cross of the first target in that direction.
🔹 Targets
In this indicator, targets are not limited and will generate infinitely based on a % width of the Opening Range.
Additionally, there are 2 display methods for these targets.
Extended: Extends the targets to the current bar and displays all targets that have been crossed so far within the session.
Adaptive: Extends only the 2 closest targets surrounding price, allowing for a display consisting of fewer lines at one time.
🔶 DETAILS
🔹 Historical Display
This indicator can be utilized in multiple ways, for use in real-time, and for historical analysis to form methods. Because of this, the indicator has an option to display only the current day's data or the entire historical data. This can also help clean up the chart when it is in use.
🔹 Time Period
The specific time period to create the opening range is entirely up to each user's preference, by default it is set to 30 mins; however, this time period can be edited with full control if desired.
Simply toggle on the "Custom Range" and input a range of time to create the range.
🔹 Session Moving Average
The Session Moving Average is a common Moving Average, which resets at the beginning of a new session. This allows for an unbiased MA that was created entirely from the current session's price action.
Note: The start of the session is determined by the start of the Opening Range if using a custom range of time.
🔶 SETTINGS
Show Historical Data: Choose to display only the current session's data or the full history of data.
Opening Range Time Period: Select the time period to form the opening range from. This operates on Session Start, so it will change with the chart.
Custom Range: Opt for a custom Range by enabling this and inputting your range times as well as your needed timezone.
Breakout Signal Bias: Select if the Breakout Signals will use a Daily Directional Bias for firing.
Target % of Range: Sets the % of the Range width that will be used as an increment for the Targets to display in.
Target Cross Source: Choose to use the Close price or High/Low price as the crossing level for Target displays. When this source crosses a target it will generate more targets.
Target Display: Choose which style of display to use for targets.
Session Moving Average: Optionally enable a Moving average of your choice that resets at the beginning of each session (start of opening range).

Stock Data Table█ OVERVIEW
This is a table that shows some information about stocks. It is divided into four sections:
1) Correlation
2) Shares
3) Daily Data
4) Extended Session Data
The table is completely modular, which means you can add or remove each element from the settings menu, and it will automatically rearrange its spaces.
It is also highly customizable, to the extent that you can change almost any color, remove or change titles, invert section rows, and much more.
1) Correlation
The script checks if the stock is listed on NASDAQ, and if so, uses the QQQ (Nasdaq-100 ETF) as the reference index in the first cell; otherwise, it uses the SPY (S&P 500 ETF). The length of the correlation is shown in the second cell. The table then displays the correlation between the reference index and the other index, and the correlation between the reference index and the stock.
To make it easier to interpret the correlation values, each row's last cell is color-coded with a gradient to highlight the type of correlation, and the direction of the gradient can be customized.
The correlation coefficient is a statistical measure that quantifies the strength and direction of the relationship between two variables, indicating how changes in one variable are associated with changes in the other variable, so it can be used to identify patterns and trends.
If you are interested in correlation, I suggest taking a look at my dedicated indicator:
2) Shares
This feature provides you with quick access to key information about shares and market capitalization.
On one row, you can view the total shares outstanding and the market capitalization for the fiscal year or the quarterly year. The total shares outstanding represents the total number of shares of the stock that have been issued and are currently outstanding, regardless of whether they are held by insiders or public investors. The market capitalization is a widely used measure of the company's value as determined by the stock market, calculated by multiplying its current stock price with the total number of outstanding shares.
The other row shows the float, which is the number of shares of a company that are available for public trading, and the corresponding free-float market cap, calculated by multiplying the company's current stock price with the float. Because Pine Script does not allow retrieving information about quarterly year float, you can view the float and the free-float market cap of the fiscal year only. The data can be displayed at all times or only when the difference between the total shares outstanding and the float is significant enough to result in a difference between the market cap and free-float market cap.
The classification for market cap and free-float market cap is set in this way:
Mega Cap: $200 billion or more
Large Cap: between $10 billion and $200 billion
Mid Cap: between $2 billion and $10 billion
Small Cap: between $300 million and $2 billion
Micro Cap: less than $300 million
Penny Stocks: less than $5 (customizable)
Comparing the free-float market cap to the market cap can provide insights into the liquidity of a stock. In fact, if the float is relatively small compared to the total shares outstanding, it may be more difficult to find buyers or sellers, which could lead to increased volatility. On the other hand, a larger float indicates that the stock is more liquid and may be easier to trade, potentially resulting in lower volatility. However, market conditions can change quickly and significantly, especially for intraday traders, and the free-float can also change as insiders or other large shareholders buy or sell shares. Therefore, comparing the data of the fiscal year with that of the quarterly year may not provide the most up-to-date and accurate information for making trading decisions. This limitation can be mitigated by combining those data with other indicators and tools, such as technical analysis or news events, to gain a better understand of the stock's performance and potential trading opportunities.
3) Daily Data
This section is available on daily charts only due to the lack of accuracy of real-time daily data on other time frames. Here, you can view the Average Daily Volume (ADV) over a preferred time range (20 days by default), and the Daily Change, which represents the percentage difference between the closing price on two consecutive trading days.
ADV is useful in measuring the stock's volatility, as it provides an indication of how much trading activity there is in it. Generally speaking, stocks with higher trading volume tend to be less volatile than stocks with lower trading volume. High trading volume means there are more buyers and sellers actively trading the stock, which makes it easier for investors to buy and sell shares at fair prices. This increased liquidity can help to stabilize the stock price, reducing the potential for large swings in either direction. On the other hand, stocks with lower trading volume may experience greater volatility, as there are fewer buyers and sellers actively trading the stock. This can result in larger price swings, as it may be more difficult for investors to buy or sell shares at fair prices.
The daily percentage change can provide an indication of the stock's volatility, with larger values indicating greater volatility and risk. It can also be compared to that of a benchmark such an index or other stocks in the same sector, helping to determine whether the stock is outperforming or underperforming relative to them.
4) Extended Session Data
The fourth section is available on intraday charts only. This section provides two pieces of information: the Extended Session Change and the Pre-Market Volume.
The Extended Session Change indicates the percentage difference between the previous day's closing price and the latest price in the extended session. This gives you the extent and the direction of the price gap that occurred during extended trading hours.
The Pre-Market Volume shows the sum of all shares traded during the pre-market session. This can be helpful in understanding how much interest the stock gained before the market opened.
By default, the two rows will be visible at all times. They will stop updating after the end of their respective time range, and resume updating when it starts again. However, you can choose to automatically hide them outside of their time ranges.
Both the extended session and pre-market time ranges can be customized. Please note that if you select time ranges outside of the regular market session (as set by default), you must enable the extended session to view the corresponding rows.
█ GENERAL NOTES
• Total Shares Outstanding, Float, Average Daily Volume and Pre-Market Volume cells use a customizable color system based on two thresholds, to help you quickly identify whether the value is "too low/acceptable/too high" or "too low/not enough high/acceptable".
• If you cannot see certain data, that simply means it is not available.

Advanced Forex SessionsEssential for ALL Forex Day Traders!
Don't waste your time trading Forex Sessions with little to no volume or volatility!
The Advanced Forex Sessions tool will search through all 4 sessions, tally up the total volume and ticks moved, and show you which session has the most movement.
It will show you the two best sessions on chart and optionally color the background too.
Configure the position & size of the Infographic table as well as custom Forex Session times and colors.

Time & Session Dividers### indicator Summary
This indicator is a powerful utility designed to help you visualize time-based market structure by drawing customizable vertical lines on your chart. It allows you to clearly mark the beginning of new timeframes (like hours, days, or weeks) and highlight specific trading sessions or time slots (like the London open or a news event).
It comes with **6 independent dividers** that you can configure to your exact needs:
* **3 Timeframe Dividers**
* **3 Custom Time Slot Dividers**
### Key Features
* **Timeframe Separators:** Set up to 3 different higher timeframes (e.g., 1H, 4H, 1D). The indicator will automatically draw a vertical line at the start of each new bar for that timeframe, helping you easily see hourly, daily, or weekly boundaries.
* **Custom Time Slots (Sessions):** Define up to 3 specific time windows (e.g., "09:30-16:00" for the New York session). The indicator will draw a line at the **start** of this session and another line at the **end**, allowing you to isolate specific periods of market activity.
* **Full Customization:** Each of the 6 dividers is fully independent and can be customized with:
* A simple toggle to turn it on or off.
* A unique color.
* A line style (Solid, Dotted, or Dashed).
* A toggle to show or hide its text label.
* **Smart Labels:** Labels for timeframe dividers display the timeframe (e.g., "4H"), while labels for time slots automatically format to show the precise start or end time (e.g., "09:30" and "16:00").
### How to Use
1. Add the "Timeframe Vertical Lines" indicator to your chart.
2. Open the indicator's **Settings** panel.
3. **To add a timeframe line (e.g., Daily):**
* Go to the "Timeframe Divider 1" group.
* Check the "Show Divider 1" box.
* Set the "Timeframe 1" to "1D".
* Adjust the color, style, and text visibility to your liking.
4. **To add a session line (e.g., London Session):**
* Go to the "Time Slot Divider 1" group.
* Check the "Show Time Slot Divider 1" box.
* Set the "Time Slot 1" to your desired session, e.g., "0800-1700".
* Adjust the color and style. The script will now draw lines at 08:00 and 17:00 (based on the chart's timezone).
5. Repeat the process using the other available divider slots to build a complete temporal map of your chart.

ICT Venom Trading Model [TradingFinder] SMC NY Session 2025SetupIntroduction
The ICT Venom Model is one of the most advanced strategies in the ICT framework, designed for intraday trading on major US indices such as US100, US30, and US500. This model is rooted in liquidity theory, time and price dynamics, and institutional order flow.
The Venom Model focuses on detecting Liquidity Sweeps, identifying Fair Value Gaps (FVG), and analyzing Market Structure Shifts (MSS). By combining these ICT core concepts, traders can filter false breakouts, capture sharp reversals, and align their entries with the real institutional liquidity flow during the New York Session.
Key Highlights of ICT Venom Model :
Intraday focus : Optimized for US indices (US100, US30, US500).
Time element : Critical window is 08:00–09:30 AM (Venom Box).
Liquidity sweep logic : Price grabs liquidity at 09:30 AM open.
Confirmation tools : MSS, CISD, FVG, and Order Blocks.
Dual setups : Works in both Bullish Venom and Bearish Venom conditions.
At its core, the ICT Venom Strategy is a framework that explains how institutional players manipulate liquidity pools by engineering false breakouts around the initial range of the market. Between 08:00 and 09:30 AM New York time, a range called the “Venom Box” is formed.
This range acts as a trap for retail traders, and once the 09:30 AM market open occurs, price usually sweeps either the high or the low of this box to collect stop-loss liquidity. After this liquidity grab, the market often reverses sharply, giving birth to a classic Bullish Venom Setup or Bearish Venom Setup
The Venom Model (ICT Venom Trading Strategy) is not just a pattern recognition tool but a precise institutional trading model based on time, liquidity, and market structure. By understanding the Initial Balance Range, watching for Liquidity Sweeps, and entering trades from FVG zones or Order Blocks, traders can anticipate market reversals with high accuracy. This strategy is widely respected among ICT followers because it offers both risk management discipline and clear entry/exit conditions. In short, the Venom Model transforms liquidity manipulation into actionable trading opportunities.
Bullish Setup :
Bearish Setup :
🔵 How to Use
The ICT Venom Model is applied by observing price behavior during the early hours of the New York session. The first step is to define the Initial Range, also called the Venom Box, which is formed between 08:00 and 09:30 AM EST. This range marks the high and low points where institutional traders often create traps for retail participants. Once the official market opens at 09:30 AM, price usually sweeps either the top or bottom of this box to collect liquidity.
After this liquidity grab, the market tends to reverse in alignment with the true directional bias. To confirm the setup, traders look for signals such as a Market Structure Shift (MSS), Change in State of Delivery (CISD), or the appearance of a Fair Value Gap (FVG). These elements validate the reversal and provide precise levels for trade execution.
🟣 Bullish Setup
In a Bullish Venom Setup, the market first sweeps the low of the Venom Box after 09:30 AM, triggering sell-side liquidity collection. This downward move is often sharp and deceptive, designed to stop out retail long positions and attract new sellers. Once liquidity is taken, the market typically shifts direction, forming an MSS or CISD that signals a reversal to the upside.
Traders then wait for price to retrace into a Fair Value Gap or a demand-side Order Block created during the reversal leg. This retracement offers the ideal entry point for long positions. Stop-loss placement should be just below the liquidity sweep low, while profit targets are set at the Venom Box high and, if momentum continues, at higher session or daily highs.
🟣 Bearish Setup
In a Bearish Venom Setup, the process is similar but reversed. After the Initial Range is defined, if price breaks above the Venom Box high following the 09:30 AM open, it signals a false breakout designed to collect buy-side liquidity. This move usually traps eager buyers and clears out stop-losses above the high.
After the liquidity sweep, confirmation comes through an MSS or CISD pointing to a reversal downward. At this stage, traders anticipate a retracement into a Fair Value Gap or a supply-side Order Block formed during the reversal. Short entries are taken within this zone, with stop-loss positioned just above the liquidity sweep high. The logical profit targets include the Venom Box low and, in stronger bearish momentum, deeper session or daily lows.
🔵 Settings
Refine Order Block : Enables finer adjustments to Order Block levels for more accurate price responses.
Mitigation Level OB : Allows users to set specific reaction points within an Order Block, including: Proximal: Closest level to the current price. 50% OB: Midpoint of the Order Block. Distal: Farthest level from the current price.
FVG Filter : The Judas Swing indicator includes a filter for Fair Value Gap (FVG), allowing different filtering based on FVG width: FVG Filter Type: Can be set to "Very Aggressive," "Aggressive," "Defensive," or "Very Defensive." Higher defensiveness narrows the FVG width, focusing on narrower gaps.
Mitigation Level FVG : Like the Order Block, you can set price reaction levels for FVG with options such as Proximal, 50% OB, and Distal.
CISD : The Bar Back Check option enables traders to specify the number of past candles checked for identifying the CISD Level, enhancing CISD Level accuracy on the chart.
🔵 Conclusion
The ICT Venom Model is more than just a reversal setup; it is a complete intraday trading framework that blends liquidity theory, time precision, and market structure analysis. By focusing on the Initial Range between 08:00 and 09:30 AM New York time and observing how price reacts at the 09:30 AM open, traders can identify liquidity sweeps that reveal institutional intentions.
Whether in a Bullish Venom Setup or a Bearish Venom Setup, the model allows for precise entries through Fair Value Gaps (FVGs) and Order Blocks, while maintaining clear risk management with well-defined stop-loss and target levels.
Ultimately, the ICT Venom Model provides traders with a structured way to filter false moves and align their trades with institutional order flow. Its strength lies in transforming liquidity manipulation into actionable opportunities, giving intraday traders an edge in timing, accuracy, and consistency. For those who master its logic, the Venom Model becomes not only a strategy for entry and exit, but also a deeper framework for understanding how liquidity truly drives price in the New York session.

Time-based LiquidityThis indicator automatically marks important time-based liquidity levels on your chart, helping you stay aware of where major price reactions may occur and the market is forced to show its hand.
Key Features:
Previous Month’s, Week’s, and Day’s Highs and Lows: Displays PMH/PML, PWH/PWL, and PDH/PDL — key reference points where liquidity often accumulates.
Intraday Session Highs and Lows: Divides the trading day into quarters (00:00–06:00, 06:00–12:00, etc. following Day’s Quarterly Theory) and tracks session highs and lows dynamically across these periods.
Current Session 90-Minute Quarters: Splits the active session into 90-minute intervals to highlight short-term liquidity structures and potential reaction zones.
Level Alerts: Tracks when each liquidity level is reached and enables customizable alerts so you don’t miss important price movements.
Use Case:
This tool provides an organized, time-based framework for identifying where liquidity is likely to concentrate across different timeframes and intraday cycles. Use these levels for forming bias, planning entries, exits, or anticipating price reactions at key points in the market structure.
Customization Options:
Enable/disable liquidity levels to display (Daily, Weekly, Monthly, Sessions, Session Quarters)
Customize the appearance of each level (color, style, line width)
Enable or disable tracking and alerts for level interactions

Major Session Highs/LowsThis indicator creates horizontal lines at major session high/lows (US, London, and Asian). The script updates the lines automatically, on session close.
For instance, when viewing during the US session, after the London overlap, horizontal lines will be displayed at the following levels.
The high/low of the most recent London session.
The high/low of the most recent Asian session.
The high/low of the last full US session, i.e. the session of the day prior.
When the current US session closes, the US levels automatically update.
