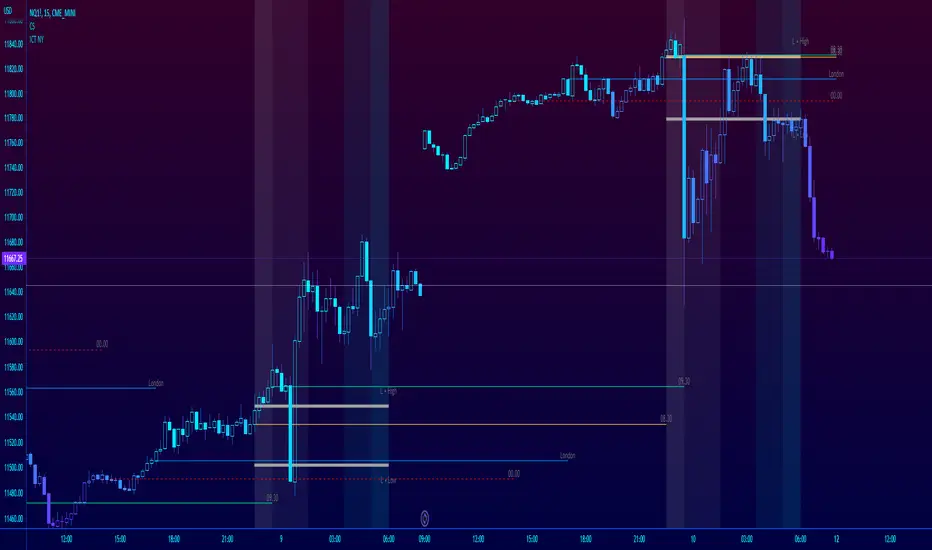
ICT NY Futures Indices Session Model - YT New York MentorshipThis indicator plots out the time periods and open lines as outlined in ICT's 2022 Mentorship and is designed specifically for the New York futures trading session.
Time zone is set to GMT-4 (NY) by default but can be changed for accommodate daylight saving in the menu.
Please note this indicator is to be used only on the 30min timeframe and below.
Here are its features:
The background color shows the morning session, in two parts (8.30am to 9.30am and 9.30am to 11.30am), then a two hour gap for lunch (ICT calls this "Dead time") and finally, the afternoon session, also to two (1.30pm to 3pm and 3pm to 4pm).
It not only shows the current killzones, but future zones as well.
These times are important; trades can be framed within these zones as taught in the mentorship.
Next are the open lines. These lines are automatically plotted and can be areas for price to react off of; they are the opening price of a candle at these times:
00.00 (New York Midnight, also known as "True Day Open")
8.30am (New York Equities pre-open)
9.30am (New York Equities open)
2.00am (London Stock Exchange open)
And lastly, London's trading session High and Low are projected forward onto the New York trading session.
These two price points are areas of liquidity that were pooled during London, but they can also often set the high or low of the day.
Please let me know if there are any bugs or if you have suggestions for the next update.
在腳本中搜尋"session"
Crypto / Fx SessionsTrading sessions for crypto markets - the major time segments: London, NYC, Beijing. Times are set in UTC.
Quick experiment for now, may be edited.
More granular data around session breaks for these time zones at www.altcointrading.net or as CSVs daily updated on Keybase keybase.pub

Session Breakout, Retest, Reversal + Large Move Alert## **Session Breakout, Retest, Reversal + Large Move Alert**
### Overview
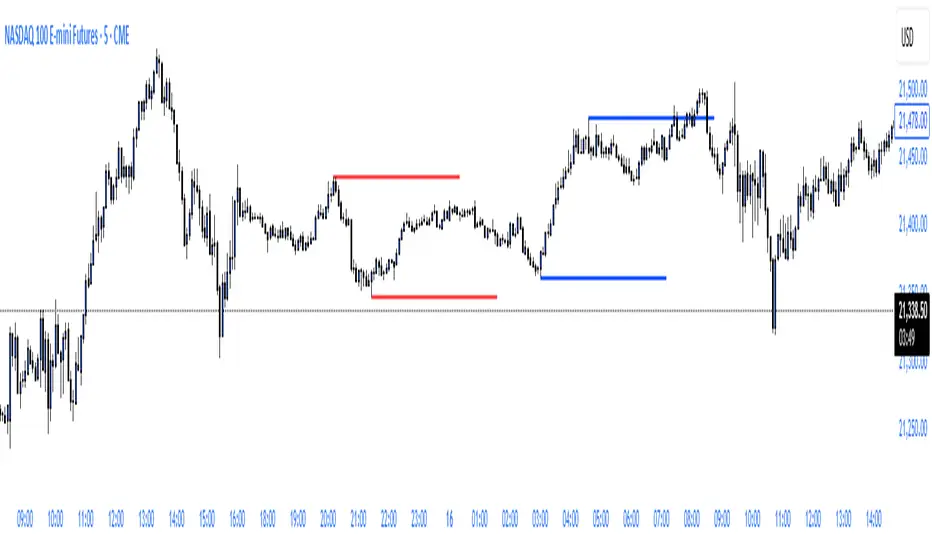
A powerful multi-functional indicator designed for day traders and futures traders to identify session-based breakout opportunities, retest confirmations, and significant price movements across all futures contracts (Gold, E-mini S&P 500, Nasdaq, Crude Oil, and more).
### Key Features
**📊 Pre-Market Session Tracking**
- Automatically calculates pre-market/overnight session highs and lows
- Displays session ranges with customizable colors and styling
- Extends lines through the entire trading session for easy reference
- Supports overnight sessions (e.g., 4 PM – 7:30 AM for Gold futures)
**🚀 Breakout Detection**
- Identifies breakouts above/below pre-market highs and lows
- Uses close-price confirmation to filter false signals from wicks
- Displays "BO ↑" and "BO ↓" labels at breakout points
- Generates instant alerts when breakouts occur
**♻️ Retest Failed Tracking**
- Monitors price retests after breakouts
- Detects when retests fail to reach previous support/resistance
- Labels "RF" (Retest Failed) for high-probability trade setups
- Helps identify reversal opportunities
**📈 First 5-Minute Analysis**
- Captures first 5 minutes of market open (customizable timeframe)
- Tracks first 5-minute highs and lows separately
- Essential for mean-reversion and breakout confirmation strategies
- Blue lines extend through the trading session for easy tracking
**⚡ Large Move Alerts**
- Detects significant price movements based on point thresholds
- Individual thresholds for 5+ different symbols:
- GC (Gold): 15 points
- ES (E-mini S&P 500): 15 points
- NQ (E-mini Nasdaq): 50 points
- CL (Crude Oil): 1.5 points
- Custom: Fully adjustable
- Auto-detects symbol from chart ticker
- Labels show exact point movement and candle direction
### Customization Options
**Symbol Configuration**
- **Auto-Mode**: Automatically detects trading symbol from chart ticker
- **Manual-Mode**: Select specific symbol (GC, ES, NQ, CL, or Custom)
**Session Settings**
- Fully customizable pre-market session time (24-hour format)
- Adjustable market open time for first 5-minute window
- Market close hour and minute configuration
- Support for any timezone
**Point Move Thresholds by Symbol**
- Set independent thresholds for each of your trading symbols
- Quickly adjust settings when switching between different futures
- Includes helpful tooltips for recommended values
**Display & Styling**
- Toggle all visual elements on/off individually
- Customizable colors for all lines and labels:
- Pre-market high/low colors
- Breakout labels (up/down)
- Retest failed labels
- First 5-minute session lines
- Large move indicators
- Text size options: tiny, small, normal, large, huge
### How It Works
1. **Session Tracking**: The indicator identifies your pre-market session and marks the high and low with labeled lines (PH/PL)
2. **Breakout Signal**: Once the market opens, it monitors for close prices above/below the pre-market levels and alerts you with "BO ↑" or "BO ↓"
3. **Retest Confirmation**: After a breakout, it tracks retests and labels "RF" when the retest fails to reach the opposite extreme, confirming trade direction
4. **Large Move Detection**: Simultaneously monitors for significant point moves that exceed your symbol-specific thresholds
5. **Alert Triggers**: Get real-time alerts for:
- Breakout Up/Down
- Any Breakout
- Large Move events
### Alert Conditions
The indicator includes four alert conditions:
- **Breakout Up Alert**: Price closes above pre-market high
- **Breakout Down Alert**: Price closes below pre-market low
- **Any Breakout Alert**: Either breakout condition triggers
- **Large Move Alert**: Point movement exceeds threshold for current symbol
### Ideal For
- ✅ Day traders (breakout/retest strategies)
- ✅ Futures traders (Gold, Oil, Stock Index Contracts)
- ✅ Intraday scalpers (first 5-minute analysis)
- ✅ Swing traders (session-based levels)
- ✅ Multi-symbol traders (independent thresholds per symbol)
### Disclaimer
This indicator is designed for educational and informational purposes. Past performance does not guarantee future results. Always use proper risk management and position sizing. Test thoroughly on historical data before trading live.

FX Sessions (DTS)FX Sessions (DST-Safe)
This indicator highlights the four main Forex trading sessions — Sydney, Tokyo, London, and New York — using the local timezone of each market.
• DST handled automatically: Sessions shift correctly when London or New York move clocks forward/back.
• Clear visualization: Light background shading for each session, with the London–New York overlap emphasized for peak liquidity.
• Customizable: Toggle individual sessions, labels, and the on-chart legend table.
• Intraday focus: Works best on lower timeframes (1m–1h) for identifying active trading hours and volatility windows.
Use this tool to instantly spot when liquidity and volatility are likely to increase, so you know where to focus your trading.

Horizontal Sessions - B A N K $This is a simple indicator that has been designed to aid intraday trading and has only 1 function;
Information ℹ️
This indicator prints Horizontal Lines in a separate chart pane above/below for the 3 main session killzones in the markets; Asia, London & New York + Optimal Exit Time.
The indicator is only visible up to and including the 1h timeframe.
Settings ⚙️
The default timings are set to perfectly align with each session killzone however the Start & End times for each session can be changed in the settings.
You can change the colour & line thickness of the horizontal lines in the settings.

NRD Sessions Basic FunctionsThis script is an extension and modification of a popular BackGround color script.
Added
1. Style and programming standards to make is easier to read and modify
2. broke out Asia to Sydney and Tokyo Sessions
3. added override to show ICT Kill zones for London and New York
4. Made all this configurable via settings Menu
Enjoy
watch this space as I intend to do more complex session scripts to allow for High and Lows and Mondays too :-)

B A N K $ - Advanced Session RangesThis is a simple indicator that has been designed to aid intraday trading and has a few components;
Key Features
Session Ranges + Optimal Exit Time
Asia Pip Range
New York Midnight Open Line
Session Ranges + Optimal Exit Time
Information ℹ️
This is a visual depiction of the 3 main sessions in the markets. Asia, London & New York. The default timings are set to perfectly align with each session however the Start & End times for each session can be changed in the settings. (I've added a website on the tooltip to easily convert timezones)
I have also added a 4th session range called "Optimal Exit Time". This is statistically the most probable time window for the opposite High / Low of Day to form is within this window. It helps the trader understand when they should look to take profit.
How It Works 🔑
The indicator automatically maps on two lines for the High & Low of the range between the selected Start & End time, it also colours the background.
The individual lines & background can be toggled & customised to the traders preference.
Asia Pip Range
Information ℹ️
This displays the Asia Range in pips beneath the Asia Session Low.
How It Works 🔑
This calculates the distance between the Asia High - Asia Low in pips. It will automatically recalibrate to the timings the trader sets in the settings if they change the Start / End.
New York Midnight Open Line
Information ℹ️
This helps look for Buys beneath the line for a Bullish Expansion day 📈 & Sells above the line for a Bearish Expansion day 📉
How It Works 🔑
This adds a horizontal line to the chart that is anchored to New York Midnight Open (00:00) by default. It can be changed in the settings in required. You can also toggle on the time being shown above the line.

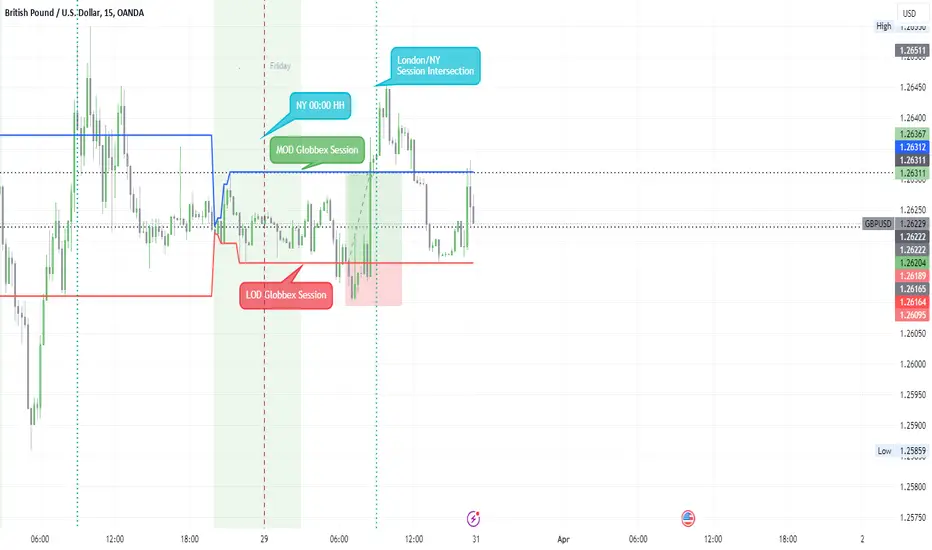
Globbex Session IdTThis indicator allows you to visualize a specific period of time, marking the maximums and minimums they have had.
Additionally, it marks the change of day (NY Time).
The base configuration that the Indicator brings, shows the Globbex session, obtaining the maximum and minimum that it has had.
Marks the London/NY Session Intersection.
Settings
Inputs
Session
Globbex Session Idt
• From HH:MM
• To HH:MM
Globbex Session Check box
o Shows or Hide Session
Display Hour
• Mark - Number of hours after Globbex Session Ends
• We use it to shows the London/NY Session Intersection
Timezone Offset UTC – 4 NY
DIVIDERS
Daily Divider Check box
Style
Background Color checkbox
o Shows or Hide Session
o Can choose the background color
Globbex Low checkbox
o Shows or Hide Low Line
o Can choose the Low Line color
Globbex High checkbox
o Shows or Hide High Line
o Can choose the High Line color
Tradesharpe Session BiasThis script is designed for traders who want help defining their session bias it is for people who trade in sessions which will most likely be 1 4h candle. The way I trade using Price action to get my daily bias, to either look for sells or buys or both I look at the previous daily candle close and previous 4hr candle close before analyzing the structure on the lower time frames to get my session bias of bullish/bearish. so this indicator compares the daily and 4hr candles to develop a bias for example
previous daily bullish + Previous 4hr Bullish = BULLISH BIAS
previous daily Bearish + Previous 4hr Bearish = BEARISH BIAS
if Daily bullish 4hr bearish = MIXED SESSION
if daily bearish 4hr bullish = MIXED SESSION
MIXED SESSION = Can argue both buys and sells
BEARISH SESSION = Best to look for Sells only based on my trading style
BULLISH SESSION = Best to look for Buys only based on my trading style

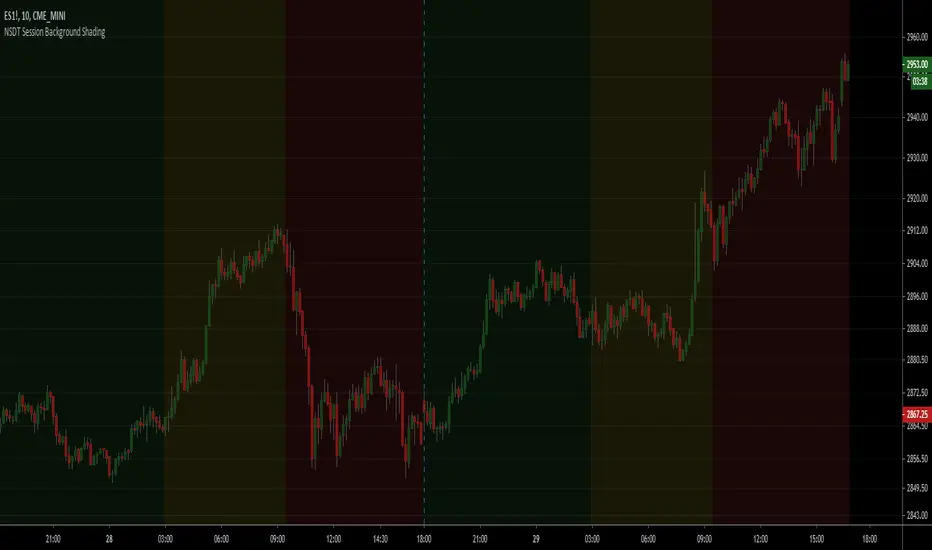
NSDT Session Background ShadingA simple script to add background colors to specific timeframes. Great for trading futures so you can separate sessions for easier viewing. Use for stocks to separate pre, open, and post market times.
There are three timeframes that can be set and all colors can be modified.
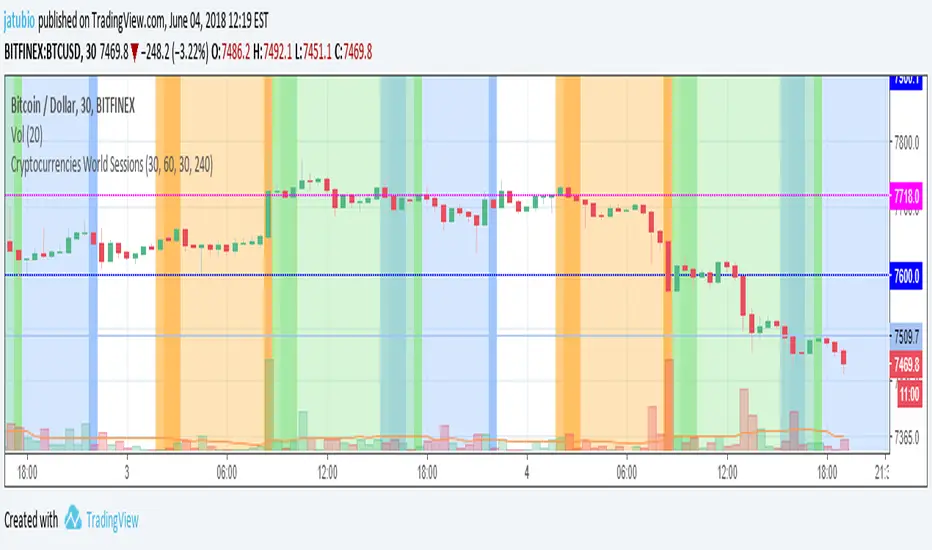
Cryptocurrencies World SessionsEste indicador cambia los colores del fondo para identificar zonas horarias relacionadas con las sesiones de trading en criptomonedas.
Se muestran las sesiones de: America (Nueva York), Europa (Londres) y Korea (Seúl)
Además de mostrar la duración de la sesión, se pueden configurar intervalos para resaltar (en minutos): Antes de la apertura, después de la apertura y antes del cierre.
-----------------------------------------------------------------------------------
This indicators show background colours to identify world timezones about to cryptocurrencies trading sessions
These sessions are shown: USA (New York), Europe (London) and Korea (Seoul).
In addition to show the duration of the session, you can set intervals to be highlighted (in minutes): Before opening, after opening, before closing.
ryantrad3s session highs and lowsThis indicator allows you find London Session and Asia Session highs and lows without marking them yourself. This indicator can also help you find good draws on liquidity for the day and potential highs and lows you can target during that trading day. I recommend trading NQ and ES with this indicator because that's what I seen it work best with. The blue lines are London Session high and low and the red lines are Asia Session high and low. Hope this can save you time marking out your chart before market open.
Fx Session RangeHello traders ,as you know the session timing plays a major role in trade execution.
I was searching for a good session indicator for a very long time but I was not satisfied with the indicators which are already available on Trading view. So I decided to code one my self.
This indicator is based on the timing provided by the website www.forex.timezoneconverter.com and time is set according to Ney York time zone.
I have added almost all major sessions including (Sydney , Tokyo and Frankfurt) and almost all features which I could.
I hope you guys 👍this indicator .
Incase you notice any bug or want any features added, let me know in comment section or you can Dm me as well.
Thank you all , enjoy :D
Forex Session by PThis session indicator is set according to UTC+5:30 (Kolkata, India)
L = London
N = New York
T= Tokyo
FF = Frankfurt
NYSE = New York Stock Exchange
Square in Bottom
With characters are Start of the Session
Without Characters are End of the Session specified with the color.

Trading sessions, Ichimoku and Classic Pivots█ OVERVIEW
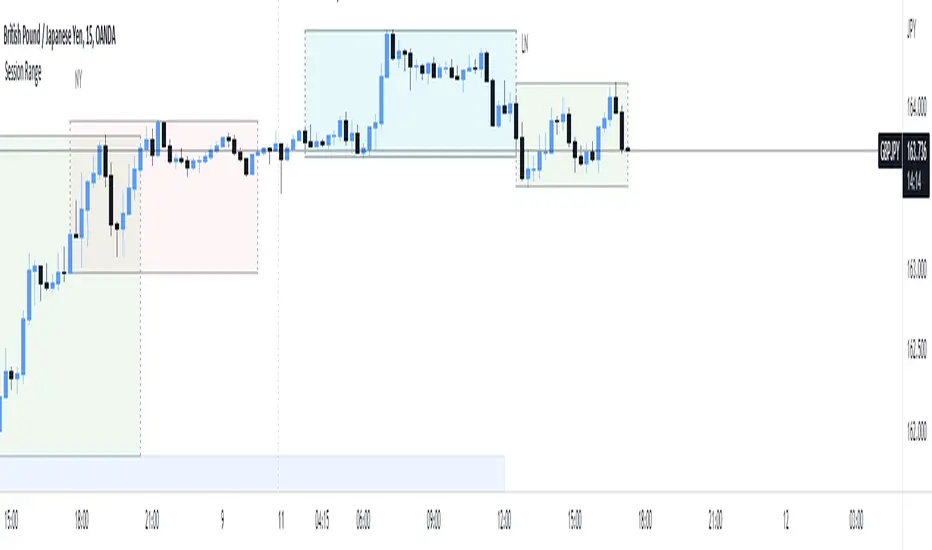
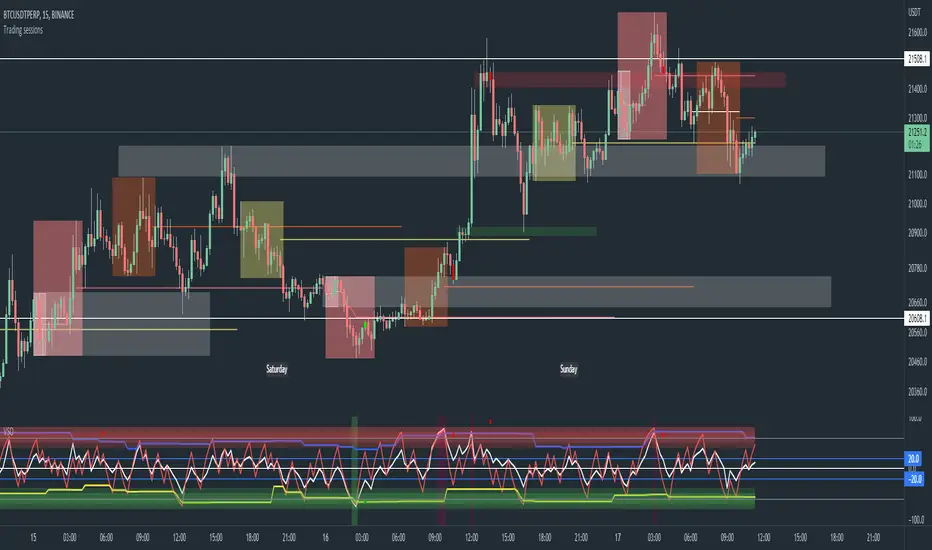
This a self contained intraday trading style for crypto/forex made to be on and traded on 15-min.
This Script Creates a box around each major session to a trading range, include highlights for the first 12 15-min candles, classic Pivot points and ichimoku cloud.
█ CONCEPTS
1 — Session boxes and ranges are based of the times from Steve from Beat the market maker, and you have the option in setting to have an extension for the high/low until the start of the next box calculation.
2 — 12 candle window, this marks the first 3 hours after a open;
The first hour - stop hunt
The second hour - big moves
The third hour - tend continuation or reversal
3 — The Days of the weeks are labelled and coloured;
Weekends are in grey, ideally no trade days.
Monday, Tuesday, Thursday are green, to mark the week days
Wednesday is red to be mindful of mid week reversal
Friday is red to mark the end of week
4 — Ichimoku cloud, by default the only thing visible is the kumo cloud, but in setting you can turn the line back on. Ichimoku proves a great mark for areas to look for support and resistances.
5 — Lastly, you have classic pivots, by default they are extend to the right and on weekly, Each level act as support and resistance. Look for Bullish momentum at R3 for a larger moves to the upside.
Ichimoku and the pivot are here mainly for when you want to do higher time frame analysis.
█ OTHER SECTIONS
• HOW TO USE
Example of a trade
**Key thing to remember is London will set the high in a down trend and the low in an up trend
you can see the first hour look for stops and stopped at 50% of the range set coming into the session, the second hour a big move to the down side hitting 200% expansion then the third hour reversal stopping wick up then
back down from from London low. before continuing down.
• LIMITATIONS: I have not test this on Stock, as I have a different strategies for those market
• NOTES : I know a lot of people have moving averages on their chart, I have another separate one with all MA types, and it something that will not fit into one script, Other things you can add with this Bollinger bands, and
fib tool with 50%, 100%, 150% and 200%
Example - Custom Defined Dual-State SessionThis script example aims to cover the following:
defining custom timeframe / session windows
gather a price range from the custom period ( high/low values )
create a secondary "holding" period through which to display the data collected from the initial session
simple method to shift times to re-align to preferred timezone
Articles and further reading:
www.investopedia.com - trading session
Reason for Study:
Educational purposes only.
Before considering writing this example I had seen multiple similar questions
asking how to go about creating custom timeframes or sessions, so it seemed
this might be a good topic to attempt to create a relatively generic example.

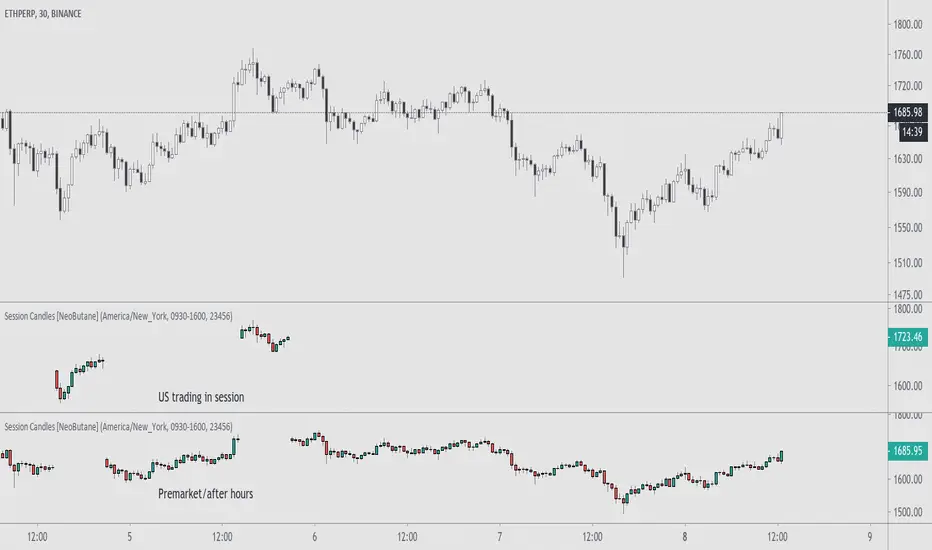
Trading Session Candles [NeoButane]█ OVERVIEW
Display candlesticks for the selected session, regular or extended.
█ CONFIGURATION
Options to change include displaying the regular or extended session, timezone, session hours, and session days.
█ CONCEPTS
Meant for charts with longer trading sessions or to view only extended hours trading action on US stocks that have afterhours available.
█ Notes
For trading days, '23456' refers to Monday to Friday.
Yesterday's RTH&ON sessions OHLCsThe indicator plots the OHLC levels of both trading sessions of the day before: the overnight session and the Regular Trading Hours.

High & Low Of Custom Session - OpeningRange Breakout (Expo)High & Low Of Custom Session - OpeningRange Breakout (Expo) prints the high and the low of a custom session.
I use the indicator to trade the re-test of opening range (high/low) as well as breakouts from the opening range. The same logic can be applied to the session you have chosen.
HOW TO USE
1. Use the indicator to trade the re-tests of the session range.
2. Use the indicator to trade breakouts of session range.
INDICATOR IN ACTION
1-min chart
I hope you find this indicator useful , and please comment or contact me if you like the script or have any questions/suggestions for future improvements. Thanks!
I will continually work on this indicator, so please share your experience and feedback as it will enable me to make even better improvements. Thanks to everyone that has already contacted me regarding my scripts. Your feedback is valuable for future developments!
-----------------
Disclaimer
Copyright by Zeiierman.
The information contained in my scripts/indicators/ideas does not constitute financial advice or a solicitation to buy or sell any securities of any type. I will not accept liability for any loss or damage, including without limitation any loss of profit, which may arise directly or indirectly from the use of or reliance on such information.
All investments involve risk, and the past performance of a security, industry, sector, market, financial product, trading strategy, or individual’s trading does not guarantee future results or returns. Investors are fully responsible for any investment decisions they make. Such decisions should be based solely on an evaluation of their financial circumstances, investment objectives, risk tolerance, and liquidity needs.
My scripts/indicators/ideas are only for educational purposes!

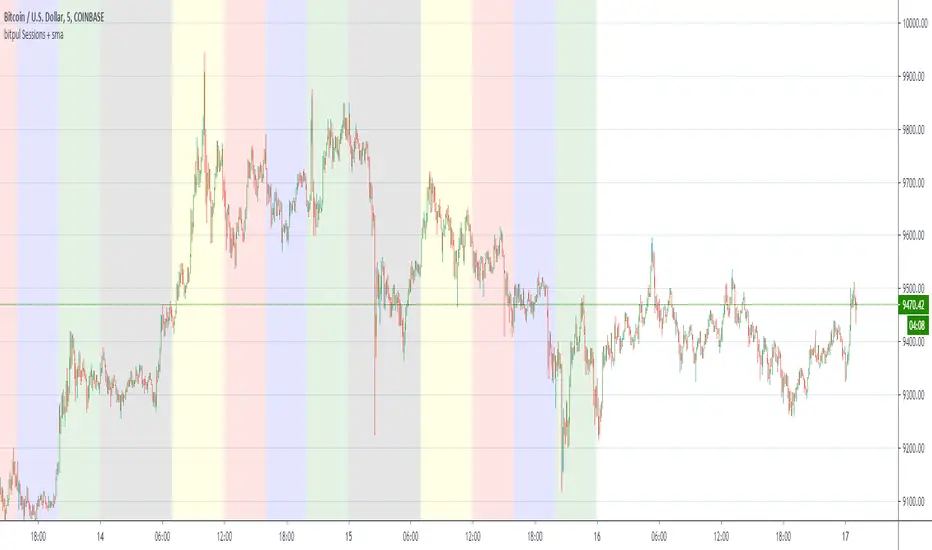
bitpul Sessions + sma [MHMK]Background colors that show open-close of the major market sessions ( Tokyo, London, joint time, New York, free time).
I added two sma to get more confirmation for the reversal - You can hide smas
Timezone Sessions IndicatorBasic timezones and sessions indicator
I have mine collapsed down to a minimum height and it serves only to indicate the time in a more visual way.

Forex Trading Sessions with Daylight Savings TimeV1 - Max WarrenDifferent version of the CM one but everything is configurable and easy to manage.
Daylight savings may also be toggled, I cannot automatically toggle it yet but hopefully with a pine update I will be able to.
It had the four main sessions but version two could possibly have all of them as optional toggles
Hope it is useful

Dual Session VWAPSeparate VWAP with 1 standard deviation band for the regular session as well as electronic session
