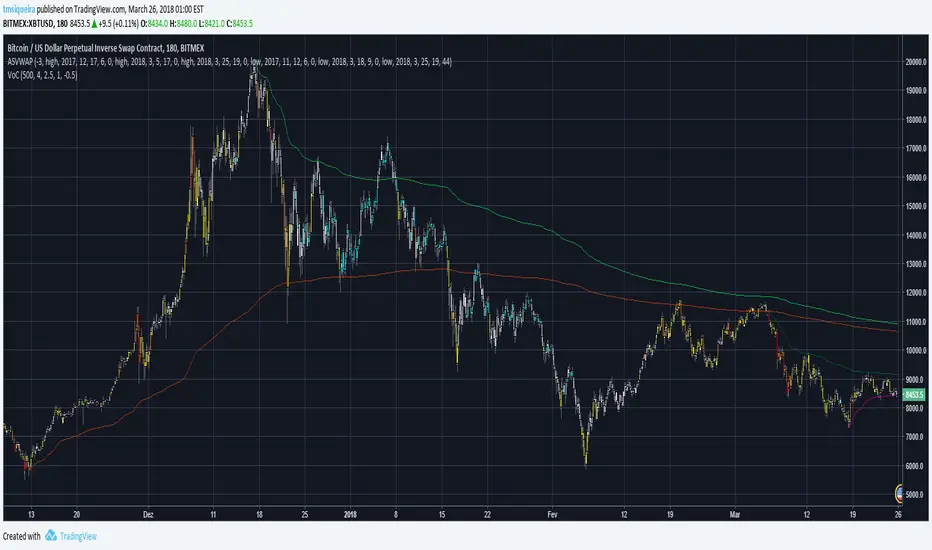
BankNifty - VWAP + StdDev Bands- By Default the script draws Daily VWAP for Bank Nifty based on Futures Volume or underlying Index Stocks based on user input
- Optionally one may Anchor it to Week/Month etc or anchor it from a particular Time.
- It also draws 3 Standard Deviation Bands from the VWAP based on User Input.
- Optionally draws Previous VWAP Close for and Bullish or Bearish Move.
- It works with NIFTY 50 as well but only using Futures Volume(Pine limitation to number of security calls) . Please change the Symbol and Futures Volume symbol to "NSE:NIFTY" and "NSE:NIFTY1!" NSE:BANKNIFTY NSE:NIFTY
在腳本中搜尋"vwap"

HYE Mean Reversion VWAPIndicator version of the strategy "HYE Mean Reversion VWAP"
"Long", "Short", "Exit Long" and "Exit Short" alarms added.
Use with "Once Per Bar Close".
*** I used the "VWAP with period" indicator code of @neolao. Special thanks to @neolao.
Indicator Link:

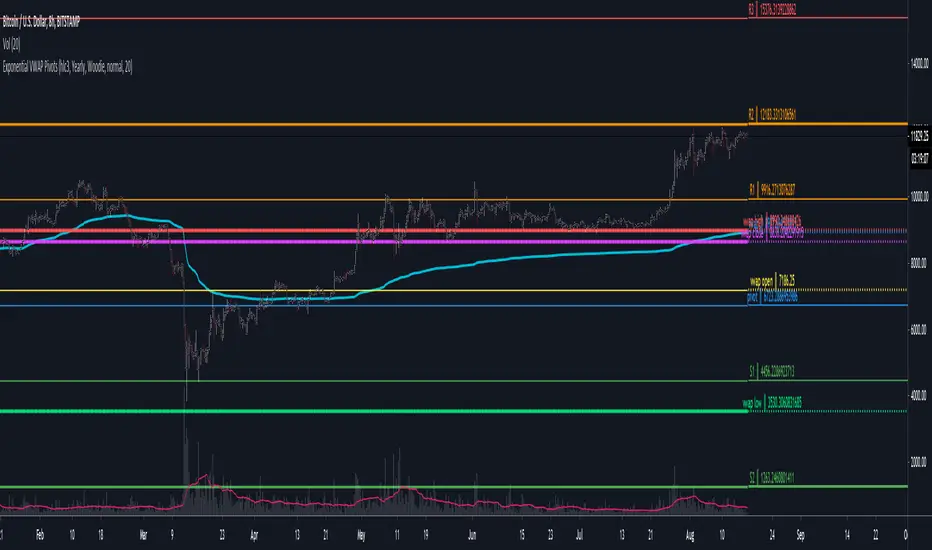
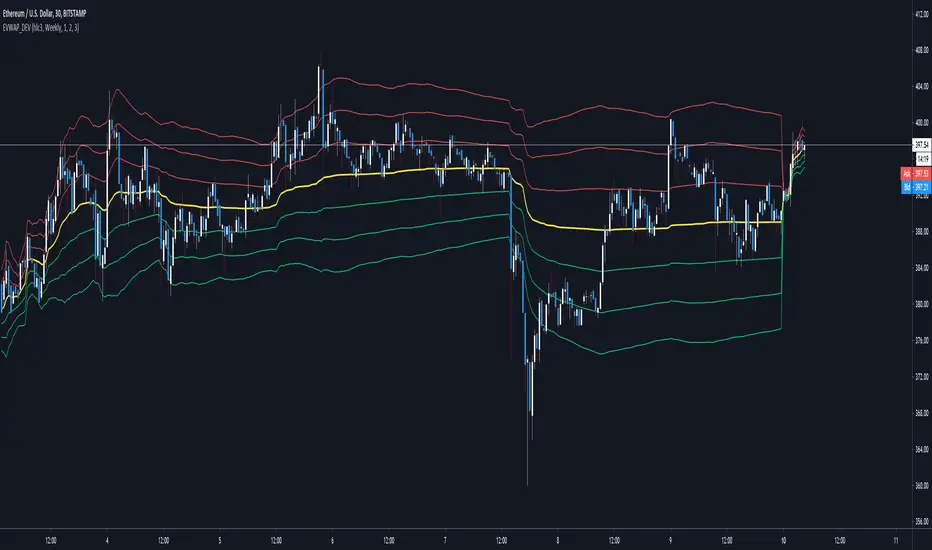
Exponential VWAP & DeviationsExponential Volume Weighted Average Price and Deviations.
Selectable intervals (daily/weekly/monthly/yearly vwap). Options to change deviation multipliers and display interval closing values for the previous interval.
Uses volume weighted EMA for the interval as the basis/vwap & exponential deviations calculated using the exponential vwap as the mean.
Power Indicator - EMAs + VWAP + Volume BarThe Power Indicator is intended to return some exponential moving average, vwap, volume bar, and others. With this compilation, you will be able to use them as one indicator in Trading View.
The components are:
- EMA9 - Exponential Moving Average of 9 days
- EMA21 - Exponential Moving Average of 21 days
- EMA50 - Exponential Moving Average of 50 days
- EMA200 - Exponential Moving Average of 200 days
- Volume Bar - This indicator provides the volume of the candle and its strength by showing different colors. It's a way to check expressive volume in one bar.
- Vwap line
- Indicator
If you have any questions, let me know!
Anchored VWAP BandSimple script to anchor vwap to a drag and drop spot on the chart and display it as a band instead of a line.
the AVAP Band displays:
1. The AVWAP using High as the source
2. The AVWAP using OHLC4 as the source
3. The AVWAP using Low as the source
This is just a different way of visualising VWAP from an anchored point in time (Band vs Line)
EMA + VWAP (CriptoAprendices)CriptoAprendices 2022
Estrategia EMA 9 + VWAP (Day Trading)
Lo ideal es usar EMA DE 9 + VWAP (Session) y operar en grafico de 5 minutos

4EMA SET & VWAP帶有價格及名稱標籤可自訂的4條EMA線和VWAP
Customizable 4 EMA lines and VWAP with price and name labels.

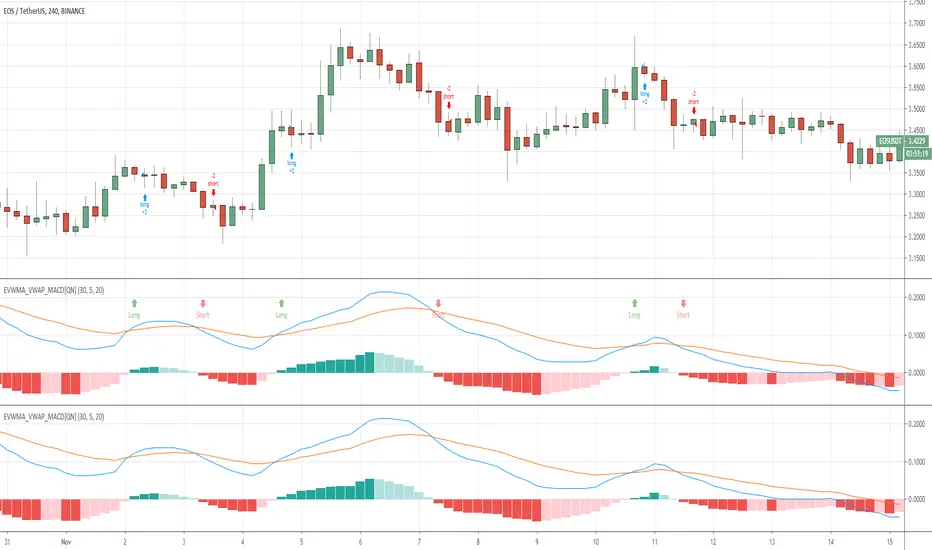
MACD VWAP IndicatorThis indicator uses a combination of the VWAP, EMA 9 and parts of the MACD in order to detect a bullish or bearish trend.
How to trade it:
Set SL either below or above the VWAP line (orange) and TP to 1:1.5 ratio (depending on last few candles, of course).
If EMA200 is close by then place SL either below or above EMA200 (blue) and TP to 1:1.5 ratio
Important:
Best traded in 15M, 30M => Intraday.
Have fun! :)

5min vwap in Multi Time FramesThis indicator will show the 5Min intraday VWAP onto any other timeframe. I like to see where the 5min VWAP is while on the 1Min chart for example.
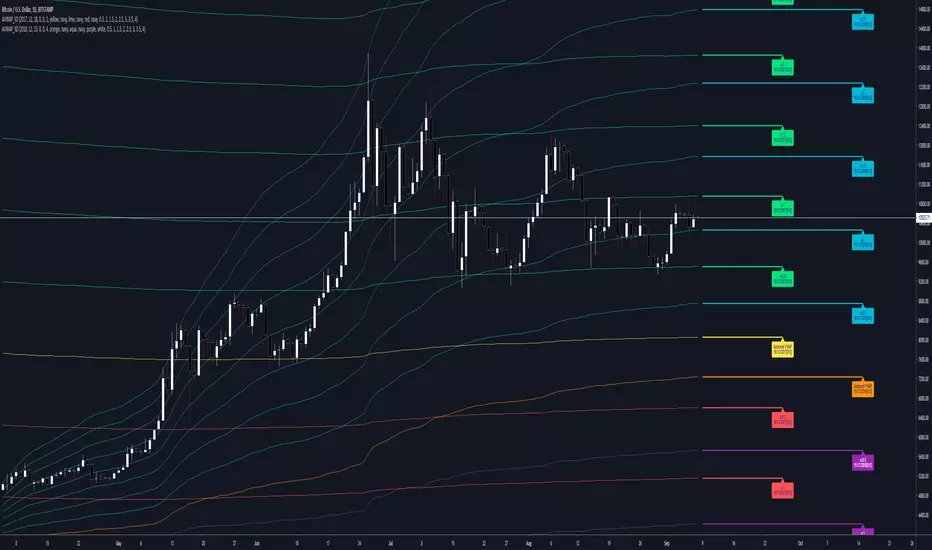
Multi-Period Rolling VWAPMulti-Period Rolling VWAP (MP-RVWAP)
This indicator plots multiple Rolling Volume-Weighted Average Price (RVWAP) lines over different time periods (7, 14, 30, 60, 90, 180, and 360 days) on a single chart. Each RVWAP is calculated using a user-defined timeframe and source (default: HLC3), ensuring consistency across chart resolutions.
Key Features:
Customizable Periods: Toggle visibility for each period (7d, 14d, 30d, 60d, 90d, 180d, 360d) and adjust their colors.
Labels: Each RVWAP line is labeled at the end (e.g., "7d", "360d") for easy identification.
Standard Deviation Bands: Optional bands can be added above and below each RVWAP, with customizable multipliers (set to 0 to hide).
Flexible Timeframe: Define a single timeframe (default: 1D) for all RVWAP calculations, independent of the chart’s timeframe.
Minimum Bars: Set a minimum number of bars (default: 10) to ensure reliable calculations.
Usage:
Ideal for traders analyzing price trends across multiple time horizons. Enable/disable specific RVWAPs, tweak colors, and add bands to suit your strategy.

Bollinger Bands Scalper + VWAPGet more consistent scalps by trading in-between Bollinger Band Deviations.
FEATURES:
1) 3 Bollinger Bands with default settings to 1, 2, and 3 deviations for more consistent scalps
2) Trendicator: a dynamic color changing moving average that helps you see trend quickly
3) Robust VWAP tool with up to 3 different deviations as well as different anchor points to help you see strong support and resistances
4) Calming "purple cloud" color palette helps you focus on price action
5) Discover new trading strategies with a wide range of customizability

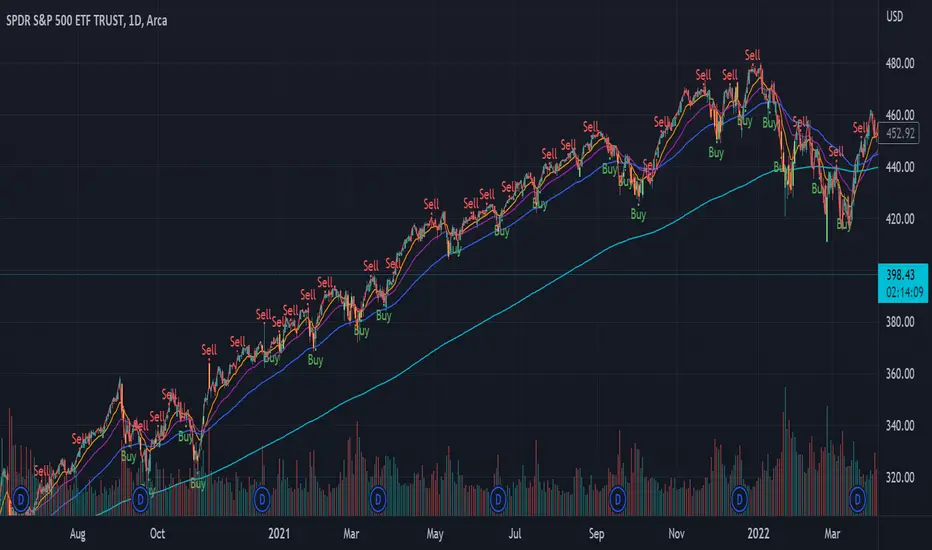
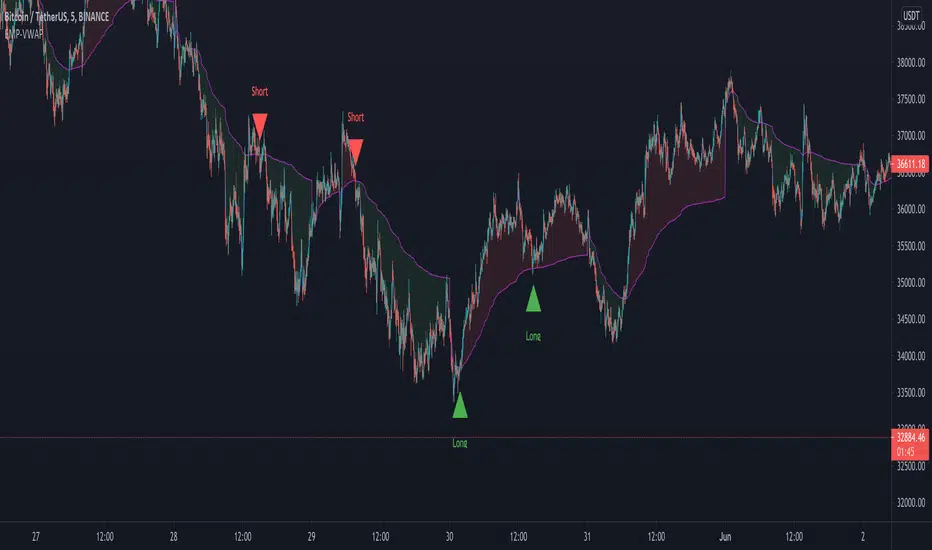
EmperorBTC's VWAP IndicatorThis indicator was created after EmperorBTC's conditions. Conditions displayed below:
Good timeframes for it: 30', 15', 5'
To convert from strategy to study switch the commented lines in the beginning and at the end of the script
What this indicator does is:
1) Check if Pivot Point was crossed
2) Stoch-RSI and VWAP were crossed up in current or previous candle
3) Candle (or previous candle) is green
Then, it will plot a Long opportunity.
FUTURE IDEAS:
- Volume Expansion
- Candle Stick patterns
Flunki VWAP minus MA OscillatorHerewith a simple oscillator that show the difference in price between a Moving Average of the price, and the current VWAP
This show as a histogram
On top of that is a Moving Average of the histogram value, shown as a blue / red line with an option to hight these crossing and also crossing zero
Simple idea ; code open.

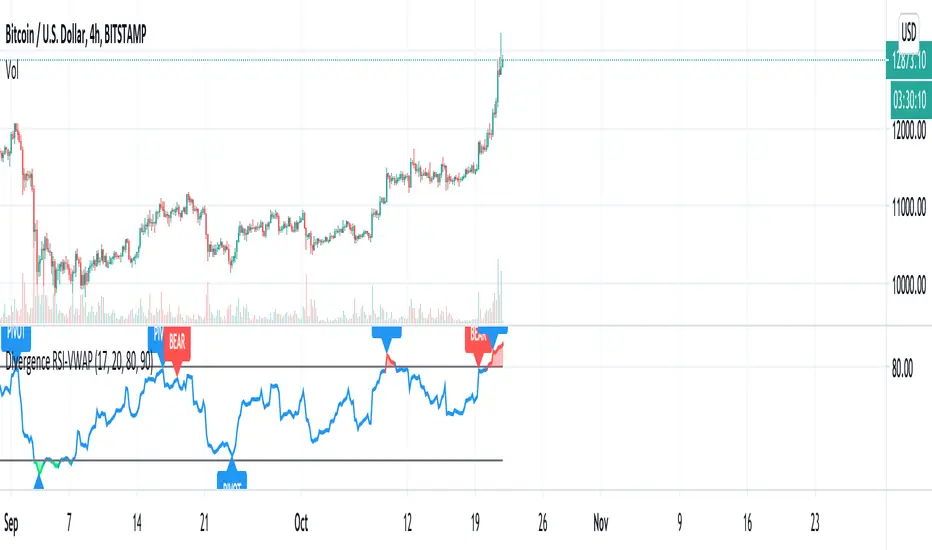
Divergence RSI-VWAPCombination of the script from XaviZ of RSI-VWAP and divergence detector from Libertus.
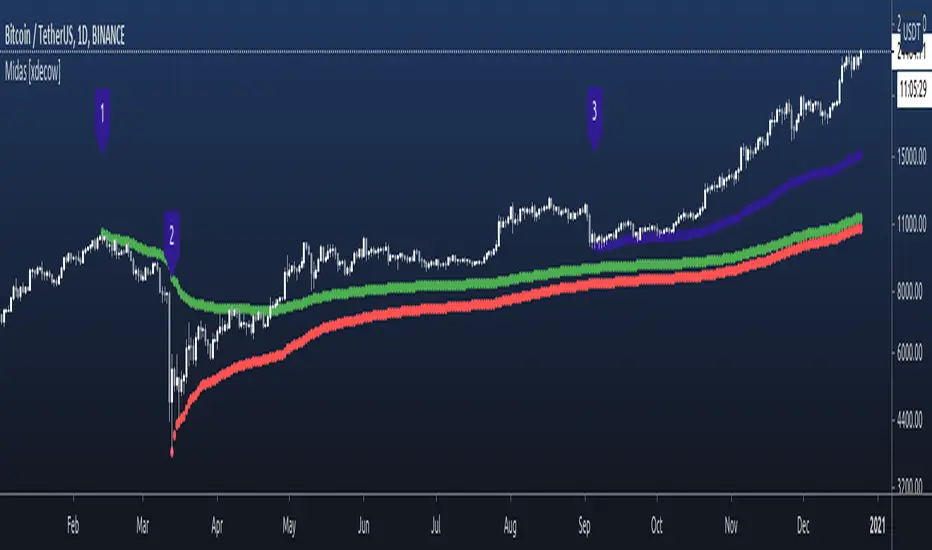
Midas 6 Anchored VWAP [xdecow]This script plots 6 anchored vwap from the selected bars.
The labels are only to help identify the starting points and can be disabled in the options.
Anchored VWAP & Standard DeviationsCalculates VWAP from a fixed point in time as well as standard deviations.
--------------------------------------
If you find it useful please consider a tip/donation :
BTC - 3BMEXEDyWJ58eXUEALYPadbn1wwWKmf6sA
--------------------------------------
All Time VWAP & Standard DeviationsAll time VWAP and standard deviations.
Either enable "scale price chart only" or disable deviations that go negative in the style options.
--------------------------------------
If you find it useful please consider a tip/donation :
BTC - 3BMEXEDyWJ58eXUEALYPadbn1wwWKmf6sA
--------------------------------------


Volume Trends (VWMA & VWAP)Basic indicator for tracking volume trends. Includes blue SMA and pink VWMA (volume-weighted moving average), to help gauge the strength of price movement -- is it supported by volume, or is there divergence. Intraday charts also have VWAP (volume-weighted average price) as dark purple dots.
Here's a couple of good articles explaining how to use them effectively:
www.tradeciety.com
stockcharts.com

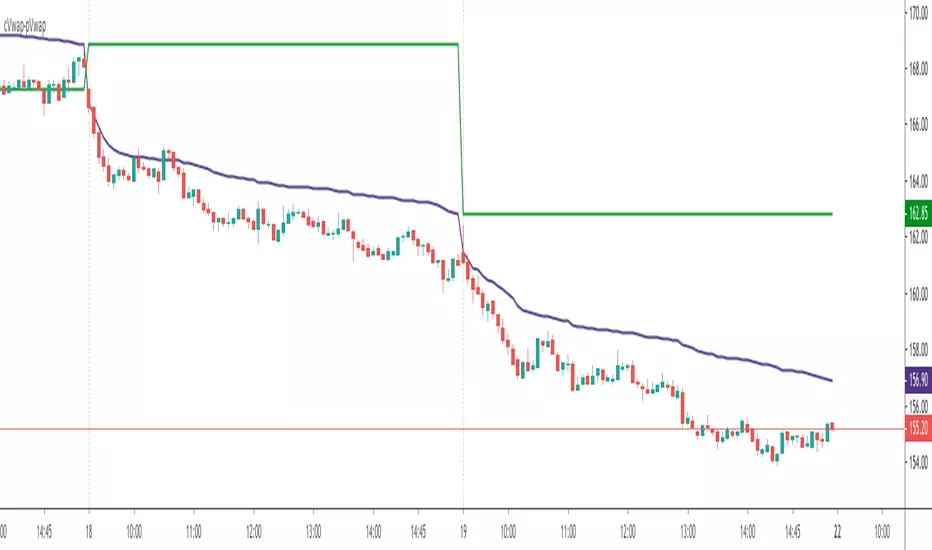
Adjustable Starting VWAPIn this script it's possible adjust the start where the VWAP (technically is a VWMA) starts to calculate.
Use this to try to show where is the suport and resistance.
I coded 6 lines.
Use low sources for suport.
Use high sources for resistance.