Time Weighted Average Price (TWAP)TWAP is a tool used by algorithm based traders that allows them to distribute their orders throughout the day without disturbing price or having their positions known to rival traders in the market.
It's similar to VWAP and serves the same function, except it lacks the volume aspect. This can be an issue when position entry/exit may be affected by slippage. The main benefit of TWAP is deciding how to distribute orders throughout the chosen timeframe.
However, just like the VWAP traders will normally use it as a moving average or target for price action to pull into.
There is an option to change the timeframe that TWAP is calculated on.
References:
empirica.io
arxiv.org
在腳本中搜尋"vwap"

VWMA Keltner BandsKind of like Keltner Channel/Bands (stockcharts.com) but using VWMA instead so that volume is taken in to account.
Outside the upper band can considered to be 'overbought' and outside the lower band can be considered to be 'oversold'
Has option to highlight signals (i.e. when price closes outside a channel) and also the option to only display signals if the price is on the correct side of VWAP (i.e. no sell signals if price is above VWAP)
Moving CovarianceCo-variance is a representation of the average percent data points deviate from there mean. A standard calculation of Co-variance uses One standard Deviation. Using the empirical rule, we can assume that about 68.26% of Data points lie in this range.
The advantage to plotting co variance as a time series is that it will show you how volatility of a trailing period changes. Therefore trend lines and other methods of analysis such as Fibonacci retracements could be applied in order to generate volatility targets.
For the purpose of this indicator I have the mean using a vwma derived from vwap. This makes this measurement of co-variance more sensitive to changes in volume, likewise are more representative a change in volatility, thus giving this indicator a "leading aspect".

AlphaFlow: Oscillator PanelAlphaFlow: Oscillator Panel
The AlphaFlow: Oscillator Panel indicator is a versatile multi-tool designed to provide a comprehensive view of momentum, volatility, and trend strength across different timeframes. This script combines several popular technical analysis tools into a single dashboard for faster decision-making.
Key Features:
WaveTrend Oscillator (WT1 and WT2): Tracks price momentum to help identify potential reversals or trend continuations.
RSI and BBWP : Measures relative strength and volatility compression/expansion.
VWAP-MACD and OBV : Includes volume-based momentum insights and higher timeframe confirmations.
Multi-Timeframe Confluence : Highlights if various oscillators align across multiple timeframes.
Dynamic Table : A dashboard that updates in real time, providing numeric values and playful narratives for easier reading.
Configurable Text Size : Customize the table’s text size for better visibility.
Anchor, Trigger, Snake Eye Labels : These markers appear when WT1 crosses significant thresholds:
Anchor (A): Marks a potential base or bottoming signal.
Trigger (T): Confirms a potential momentum reversal.
Snake Eyes: Indicates particularly strong or rare reversal conditions.
How to Use:
Load the indicator on your chart.
Adjust input parameters like RSI length, BBWP length, CMF length, and others to suit your market and timeframe.
Use the Decision Table: It updates automatically on the latest bar to show oscillator readings, trend state, and multi-timeframe confluence.
Monitor for alignment: Bullish or bearish signals are highlighted when all components agree.
Look for Anchor, Trigger, Snake Eye labels: These help identify key turning points.
Combine with your trading strategy: This indicator is a decision-support tool and should be used with other forms of analysis and risk management.
Important:
This script does not provide financial advice. It’s a technical analysis tool designed to aid traders in decision-making and should be used at your own risk.

David_FairPriceCandlestick_calculatedDescription:
This indicator displays the "Typical Price" for each candle as a visual marker (cross) directly on the chart. The Typical Price is calculated as the average of the High, Low, and Close values of each bar:
(High + Low + Close) / 3
The marker provides a quick visual reference to the fair or average price level within every single candle.
Unlike a Point of Control (POC) or volume-based indicators, this script works purely with price data and is independent of volume or order flow.
Use cases:
Identify where most trading activity may have been concentrated within the candle (for price-based strategies)
Support as a reference line for mean-reversion or fair value concepts
Works on all timeframes and instruments
Customization:
You can easily change the marker style (cross, dot, triangle, etc.) and color within the script.

Live Momentum Alerts - Darrin G.detect setups pre-market, regular hours, and after-hours.
Run this on both stocks and crypto charts.
Receive alerts when momentum crosses the 9 EMA (with RVOL and VWAP filters still active).

Mariam Market DashboardMariam Market Dashboard – A Quick Guide
Purpose:
Shows if the market is trending, volatile, or stuck so you can decide when to trade or wait.
How to Use
Add the indicator to your chart. Adjust basic settings like EMA, RSI, ATR lengths, and timezone if needed. Use it before entering any trade to confirm market conditions.
What Each Metric Means (with general ranges)
Session: Identifies which market session is active (New York, London, Tokyo).
Trend: Shows current market direction. “Up” means price above EMA and VWAP, “Down” means price below. Use this to confirm bullish or bearish bias.
HTF Trend: Confirms trend on a higher timeframe for stronger signals.
ATR (Average True Range): Measures market volatility or price movement speed.
Low ATR (e.g., below 0.5% of price) means quiet or slow market; high ATR (above 1% of price) means volatile or fast-moving market, good for active trades.
Strong Bar: A candlestick closing near its high (above 75% of range) indicates strong buying momentum; closing near its low indicates strong selling momentum.
Higher Volume: Volume higher than average (typically 10-20% above normal) means more market activity and stronger moves.
Volume / Avg Volume: Ratio above 1.2 (120%) shows volume is significantly higher than usual, signaling strong interest.
RVol % (Relative Volume %): Above 100% means volume is hotter than normal, increasing chances of strong moves; below 50% means low activity and possible indecision.
Delta: Difference between buying and selling volume (if available). A positive delta means buyers dominate; negative means sellers dominate.
ADX (Average Directional Index): Measures trend strength:
Below 20 means weak or no trend;
Above 25 means strong trend;
Between 20-25 is moderate trend.
RSI (Relative Strength Index): Momentum oscillator:
Below 30 = oversold (potential buy);
Above 70 = overbought (potential sell);
Between 40-60 means neutral momentum.
MACD: Confirms momentum direction:
Positive MACD histogram bars indicate bullish momentum;
Negative bars indicate bearish momentum.
Choppiness Index: Measures how much the market is ranging versus trending:
Above 60 = very choppy/sideways market;
Below 40 = trending market.
Consolidation: When true, price is stuck in a narrow range, signaling indecision. Avoid breakout trades during this.
Quick Trading Reminder
Trade only when the trend is clear and volume is above average. Avoid trading in low volume or choppy markets.

NIFTY Option Buy Strategy MASTER v1This script is a complete option buying strategy framework for NIFTY, designed for both intraday and positional swing trades.
🔹 Built using multi-timeframe analysis (EMAs, MACD, RSI)
🔹 Combines key macro filters: India VIX, PCR, FII/DII net cash flows
🔹 Supports both Call (CE) and Put (PE) entries
🔹 Includes manual input dashboard for real-time market context
🔹 Trade logic includes:
Bollinger Band breakouts
Volume confirmation
VWAP filtering
EMA crossover + MACD alignment
Resistance/support proximity from option chain (manual)
📈 Smart Trade Management:
Multi-target system (e.g., exit 50% at RR=1, 50% at RR=2)
Trailing stop-loss after target 1 hits
Automatic exit on SL/TP or reverse signals
Visual markers for all entries, exits, and stops
📊 Built-in Dashboard:
Displays India VIX, PCR, FII/DII flows, and S/R levels
Strike price selection (ATM + offset logic)
🧪 Ideal for backtesting, alerts, and real-time execution.
Can be used with alerts + webhook for automated trading or signal generation.
⚠️ Note: This script is for educational purposes only. Always test on paper trading before going live.

UTC Day SeparatorsGlobally consistent back-tests: When you anchor indicators (VWAP, ADR, supply/demand boxes) to daily boundaries, basing them on UTC avoids daylight-saving mismatches between exchanges.
Quick regime inspection: You can eyeball overnight gaps or Asia/Europe/US session overlaps by seeing how price behaves relative to successive UTC days.
Chart cleanliness: Because the line is dotted and low-contrast, it gives a subtle reference grid without overwhelming candles or other plots.

Institutional MFI + VWAP Engine PROMoney flow index, shows green when momentum is bullish and red when bearish

Combined ATPC & MACD DivergenceTrend Optimizer + Divergence Finder in One Unified Tool
🔍 Overview:
This powerful dual-system indicator merges two proven analytical engines:
✅ The Algorganic Typical Price Channel (ATPC) — a custom trend oscillator that highlights mean-reversion and directional bias.
✅ A refined MACD system with divergence detection, enhanced with an adjusted Donchian midline for real-time trend strength filtering.
Together, they provide a high-confidence, multi-signal system ideal for swing trading, scalping, or confirming reversals with context.
⚙️ Core Components & Logic
🧠 1. ATPC Engine (Trend Commodity Index)
A momentum and volatility-normalized oscillator based on the typical price (H+L+C)/3:
TrendCI Line (Blue) – Main trend signal based on smoothed CCI logic.
TrendLine2 (Orange) – A slower smoothing of TrendCI for crossovers.
Key Zones (customizable):
🔴 Ultra Overbought: +73
🟣 Overbought: +58
🟣 Oversold: -58
🔴 Ultra Oversold: -73
Trade Logic:
✅ Buy Signal: TrendCI crosses above TrendLine2 while in oversold zone
❌ Sell Signal: TrendCI crosses below TrendLine2 while in overbought zone
Additional visual feedback:
Histogram Bars show strength and direction of momentum shift
Green/Red Circles highlight potential long/short setups
📉 2. MACD System + Divergence Finder
Classic MACD enhanced with a Donchian Midline overlay to filter trend bias.
🔷 MACD Line and 🟠 Signal Line show crossover momentum
🟩/🟥 Histogram shows distance from the signal line
🟪 Adjusted Donchian Midline dynamically adapts to range-bound vs trending environments
Background Color provides real-time trend state:
✅ Green = Bullish Trend
❌ Red = Bearish Trend
No color = Neutral / Choppy
MACD Boundaries (user-defined):
Overbought: +1.0
Oversold: -1.0
🔀 3. Divergence Detection
Spot hidden power shifts before price reacts:
🔼 Positive Divergence – Price makes lower lows, but MACD histogram rises
🔽 Negative Divergence – Price makes higher highs, but MACD histogram weakens
These are visually marked with:
Green “+Div” label (bullish reversal cue)
Red “–Div” label (bearish exhaustion signal)
🎯 How to Use It
For Trend Traders:
Stay in sync with macro trend using MACD histogram + background
Use ATPC crossovers for precision entries
Avoid signals during neutral background (chop filter)
For Reversal Traders:
Look for bullish +Div with ATPC buy signal in oversold zone
Look for bearish –Div with ATPC sell signal in overbought zone
Mid-Donchian line can act as confluence or breakout trigger
For Scalpers & Intraday Traders:
Combine with VWAP, liquidity zones, or order flow levels
ATPC crossovers + MACD histogram zero-line flip = potential scalp entry
Use histogram slope and divergence to avoid false momentum traps
🧩 Customizable Inputs
🎛️ ATPC: Channel & Smoothing lengths, overbought/oversold thresholds
🎛️ MACD: Fast/slow EMAs, signal smoothing, Donchian period, bounds
🎨 Fully theme-compatible with adjustable colors and line styles
🔔 Alerts (Add Your Own)
While this version doesn’t contain built-in alerts, you can easily add alerts based on:
buySignal or sellSignal from ATPC logic
Histogram cross zero or trend flip
MACD Divergence event
📜 “This indicator doesn't just show signals—it tells a story about who’s in control of the market, and when that control might be slipping.”

5EMA_BB_ScalpingWhat?
In this forum we have earlier published a public scanner called 5EMA BollingerBand Nifty Stock Scanner , which is getting appreciated by the community. That works on top-40 stocks of NSE as a scanner.
Whereas this time, we have come up with the similar concept as a stand-alone indicator which can be applied for any chart, for any timeframe to reap the benifit of reversal trading.
How it works?
This is essentially a reversal/divergence trading strategy, based on a widely used strategy of Power-of-Stocks 5EMA.
To know the divergence from 5-EMA we just check if the high of the candle (on closing) is below the 5-EMA. Then we check if the closing is inside the Bollinger Band (BB). That's a Buy signal. SL: low of the candle, T: middle and higher BB.
Just opposite for selling. 5-EMA low should be above 5-EMA and closing should be inside BB (lesser than BB higher level). That's a Sell signal. SL: high of the candle, T: middle and lower BB.
Along with we compare the current bar's volume with the last-20 bar VWMA (volume weighted moving average) to determine if the volume is high or low.
Present bar's volume is compared with the previous bar's volume to know if it's rising or falling.
VWAP is also determined using `ta.vwap` built-in support of TradingView.
The Bolling Band width is also notified, along with whether it is rising or falling (comparing with previous candle).
What's special?
We love this reversal trading, as it offers many benifits over trend following strategies:
Risk to Reward (RR) is superior.
It _Does Hit_ stop losses, but the stop losses are tiny.
Means, althrough the Profit Factor looks Nahh , however due to superior RR, end of day it ended up in green.
When the day is sideways, it's difficult to trade in trending strategies. This sort of volatility, reversal strategies works better.
It's always tempting to go agaist the wind. Whole world is in Put/PE and you went opposite and enter a Call/CE. And turns out profitable! That's an amazing feeling, as a trader :)
How to trade using this?
* Put any chart
* Apply this screener from Indicators (shortcut to launch indicators is just type / in your keyboard).
* It will show you the Green up arrow when buy alert comes or red down arrow when sell comes. * Also on the top right it will show the latest signal with entry, SL and target.
Disclaimer
* This piece of software does not come up with any warrantee or any rights of not changing it over the future course of time.
* We are not responsible for any trading/investment decision you are taking out of the outcome of this indicator.

Candle Volume Profile Marker# 📊 Candle Volume Profile Marker (CVPM)
**Transform your chart analysis with precision volume profile levels on every candle!**
The Candle Volume Profile Marker displays key volume profile levels (POC, VAH, VAL) for individual candles, giving you granular insights into price acceptance and rejection zones at the micro level.
## 🎯 **Key Features**
### **Core Levels**
- **POC (Point of Control)** - The price level with highest volume concentration
- **VAH (Value Area High)** - Upper boundary of the value area
- **VAL (Value Area Low)** - Lower boundary of the value area
- **Customizable Value Area** - Adjust percentage from 50% to 90%
### **Flexible Display Options**
- **Current Candle Only** or **Historical Lookback** (1-50 candles)
- **Multiple Visual Styles** - Lines, dots, crosses, triangles, squares, diamonds
- **Smart Line Extensions** - Right only, both sides, or left only
- **4 Line Length Modes** - Normal, Short, Ultra Short, Micro (for ultra-clean charts)
- **Full Color Customization** - Colors, opacity, line width
- **Adjustable Marker Sizes** - Tiny to Large
### **Advanced Calculation Methods**
Choose your POC calculation:
- **Weighted** - Smart estimation based on volume distribution (default)
- **Close** - Uses closing price
- **Middle** - High-Low midpoint
- **VWAP** - Volume weighted average price
### **Professional Tools**
- **Real-time Info Table** - Current levels display
- **Smart Alerts** - POC crosses and Value Area breakouts
- **Highlight Current Candle** - Extended dotted lines for current levels
- **Developing Levels** - Real-time updates for active candle
## 🚀 **Why Use CVPM?**
### **Precision Trading**
- Identify exact support/resistance on each candle
- Spot volume acceptance/rejection zones
- Plan entries and exits with micro-level precision
### **Clean & Customizable**
- Lines extend only right (eliminates confusion)
- Ultra-short line options for minimal chart clutter
- Professional appearance with full customization
### **Multiple Timeframes**
- Works on any timeframe from 1-minute to monthly
- Historical analysis with adjustable lookback
- Real-time developing levels
## 📈 **Perfect For**
- **Day Traders** - Micro-level entry/exit points
- **Swing Traders** - Key levels for position management
- **Volume Analysis** - Understanding price acceptance zones
- **Support/Resistance Trading** - Precise level identification
- **Breakout Trading** - Value area breakout alerts
## ⚙️ **Easy Setup**
1. Add indicator to your chart
2. Choose your preferred visual style (lines/dots)
3. Select line extension (right-only recommended)
4. Adjust line length (try "Ultra Short" for clean charts)
5. Customize colors and enable alerts
## 🎨 **Customization Groups**
- **Display Options** - What to show and how many candles
- **Calculation** - POC method and value area percentage
- **POC Visual** - Style, color, width, length for Point of Control
- **Value Area Visual** - Style, color, width, length for VAH/VAL
- **Line Settings** - Extension direction and length modes
- **Size** - Marker sizes and opacity
## 🔔 **Built-in Alerts**
- Price crosses above/below POC
- Value Area breakouts (up/down)
- Fully customizable alert messages
## 💡 **Pro Tips**
- Use "Right Only" extension to avoid confusion about which candle owns the levels
- Try "Ultra Short" or "Micro" line modes for cleaner charts
- Enable "Highlight Current Candle" for extended reference lines
- Combine with volume indicators for enhanced analysis
- Use different colors for easy POC/VAH/VAL identification
---
**Transform your volume analysis today with the most flexible and customizable candle-level volume profile indicator available!**
*Perfect for traders who demand precision and clean, professional charts.*

TICK Extreme Levels & AlertsAutomatically draws horizontal lines at +1000 and -1000 TICK levels
Sends alerts when TICK crosses those levels (for potential scalping/reversal setups)
Strategy: How to Use TICK in Real-Time Trading
1. Confirm Market Breadth
Use TICK to confirm broad participation in the move:
• Long S&P futures or SPY? Only buy breakouts if TICK is above +600 to +1000
• Shorting? Confirm with TICK below –600 to –1000
2. Fade Extremes for Scalps
Look for reversals at extreme levels:
• Fade +1200+: market likely overbought short term → scalp short
• Fade –1200–: market likely oversold → scalp long
Use in combo with other signals (like price exhaustion, candlestick reversal, or VWAP touches)
3. Avoid Trading in the Choppy Zone
If TICK remains between –400 and +400, institutions are not committed. This is where fakeouts are common.
4. Time Entries with TICK Swings
For example:
• TICK moves from –800 to +600 = momentum shift → look for long entries
• TICK stalling around +1000 = momentum climax → partial profit or fade play

Pin Bar Highlighter OnlyAbsolutely — here’s a full **description and breakdown** of what the script does:
---
## 📜 Script Name:
**"Pin Bar Highlighter Only"**
---
## 🎯 Purpose:
This script **detects and highlights classic pin bar reversal candles** directly on the chart — without plotting any entry, stop loss, or take profit levels.
It’s designed for traders who:
* Want to manually assess trades
* Prefer a clean chart
* Use pin bar price action as a signal for potential reversals
---
## ✅ What It Does:
* **Scans each candle** to check if it qualifies as a **bullish** or **bearish pin bar**
* If valid:
* Plots a **green triangle below** bullish pin bars
* Plots a **red triangle above** bearish pin bars
* Keeps your chart **minimal and uncluttered**
---
## 📌 How It Detects a Pin Bar:
### 🔹 1. Candle Structure:
* Measures the total candle range: `high - low`
* Calculates the **body size**: `abs(close - open)`
* Calculates the **upper and lower wick sizes**
### 🔹 2. Pin Bar Criteria:
* The **wick (nose)** must be at least **2/3 of the total candle length**
* The **body** must be small — **≤ 1/3** of the total range
* The **body** must be located at **one end** of the candle
* The wick must **pierce the high/low** of the previous candle
---
## 📍 Bullish Pin Bar Requirements:
* Close > Open (green candle)
* Lower wick ≥ 66% of candle range
* Body ≤ 33% of range
* Candle **makes a new low** (current low < previous low)
### 📍 Bearish Pin Bar Requirements:
* Close < Open (red candle)
* Upper wick ≥ 66% of candle range
* Body ≤ 33% of range
* Candle **makes a new high** (current high > previous high)
---
## 🖼️ Visual Output:
* 🔻 Red triangle **above** bearish pin bars
* 🔺 Green triangle **below** bullish pin bars
---
## 🛠️ Example Use Cases:
* Identify **reversal points** at support/resistance
* Confirm signals with **VWAP**, supply/demand zones, or AVWAP (manually plotted)
* Use in **conjunction with other strategies** — without clutter
---
Full Day Midpoint Line with Dynamic StdDev Bands (ETH & RTH)A Pine Script indicator designed to plot a midpoint line based on the high and low prices of a user-defined trading session (typically Extended Trading Hours, ETH) and to add dynamic standard deviation (StdDev) bands around this midpoint.
Session Midpoint Line:
The midpoint is calculated as the average of the session's highest high and lowest low during the defined ETH period (e.g., 4:00 AM to 8:00 PM).
This line represents a central tendency or "fair value" for the session, similar to a pivot point or volume-weighted average price (VWAP) anchor.
Interpretation:
Prices above the midpoint suggest bullish sentiment, while prices below indicate bearish sentiment.
The midpoint can act as a dynamic support/resistance level, where price may revert to or react at this level during the session.
Dynamic StdDev Bands:
The bands are calculated by adding/subtracting a multiple of the standard deviation of the midpoint values (tracked in an array) from the midpoint.
The standard deviation is dynamically computed based on the historical midpoint values within the session, making the bands adaptive to volatility.
Interpretation:
The upper and lower bands represent potential overbought (upper) and oversold (lower) zones.
Prices approaching or crossing the bands may indicate stretched conditions, potentially signaling reversals or breakouts.
Trend Identification:
Use the midpoint as a reference for the session’s trend. Persistent price action above the midpoint suggests bullishness, while below indicates bearishness.
Combine with other indicators (e.g., moving averages, RSI) to confirm trend direction.
Support/Resistance Trading:
Treat the midpoint as a dynamic pivot point. Price rejections or consolidations near the midpoint can be entry points for mean-reversion trades.
The StdDev bands can act as secondary support/resistance levels. For example, price reaching the upper band may signal a potential short entry if accompanied by reversal signals.
Breakout/Breakdown Strategies:
A strong move beyond the upper or lower band may indicate a breakout (bullish above upper, bearish below lower). Confirm with volume or momentum indicators to avoid false breakouts.
The dynamic nature of the bands makes them useful for identifying significant price extensions.
Volatility Assessment:
Wider bands indicate higher volatility, suggesting larger price swings and potentially riskier trades.
Narrow bands suggest consolidation, which may precede a breakout. Traders can prepare for volatility expansions in such scenarios.
The "Full Day Midpoint Line with Dynamic StdDev Bands" is a versatile and visually intuitive indicator well-suited for day traders focusing on session-specific price action. Its dynamic midpoint and volatility-adjusted bands provide valuable insights into support, resistance, and potential reversals or breakouts.

Volume CandlesVolume Candles — Context-Aware Candle Color
Description:
This visual indicator colors your price candles based on relative volume intensity, helping traders instantly detect low, medium, and high volume activity at a glance. It supports two modes — Percentile Ranking and Volume Average — offering flexible interpretation of volume pressure across all timeframes.
It uses a 3-tiered color system (bright, medium, dark) with customizable tones for both bullish and bearish candles.
How It Works:
You can choose between two modes for volume classification:
Ranking Mode (Default):
Measures current volume’s percentile rank over a lookback period. Higher percentiles = stronger color intensity.
Percentile thresholds:
< 50% → light color (low volume)
50–80% → medium intensity
> 80% → high volume
Volume Average Mode:
Compares current volume against its simple moving average (SMA).
Volume thresholds:
< 0.5× SMA → light color
Between 0.5× and 1.5× → medium
> 1.5× → high intensity
Candle Paint:
Candles are colored directly on the chart, not in a separate pane. Bullish candles use green shades, bearish use red. All colors are fully customizable.
How to Interpret:
Bright Colors = High volume (potential strength or climax)
Muted/Transparent Colors = Low or average volume (consolidation, traps)
Example Use Cases:
Spot fakeouts with large price movement on weak volume (dark color)
Confirm breakout strength with bright candles
Identify stealth accumulation/distribution
Inputs & Settings:
Mode: Ranking Percentile or Volume Average
Lookback Period for ranking and SMA
Custom Colors for bullish and bearish candles at 3 intensity levels
Best For:
Price action traders wanting context behind each candle
Scalpers and intraday traders needing real-time volume feedback
Anyone using volume as a filter for entries or breakouts
Pro Tips:
Combine with Price Action, Bollinger Bands or VWAP/EMA levels to confirm breakout validity and intent behind a move.
Use alongside RSI/MACD divergences for high-volume reversal signals.
For swing trading, expand the lookback period to better normalize volume over longer trends.

MACD of RSI [TORYS]MACD of RSI — Momentum & Divergence Scanner
Description:
This enhanced oscillator applies MACD logic directly to the Relative Strength Index (RSI) rather than price, giving traders a clearer look at internal momentum and early shifts in trend strength. Now featuring a custom histogram, dual MA types, and RSI-based divergence detection — it’s a complete toolkit for identifying exhaustion, acceleration, and hidden reversal points in real time.
How It Works:
Calculates the MACD line as the difference between a fast and slow moving average of RSI. Adds a Signal Line (MA of the MACD) and plots a Histogram to show momentum acceleration/deceleration. Both RSI MAs and the Signal Line can be toggled between EMA and SMA for custom tuning.
Divergence Detection:
Bullish Divergence : Price makes a lower low while RSI makes a higher low → labeled with a green “D” below the curve.
Bearish Divergence : Price makes a higher high while RSI makes a lower high → labeled with a red “D” above the curve.
Configurable lookback window for tuning sensitivity to pivots, with 4 as the sweet spot.
RSI Pivot Dot Signals:
Plots green dots at RSI oversold pivot lows below 30,
Plots red dots at overbought pivot highs above 70.
Helps detect short-term exhaustion or bounce zones, plotted right on the MACD-RSI curve.
RSI 50 Crosses (Optional):
Optional ▲ and ▼ labels when RSI crosses its 50 midline — useful for momentum trend shifts or pullback confirmation, or to detect consolidation.
Histogram:
Plotted as a column chart showing the distance between MACD and Signal Line.
Colored dynamically:
Bright green : Momentum rising above zero
Light green : Weakening above zero
Bright red : Momentum falling below zero
Light red : Weakening below zero
The zero line serves as the mid-point:
Above = Bullish Bias
Below = Bearish Bias
How to Interpret:
Momentum Confirmation:
Use MACD cross above Signal Line with a rising histogram to confirm breakouts or trend entries.
Histogram shrinking near zero = momentum weakening → caution or reversal.
Exhaustion & Reversals:
Dot signals near RSI extremes + histogram peak can suggest overbought/oversold pressure.
Use divergence labels ("D") to spot early reversal signals before price breaks structure.
Inputs & Settings:
RSI Length
Fast/Slow MA Lengths for MACD (applied to RSI)
Signal Line Length
MA Type: Choose between EMA and SMA for MACD and Signal Line
Pivot Sensitivity for dot markers
Divergence Logic Toggle
Show/hide RSI 50 Crosses
Best For:
Traders who want momentum insight from inside RSI, not price
Scalpers using divergence or exhaustion entries
Swing traders seeking entry confirmation from signal crossovers
Anyone using multi-timeframe confluence with RSI and trend filters
Pro Tips:
Combine this with:
Bollinger Bands breakouts and reversals
VWAP or EMAs to filter entries by trend
Volume spikes or BBW squeezes for volatility confirmation
TTM Scalper Alert to sync structure and momentum

Prev-Day High-Low Box 09:30-15:30This indicator plots a visual range box for the previous day's regular trading session, based specifically on 09:30 AM to 3:30 PM market hours (Eastern Time by default).
Features:
Automatically detects each new trading day
Draws a box from the previous day’s high to low
Box extends into the current session for a set number of bars (default: 160)
Labels mark the previous high and previous low individually
Clean and minimal — only one box and label set is drawn at a time
Works on intraday timeframes (1min, 5min, 15min, etc.)
Use it to:
Identify zones of interest from the last session
Watch for breakouts, reversals, or mean reversion setups
Combine with VWAP, moving averages, or price action for added context
This tool is handy for day traders and scalpers who want to map out the structure of prior sessions during live trading hours.

RSI Z-Score + TableHow It Works
RSI Calculation
The standard RSI is computed over a user-defined period (default: 14), measuring the strength of recent price movements.
Z-Score Transformation
The RSI is then normalized using the Z-Score formula:
ini
Kopieren
Bearbeiten
Z = (RSI - Mean) / Standard Deviation
This highlights whether RSI is unusually high or low compared to its historical behavior.
Smoothing
An optional EMA is applied to the Z-Score for smoother and more reliable signals (default: 10-period smoothing).
Z-Score Table
A real-time value of the RSI Z-Score is displayed in a table in the top-right of the indicator pane.
The value is clamped between +2 and -2
+2 aligns with strong overbought RSI conditions
-2 aligns with strong oversold RSI conditions
How to Use It
Buy Signal Potential: When the Z-Score drops below -1.5 or -2 → statistically oversold RSI
Sell Signal Potential: When the Z-Score rises above +1.5 or +2 → statistically overbought RSI
Use in Confluence: Combine with price action, trend filters, or other Z-Score indicators (e.g. OBV, VWAP, VIX) for SDCA or mean-reversion strategies

Extended-hours Volume vs AVOL// ──────────────────────────────────────────────────────────────────────────────
// Extended-Hours Volume vs AVOL • HOW IT WORKS & HOW TO TRADE IT
// ──────────────────────────────────────────────────────────────────────────────
//
// ░ What this indicator is
// ------------------------
// • It accumulates PRE-MARKET (04:00-09:30 ET) and AFTER-HOURS (16:00-20:00 ET)
// volume on intraday charts and compares that running total with the stock’s
// 21-day average daily volume (“AVOL” by default).
// • Three live read-outs are shown in the data-window/table:
//
// AH – volume traded since the 16:00 ET close
// PM – volume traded before the 09:30 ET open
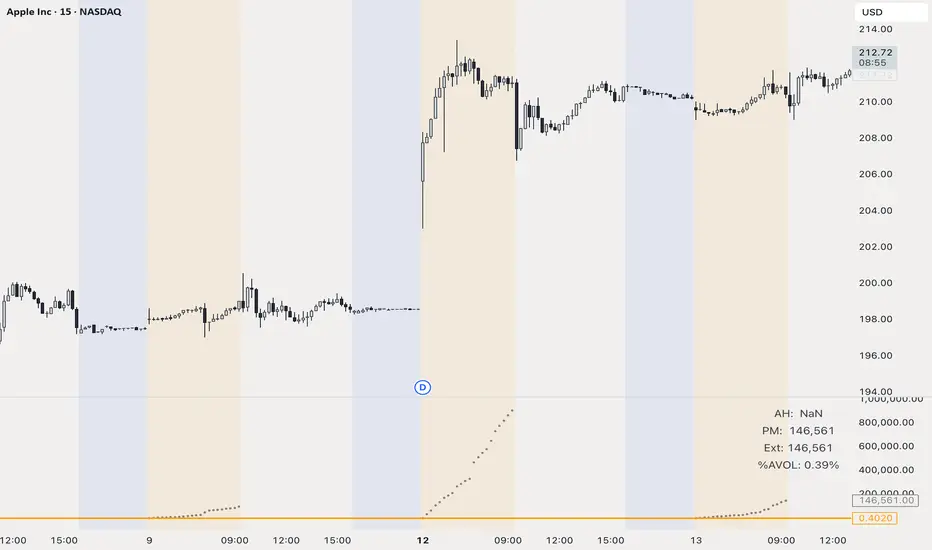
// Ext – AH + PM (updates in pre-market only)
// %AVOL – Ext ÷ AVOL × 100 (updates in pre-market)
//
// • It is intended for U.S. equities but the session strings can be edited for
// other markets.
//
// ░ Why it matters
// ----------------
// Big extended-hours volume almost always precedes outsized intraday range.
// By quantifying that volume as a % of “normal” trade (AVOL), you can filter
// which gappers and news names deserve focus *before* the bell rings.
//
// ░ Quick-start trade plan (educational template – tune to taste)
// ----------------------------------------------------------------
// 1. **Scan** the watch-list between 08:30-09:25 ET.
// ► Keep charts on 1- or 5-minute candles with “Extended Hours” ✔ checked.
// 2. **Filter** by `Ext` or `%AVOL`:
// – Skip if < 10 % → very low interest
// – Flag if 20-50 % → strong interest, Tier-1 candidate
// – Laser-focus if > 50 % → crowd favourite; expect liquidity & range
// 3. **Opening Range Breakout (long example)**
// • Preconditions: Ext ≥ 20 % & price above yesterday’s close.
// • Let the first 1- or 5-min bar complete after 09:30.
// • Stop-buy 1 tick above that bar (or pre-market high – whichever higher).
// • Initial stop below that bar low (or pre-market low).
// • First target = 1R or next HTF resistance.
// 4. **Red-to-Green reversal (gap-down long)**
// • Ext ≥ 30 % but pre-market gap is negative.
// • Enter as price reclaims yesterday’s close on live volume.
// • Stop under reclaim bar; scale out into VWAP / first liquidity pocket.
// 5. **Risk** – size so the full stop is ≤ 1 R of account. Volume fade or
// loss of %AVOL slope is a reason to tighten or exit early.
//
// ░ Tips
// ------
// • AVOL look-back can be changed in the input panel (21 days ⇒ ~1 month).
// • To monitor several symbols, open a multi-chart layout and sort your
// watch-list by %AVOL descending – leaders float to the top automatically.
// • Replace colour constants with hex if the namespace ever gets shadowed.
//
// ░ Disclaimer
// ------------
// For educational purposes only. Not financial advice. Trade your own plan.
//
// ──────────────────────────────────────────────────────────────────────────────
TTM Scalper AlertTTM Scalper Alert — Real-Time Pivot Detector
Description:
This is a custom implementation of the classic TTM Scalper Alert, adapted to show early pivot detection and trend structure tracking in real-time. The script identifies potential highs and lows before the full pivot confirmation—giving traders an early edge—and removes outdated signals once pivots are confirmed.
It supports two levels of detection:
Fast Alert Pivots : Identified after Alert Period candles confirm a local reversal.
Confirmed Pivots : Validated only after Pivot Period candles on both sides ensure a true swing high/low.
How It Works:
Fast Detection (Early Pivots):
Detected after Alert Period (AP) candles. These are provisional signals, shown as triangle labels (▲▼) near current price. Only the latest signal is shown; previous fast pivots are deleted to avoid clutter.
Confirmed Pivots:
Detected with a full lookback of Pivot Period (PP) on both sides of the candle. Shown using plotshape with triangle markers (▲▼). Serve as anchors for price structure analysis (HH-HL or LL-LH tracking).
Custom Source Option:
Users can choose to base pivots on High/Low or Close/Open range. Helps adjust sensitivity depending on volatility or bar structure.
How to Interpret:
Trend & Market Structure:
Use Confirmed Pivots (plotshapes) to analyze market structure:
HH → HL: Uptrend
LL → LH: Downtrend
Watch for breaks in structure for possible reversals
Early Alerts:
The floating labels (▲▼) represent early warnings of a potential pivot. Use them to anticipate:
Short-term exhaustion
Quick scalping entries
Divergence setups
Inputs:
Source : Choose from High/Low or Close/Open — affects how pivots are calculated
Alert Period : How fast the script detects an early reversal pattern (used for entry timing)
Pivot Period : How many candles before/after to confirm a full pivot (used for structural analysis)
Best For:
Traders who follow price action and structure
Scalpers and intraday traders who want early signals
Anyone using pivot highs/lows for confluence with other tools (like RSI divergence, Bollinger Bands, VWAP, etc.)
Pro Tips:
Combine this with:
Trend Magic or Supertrend for directional bias
Volume spike filters to confirm reversal intent
RSI/CCI divergence to strengthen reversal pivots
Adjust Alert Period to tune early signal sensitivity (lower = faster but noisier)

Compression Patterns (w/ Trend + Proximity Filter)🧠 Description:
This indicator identifies high-probability price compression patterns within trending environments — a setup prized by experienced swing and day traders alike. It combines the classic NR4, NR7, 2-Bar NR, 3-Bar NR, and Inside Day formations with a powerful trend filter and proximity logic to deliver clear, focused signals.
🔍 What's Inside:
▪️ Compression Patterns
The core of this tool lies in the logic of price compression. These patterns signal the market taking a breath — volatility contracts, volume dries up, and price coils like a spring.
When this happens in the right context, the next move is often explosive.
NR4 / NR7: Narrowest range in 4 or 7 bars — excellent for spotting the quiet before the storm.
2-Bar NR / 3-Bar NR: These identify the tightest consecutive 2 or 3-day ranges over the past 20 days — contextually rare and powerful.
Inside Day: A simple but highly effective consolidation pattern, especially when it clusters around key moving averages.
▪️ Trend Filter (EMA Stack)
You could say this is where most indicators fall apart — no context.
This one doesn’t make that mistake.
Signals only fire when the 10 EMA > 20 EMA > 50 EMA, and price is above the 20 EMA. That’s a strong, established uptrend — the only environment where breakouts are statistically favourable.
Why?
Because trend following works.
It may not give you fixed daily returns, but it’s the only strategy with theoretically infinite profit potential. You risk little, trade less, and position yourself for rare but massive moves. That’s the edge.
▪️ Proximity Filter (1 ATR to EMA)
We’ve added another layer of discipline. Signals only fire when price is:
Within 1 ATR of the 10 EMA (if price is above it), or
Within 1 ATR of the 20 EMA (if price is below the 10 EMA)
This ensures you’re not chasing. You’re waiting for tight, controlled pullbacks into dynamic support — exactly where institutions add size, not exit.
⚙️ Fully Customisable:
Toggle visibility of each pattern
Custom colours and transparency for label & background
Adjustable ATR length and multiplier
Change label text if needed (useful for translations or tweaks)
🎯 Ideal Use Case:
Swing trading off the daily chart
Day trading with VWAP/MACD filters (in alternate versions)
Supplementing price action strategies
🔚 Final Word:
This isn’t an “everything scanner.”
It’s a discerning sniper scope for traders who wait patiently for clean trends, tight consolidations, and perfect proximity — then strike.
