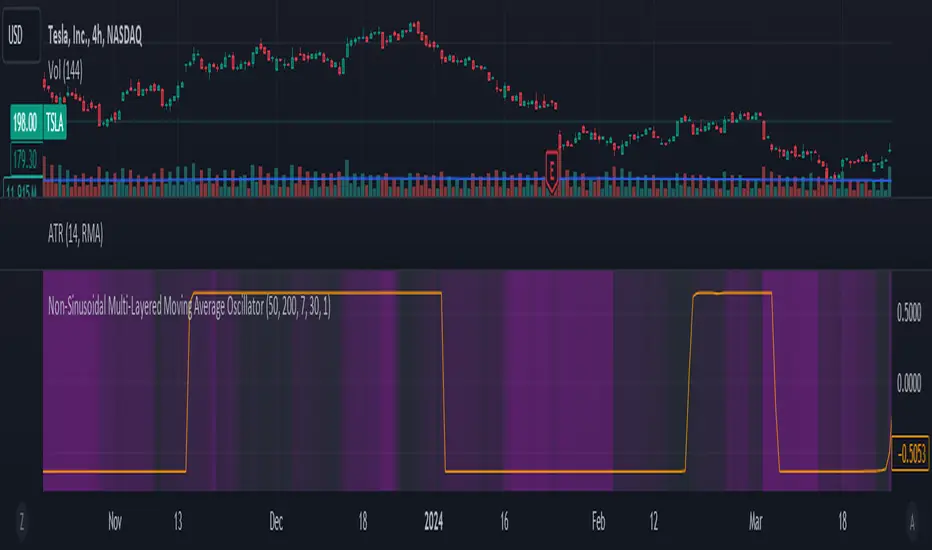
Non-Sinusoidal Multi-Layered Moving Average OscillatorThis indicator utilizes multiple moving averages (MAs) of different lengths their difference and its rate of change to provide a comprehensive view of both short-term and long-term market trends. The output signal is characterized by its non-sinusoidal nature, offering distinct advantages in trend analysis and market forecasting.
Combining the difference between two moving averages with the ROC allows to assess not only the direction and strength of the trend but also the momentum behind it. Transforming these signal in to non-sinusoidal output enhances its utility.
The indicator allows traders to select any one or more of seven moving average options. Larger timeframes (e.g., MA89/MA144) provide a broader identification of the overall trend, helping to understand the general market direction. Smaller timeframes (e.g., MA5/MA8) are more sensitive to price changes and can indicate better entry and exit points, aiding in the identification of retracements and pullbacks. By combining multiple timeframes, traders can get a comprehensive view of the market, enabling more precise and informed trading decisions.
Key Features:
Multiple Moving Averages:
The indicator calculates several exponential moving averages (EMAs) based on different lengths: MA5, MA8, MA13, MA21, MA34, MA55, MA89, and MA144.
These MAs are further smoothed using a secondary exponential moving average, with the smoothing length customizable by the user.
Percentage Differences:
The indicator computes the percentage differences between successive MAs (e.g., (MA5 - MA8) / MA8 * 100). These differences highlight the relative movement of prices over different periods, providing insights into market momentum and trend strength.
Short-term MA differences (e.g., MA5/MA8) are more sensitive to recent price changes, making them useful for detecting quick market movements.
Long-term MA differences (e.g., MA89/MA144) smooth out short-term fluctuations, helping to identify major trends.
Rate of Change (ROC):
The indicator applies the Rate of Change (ROC) to the percentage differences of the MAs. ROC measures the speed at which the percentage differences are changing over time, providing an additional layer of trend analysis.
ROC helps in understanding the acceleration or deceleration of market trends, indicating the strength and potential reversals.
Transformations:
The percentage differences undergo a series of mathematical transformations (either inverse hyperbolic sine transformation or inverse fisher transformation) to refine the signal and enhance its interpretability. These transformations include adjustments to stabilize the values and highlight significant movements.
checkbox allows users to select which mathematical transformations to use.
Non-Sinusoidal Nature:
The output signal of this indicator is non-sinusoidal, characterized by abrupt changes and distinct patterns rather than smooth, wave-like oscillations.
The non-sinusoidal signal provides clearer demarcations of trend changes and is more responsive to sudden market shifts.
This nature reduces the lag typically associated with sinusoidal indicators, allowing for more timely and accurate trading decisions.
Customizable Options:
Users can select which MA pairs to include in the analysis using checkboxes. This flexibility allows the indicator to adapt to different trading strategies, whether focused on short-term movements or long-term trends.
Visual Representation:
The indicator plots the transformed values on a separate panel, making it easy for traders to visualize the trends and potential entry or exit points.
Usage Scenarios:
Short-Term Trading: By focusing on shorter MAs (e.g., MA5/MA8), traders can capture quick market movements and identify short-term trends.
Long-Term Analysis: Utilizing longer MAs (e.g., MA89/MA144) helps in identifying major market trends.
Combination of MAs: The ability to mix different MA lengths provides a balanced view, helping traders make decisions based on both immediate price actions and overall market direction.
Practical Benefits:
Early Signal Detection: The sensitivity of short-term MAs provides early signals for potential trend changes, assisting traders in timely decision-making.
Trend Confirmation: Long-term MAs offer stable trend confirmation, reducing the likelihood of false signals in volatile markets.
Noise Reduction: The mathematical transformations and ROC applied to the percentage differences help in filtering out market noise, focusing on meaningful price movements.
Improved Responsiveness: The non-sinusoidal nature of the signal allows the indicator to react more quickly to market changes, providing more accurate and timely trading signals.
Clearer Trend Demarcations: Non-sinusoidal signals make it easier to identify distinct phases of market trends, aiding in better interpretation and decision-making.
在腳本中搜尋"wave"
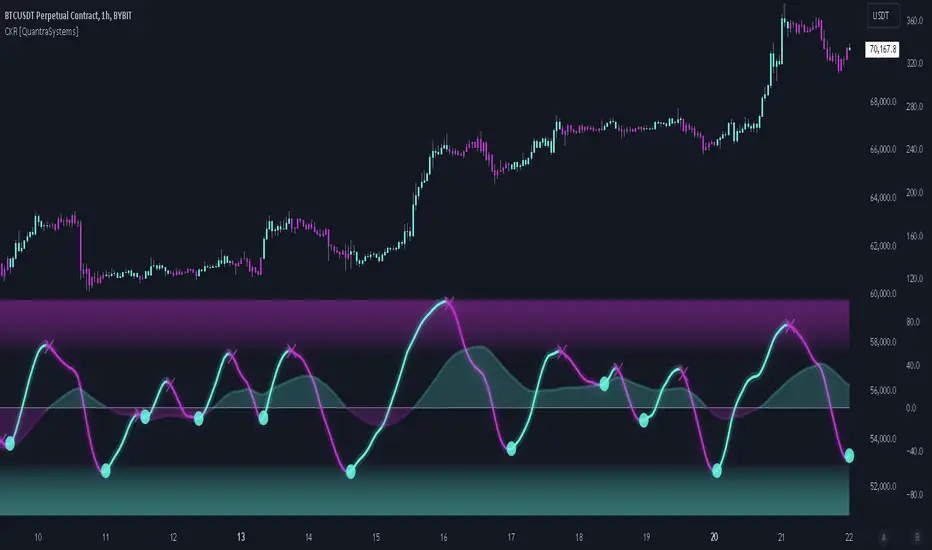
Cosine Kernel Regressions [QuantraSystems]Cosine Kernel Regressions
Introduction
The Cosine Kernel Regressions indicator (CKR) uses mathematical concepts to offer a unique approach to market analysis. This indicator employs Kernel Regressions using bespoke tunable Cosine functions in order to smoothly interpret a variety of market data, providing traders with incredibly clean insights into market trends.
The CKR is particularly useful for traders looking to understand underlying trends without the 'noise' typical in raw price movements. It can serve as a standalone trend analysis tool or be combined with other indicators for more robust trading strategies.
Legend
Fast Trend Signal Line - This is the foreground oscillator, it is colored upon the earliest confirmation of a change in trend direction.
Slow Trend Signal Line - This oscillator is calculated in a similar manner. However, it utilizes a lower frequency within the cosine tuning function, allowing it to capture longer and broader trends in one signal. This allows for tactical trading; the user can trade smaller moves without losing sight of the broader trend.
Case Study
In this case study, the CKR was used alongside the Triple Confirmation Kernel Regression Oscillator (KRO)
Initially, the KRO indicated an oversold condition, which could be interpreted as a signal to enter a long position in anticipation of a price rebound. However, the CKR’s fast trend signal line had not yet confirmed a positive trend direction - suggesting that entering a trade too early and without confirmation could be a mistake.
Waiting for a confirmed positive trend from the CKR proved beneficial for this trade. A few candles after the oversold signal, the CKR's fast trend signal line shifted upwards, indicating a strong upward momentum. This was the optimal entry point suggested by the CKR, occurring after the confirmation of the trend change, which significantly reduced the likelihood of entering during a false recovery or continuation of the downtrend.
This is one of the many uses of the CKR - by timing entries using the fast signal line , traders could avoid unnecessary losses by preventing premature entries.
Methodology
The methodology behind CKR is a multi-layered approach and utilizes many ‘base’ indicators.
Relative Strength Index
Stochastic Oscillator
Bollinger Band Percent
Chande Momentum Oscillator
Commodity Channel Index
Fisher Transform
Volume Zone Oscillator
The calculated output from each indicator is standardized and scaled before being averaged. This prevents any single indicator from overpowering the resulting signal.
// ╔════════════════════════════════╗ //
// ║ Scaling/Range Adjustment ║ //
// ╚════════════════════════════════╝ //
RSI_ReScale (_res ) => ( _res - 50 ) * 2.8
STOCH_ReScale (_stoch ) => ( _stoch - 50 ) * 2
BBPCT_ReScale (_bbpct ) => ( _bbpct - 0.5 ) * 120
CMO_ReScale (_chandeMO ) => ( _chandeMO * 1.15 )
CCI_ReScale (_cci ) => ( _cci / 2 )
FISH_ReScale (_fish1 ) => ( _fish1 * 30 )
VZO_ReScale (_VP, _TV ) => (_VP / _TV) * 110
These outputs are then fed into a customized cosine kernel regression function, which smooths the data, and combines all inputs into a single coherent output.
// ╔════════════════════════════════╗ //
// ║ COSINE KERNEL REGRESSIONS ║ //
// ╚════════════════════════════════╝ //
// Define a function to compute the cosine of an input scaled by a frequency tuner
cosine(x, z) =>
// Where x = source input
// y = function output
// z = frequency tuner
var y = 0.
y := math.cos(z * x)
Y
// Define a kernel that utilizes the cosine function
kernel(x, z) =>
var y = 0.
y := cosine(x, z)
math.abs(x) <= math.pi/(2 * z) ? math.abs(y) : 0. // cos(zx) = 0
// The above restricts the wave to positive values // when x = π / 2z
The tuning of the regression is adjustable, allowing users to fine-tune the sensitivity and responsiveness of the indicator to match specific trading strategies or market conditions. This robust methodology ensures that CKR provides a reliable and adaptable tool for market analysis.
Volume Spread Analysis [TANHEF]Volume Spread Analysis: Understanding Market Intentions through the Interpretation of Volume and Price Movements.
█ Simple Explanation:
The Volume Spread Analysis (VSA) indicator is a comprehensive tool that helps traders identify key market patterns and trends based on volume and spread data. This indicator highlights significant VSA patterns and provides insights into market behavior through color-coded volume/spread bars and identification of bars indicating strength, weakness, and neutrality between buyers and sellers. It also includes powerful volume and spread forecasting capabilities.
█ Laws of Volume Spread Analysis (VSA):
The origin of VSA begins with Richard Wyckoff, a pivotal figure in its development. Wyckoff made significant contributions to trading theory, including the formulation of three basic laws:
The Law of Supply and Demand: This fundamental law states that supply and demand balance each other over time. High demand and low supply lead to rising prices until demand falls to a level where supply can meet it. Conversely, low demand and high supply cause prices to fall until demand increases enough to absorb the excess supply.
The Law of Cause and Effect: This law assumes that a 'cause' will result in an 'effect' proportional to the 'cause'. A strong 'cause' will lead to a strong trend (effect), while a weak 'cause' will lead to a weak trend.
The Law of Effort vs. Result: This law asserts that the result should reflect the effort exerted. In trading terms, a large volume should result in a significant price move (spread). If the spread is small, the volume should also be small. Any deviation from this pattern is considered an anomaly.
█ Volume and Spread Analysis Bars:
Display: Volume and/or spread bars that consist of color coded levels. If both of these are displayed, the number of spread bars can be limited for visual appeal and understanding, with the spread bars scaled to match the volume bars. While automatic calculation of the number of visual bars for auto scaling is possible, it is avoided to prevent the indicator from reloading whenever the number of visual price bars on the chart is adjusted, ensuring uninterrupted analysis. A displayable table (Legend) of bar colors and levels can give context and clarify to each volume/spread bar.
Calculation: Levels are calculated using multipliers applied to moving averages to represent key levels based on historical data: low, normal, high, ultra. This method smooths out short-term fluctuations and focuses on longer-term trends.
Low Level: Indicates reduced volatility and market interest.
Normal Level: Reflects typical market activity and volatility.
High Level: Indicates increased activity and volatility.
Ultra Level: Identifies extreme levels of activity and volatility.
This illustrates the appearance of Volume and Spread bars when scaled and plotted together:
█ Forecasting Capabilities:
Display: Forecasted volume and spread levels using predictive models.
Calculation: Volume and Spread prediction calculations differ as volume is linear and spread is non-linear.
Volume Forecast (Linear Forecasting): Predicts future volume based on current volume rate and bar time till close.
Spread Forecast (Non-Linear Dynamic Forecasting): Predicts future spread using a dynamic multiplier, less near midpoint (consolidation) and more near low or high (trending), reflecting non-linear expansion.
Moving Averages: In forecasting, moving averages utilize forecasted levels instead of actual levels to ensure the correct level is forecasted (low, normal, high, or ultra).
The following compares forecasted volume with actual resulting volume, highlighting the power of early identifying increased volume through forecasted levels:
█ VSA Patterns:
Criteria and descriptions for each VSA pattern are available as tooltips beside them within the indicator’s settings. These tooltips provide explanations of potential developments based on the volume and spread data.
Signs of Strength (🟢): Patterns indicating strong buying pressure and potential market upturns.
Down Thrust
Selling Climax
No Effort → Bearish Result
Bearish Effort → No Result
Inverse Down Thrust
Failed Selling Climax
Bull Outside Reversal
End of Falling Market (Bag Holder)
Pseudo Down Thrust
No Supply
Signs of Weakness (🔴): Patterns indicating strong selling pressure and potential market downturns.
Up Thrust
Buying Climax
No Effort → Bullish Result
Bullish Effort → No Result
Inverse Up Thrust
Failed Buying Climax
Bear Outside Reversal
End of Rising Market (Bag Seller)
Pseudo Up Thrust
No Demand
Neutral Patterns (🔵): Patterns indicating market indecision and potential for continuation or reversal.
Quiet Doji
Balanced Doji
Strong Doji
Quiet Spinning Top
Balanced Spinning Top
Strong Spinning Top
Quiet High Wave
Balanced High Wave
Strong High Wave
Consolidation
Bar Patterns (🟡): Common candlestick patterns that offer insights into market sentiment. These are required in some VSA patterns and can also be displayed independently.
Bull Pin Bar
Bear Pin Bar
Doji
Spinning Top
High Wave
Consolidation
This demonstrates the acronym and descriptive options for displaying bar patterns, with the ability to hover over text to reveal the descriptive text along with what type of pattern:
█ Alerts:
VSA Pattern Alerts: Notifications for identified VSA patterns at bar close.
Volume and Spread Alerts: Alerts for confirmed and forecasted volume/spread levels (Low, High, Ultra).
Forecasted Volume and Spread Alerts: Alerts for forecasted volume/spread levels (High, Ultra) include a minimum percent time elapsed input to reduce false early signals by ensuring sufficient bar time has passed.
█ Inputs and Settings:
Display Volume and/or Spread: Choose between displaying volume bars, spread bars, or both with different lookback periods.
Indicator Bar Color: Select color schemes for bars (Normal, Detail, Levels).
Indicator Moving Average Color: Select schemes for bars (Fill, Lines, None).
Price Bar Colors: Options to color price bars based on VSA patterns and volume levels.
Legend: Display a table of bar colors and levels for context and clarity of volume/spread bars.
Forecast: Configure forecast display and prediction details for volume and spread.
Average Multipliers: Define multipliers for different levels (Low, High, Ultra) to refine the analysis.
Moving Average: Set volume and spread moving average settings.
VSA: Select the VSA patterns to be calculated and displayed (Strength, Weakness, Neutral).
Bar Patterns: Criteria for bar patterns used in VSA (Doji, Bull Pin Bar, Bear Pin Bar, Spinning Top, Consolidation, High Wave).
Colors: Set exact colors used for indicator bars, indicator moving averages, and price bars.
More Display Options: Specify how VSA pattern text is displayed (Acronym, Descriptive), positioning, and sizes.
Alerts: Configure alerts for VSA patterns, volume, and spread levels, including forecasted levels.
█ Usage:
The Volume Spread Analysis indicator is a helpful tool for leveraging volume spread analysis to make informed trading decisions. It offers comprehensive visual and textual cues on the chart, making it easier to identify market conditions, potential reversals, and continuations. Whether analyzing historical data or forecasting future trends, this indicator provides insights into the underlying factors driving market movements.

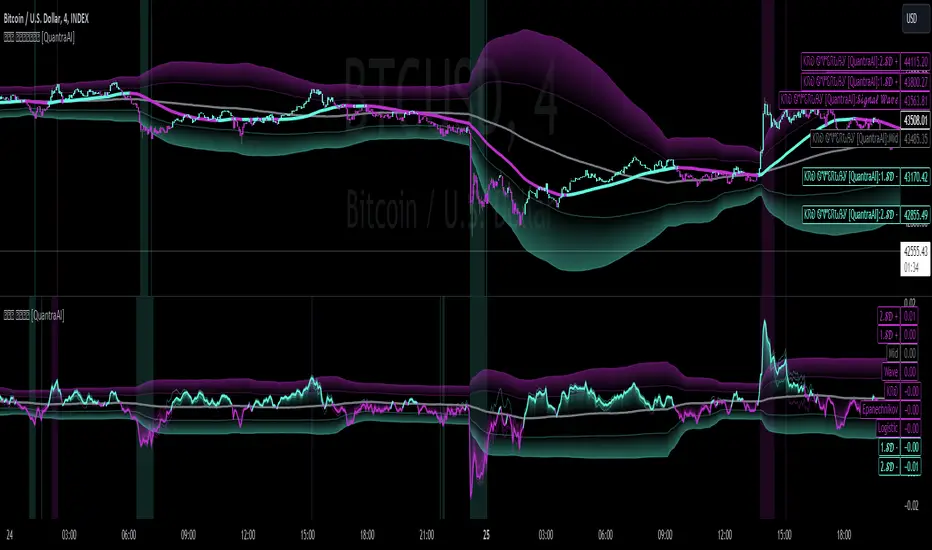
Weighted Moving Range with Trend Signals (WMR-TS)Weighted Moving Range with Trend Signals (WMR-TS)
Technical analysis involves analyzing statistical trends from trading activity , such as price movement and volume, to make trading decisions. Technical indicators are mathematical calculations based on the price, volume, or open interest of a security or contract. They are used by traders to analyze price movements and predict future market behavior. The WMR-TS indicator combines weighted moving averages and range calculations to identify key trading levels and generate buy/sell signals. It dynamically adjusts to market conditions, offering traders insights into potential support, resistance, and trend reversal points. Key levels are color-coded for quick interpretation. It utilizes weighted moving averages (WMA) and range calculations to determine these levels, making it a robust tool for both trending and ranging markets.
SUMMARY
Parameters :
WMA Length : Determines the length for the primary weighted moving average.
Highest High Length : Sets the period for calculating the highest high.
Lowest Low Length : Sets the period for calculating the lowest low.
Range Corrector : Adjusts the range calculation slightly for fine-tuning.
Top Level : Multiplier for determining the top level from the calculated range.
Bottom Level : Multiplier for determining the bottom level from the calculated range.
Levels Visibility : Sets how many recent bars will display the levels.
Trading Zones :
Short Area : Highlighted zone indicating potential shorting opportunities.
Long Area : Highlighted zone indicating potential buying opportunities.
The Levels :
Wave (Yellow): Midpoint of the calculated range, adjusted by WMA.
Top Level (Red): Calculated upper boundary of the trading range.
Sell Level (Pink): Intermediate sell level.
Resistance Level (Magenta): Immediate resistance level.
Support Level (Cyan): Immediate support level.
Buy Level (Light Green): Intermediate buy level.
Bottom Level (Dark Green): Calculated lower boundary of the trading range.
Interpreting the Signals :
Hammer Signal : Red circles above bars indicate potential sell signals.
Rocket Signal : Green circles below bars indicate potential buy signals.
KEY CONCEPTS
Highest High and Lowest Low :
These values represent the highest high ( HH ) and lowest low ( LL ) over a specified number of periods.
Support Level :
This is the lower boundary of the trading range. It is a price level where demand is strong enough to prevent the price from falling further. As the price approaches the support level, it is likely to bounce back up.
Resistance Level :
This is the upper boundary of the trading range. It is a price level where supply is strong enough to prevent the price from rising further. As the price approaches the resistance level, it is likely to pull back down.
THE USE OF MULTIPLIERS :
The script uses several multipliers to adjust and fine-tune the calculated support and resistance levels, as well as to control the range and sensitivity of these levels. Here is a detailed explanation of these multipliers and their purpose:
Range Corrector : This multiplier adjusts the calculated high ( H ) and low ( L ) levels, adding flexibility to how these levels are positioned relative to the highest high and lowest low. It ranges from -1 to 1 , with a default value of 0 . The use of positive values increase the range, making the calculated levels further apart. Thus, using negative values decrease the range, bringing the calculated levels closer together.
Top Level : This multiplier adjusts the distance of the top level from the calculated high H ) level. It fluctuates from 0 to 2 , with a default value of 0.382 . Higher values will push the top level further above the high level, while lower values will bring it closer.
Bottom Level : This multiplier adjusts the distance of the bottom support level from the calculated low support level. Ranging from 0 to 2, with a default value of 0.214, the higher values will push the bottom level further below the low level, while lower values will bring it closer.
The script plots the support and resistance levels on the chart, allowing traders to visualize the trading range. Color-coded zones are used to indicate areas where buying or selling opportunities may arise based on the current price relative to the trading range. A trading range refers to the area between a price's support and resistance levels over a specific period of time. Within this range, the price of the security fluctuates up and down but does not break out above the resistance or below the support. Support and resistance levels to make trading decisions. Buying near the support level and selling near the resistance level is a common strategy. When the price moves above the resistance level, it is called a breakout . A breakout often indicates that the price may start a new upward trend . Conversely, when the price moves below the support level, it is called a breakdown . A breakdown often indicates that the price may start a new downward trend . By understanding and utilizing trading ranges, traders can make more informed decisions, optimize their trading strategies, and manage risk more effectively.
Understanding Moving Averages
A moving average (MA) is a widely used technical indicator that helps smooth out price data by creating a constantly updated average price. The main purpose of using a moving average is to identify the direction of the trend and to reduce the "noise" of random price fluctuations. The Weighted Moving Average ( WMA ) assigns different weights to each period, with more recent periods typically given more weight. A 10-day WMA might give the most recent day a weight of 10, the second most recent day a weight of 9, and so on. It is useful for traders who want to emphasize recent price data more than older data. When the price is above the moving average, it suggests an Bullish trend . A Bearish Trend is expected to take place when the price is below the moving average. Understanding the price reactions around these levels can be used to make trading decisions.
APPLYING CONCEPTS
Support and Resistance Calculations in the Script :
The script calculates dynamic support and resistance levels using weighted moving averages ( WMA s) and the highest high and lowest low over specified periods. Buy ( Rocket ) and sell ( Hammer ) signals are generated based on the crossing of the price with calculated top and bottom levels.These signals help traders identify potential entry and exit points within the trading range .
Weighted Moving Average (WMA) Application in the Script
This script calculates a special trendWMA using the close price that helps in creating a more dynamic moving average that considers both high and low price actions. This modified WMA is used in conjunction with highest high and lowest low values over specified periods to calculate dynamic support and resistance levels.
Explanation of the Levels in the Script
By understanding these levels, traders can make more informed decisions about where to enter and exit trades, manage risk, and anticipate potential market movements. The script incorporates several key levels levels that traders can use to better anticipate price movements and make more informed trading decisions. Leveraging the principles of Fibonacci retracement ratios ( 23.6%, 38.2%, 50%, 61.8%, and 100% ) to identify key support and resistance zones can also serve for gauging the overall market sentiment.
Top Level and Sell Leve l: Used to identify potential resistance zones where the price may reverse or pause.
Support Level and Buy Level : Used to identify potential support zones where the price may bounce.
Upper and Lower Pivot Values : Serve as intermediate levels for possible price retracements or extensions within the trading range.
Wave Level : Indicates the central trend direction, which can be useful for gauging the overall market sentiment.
Alerts are a crucial part of the script as they notify traders of potential buy and sell signals based on predefined conditions. There are two main alerts: one for a " Hammer " signal (sell condition) and one for a " Rocket " signal (buy condition).
Adjust the input parameters to fit your trading style and the specific asset being analyzed. Shorter lengths may be more responsive to price changes but can produce more false signals , while longer lengths provide smoother signals but may lag . Always backtest the indicator on historical data to understand its behavior and performance. Also remember that different markets may require different parameter settings for optimal performance.
Keep in mind that by nature like all moving averages, WMAs lag behind price action. This means that signals may be delayed. The indicator performs differently in various market conditions. Always consider the overall market context when interpreting signals.
Adjusting parameters like the range corrector and visibility can help tailor the indicator to specific market conditions or trading strategies, improving its effectiveness. The script uses the calculated levels to plot lines and fill zones on the chart, helping traders visualize potential support, resistance, and trend reversal points. The use of multipliers allows for dynamic adjustment of these levels, making the indicator flexible and adaptable to different market conditions.
I think traders can make more informed decisions about where to enter and exit trades, manage risk, and anticipate potential market movements following this code. Stay safe and always remember that market is always changing. Use this tool if you want, please stay informed and plan safe trades,
D.

MACD 4C with DivergenceMACD 4C Indicator with Divergence
This indicator, named MACD 4C, enhances the traditional MACD (Moving Average Convergence Divergence) by providing a visually intuitive representation with four distinct colors for the histogram bars. It offers a clear interpretation of market momentum and potential trend reversals.
Key Features:
Customizable Parameters: Users can adjust the fast and slow moving average periods along with the signal smoothing parameter to tailor the indicator to their preferred trading style and market conditions.
Four-color Histogram: The histogram bars are color-coded for easy interpretation. Lime and green bars indicate increasing bullish momentum, while maroon and red bars signify increasing bearish momentum.
Bullish and Bearish Divergence Detection: The indicator identifies bullish and bearish divergences between the MACD histogram and price action. Bullish divergence occurs when the price makes a lower low while the MACD histogram forms a higher low, indicating potential bullish reversal. Conversely, bearish divergence occurs when the price makes a higher high while the MACD histogram forms a lower high, suggesting a potential bearish reversal.
How to Use:
Trend Confirmation: Monitor the color of the histogram bars. A series of green (or lime) bars suggests a strengthening bullish trend, while a series of red (or maroon) bars indicates a strengthening bearish trend.
Divergence Identification: Watch for divergences between the MACD histogram and price action. Bullish divergence may signal a potential bullish reversal, while bearish divergence may indicate a potential bearish reversal. These signals can be used in conjunction with other technical analysis tools to confirm trade entries and exits.
The MACD 4C indicator was developed by user vkno422 You can find the original author and their work on their TradingView profile: www.tradingview.com

Hurst Future Lines of Demarcation StrategyJ. M. Hurst introduced a concept in technical analysis known as the Future Line of Demarcation (FLD), which serves as a forward-looking tool by incorporating a simple yet profound line into future projections on a financial chart. Specifically, the FLD is constructed by offsetting the price half a cycle ahead into the future on the time axis, relative to the Hurst Cycle of interest. For instance, in the context of a 40 Day Cycle, the FLD would be represented by shifting the current price data 20 days forward on the chart, offering an idea of future price movement anticipations.
The utility of FLDs extends into three critical areas of insight, which form the backbone of the FLD Trading Strategy:
A price crossing the FLD signifies the confirmation of either a peak or trough formation, indicating pivotal moments in price action.
Such crossings also help determine precise price targets for the upcoming peak or trough, aligned with the cycle of examination.
Additionally, the occurrence of a peak in the FLD itself signals a probable zone where the price might experience a trough, helping to anticipate of future price movements.
These insights by Hurst in his "Cycles Trading Course" during the 1970s, are instrumental for traders aiming to determine entry and exit points, and to forecast potential price movements within the market.
To use the FLD Trading Strategy, for example when focusing on the 40 Day Cycle, a trader should primarily concentrate on the interplay between three Hurst Cycles:
The 20 Day FLD (Signal) - Half the length of the Trade Cycle
The 40 Day FLD (Trade) - The Cycle you want to trade
The 80 Day FLD (Trend) - Twice the length of the Trade Cycle
Traders can gauge trend or consolidation by watching for two critical patterns:
Cascading patterns, characterized by several FLDs running parallel with a consistent separation, typically emerge during pronounced market trends, indicating strong directional momentum.
Consolidation patterns, on the other hand, occur when multiple FLDs intersect and navigate within the same price bandwidth, often reversing direction to traverse this range multiple times. This tangled scenario results in the formation of Pause Zones, areas where price momentum is likely to temporarily stall or where the emergence of a significant trend might be delayed.
This simple FLD indicator provides 3 FLDs with optional source input and smoothing, A-through-H FLD interaction background, adjustable “Close the Trade” triggers, and a simple strategy for backtesting it all.
The A-through-H FLD interactions are a framework designed to classify the different types of price movements as they intersect with or diverge from the Future Line of Demarcation (FLD). Each interaction (designated A through H by color) represents a specific phase or characteristic within the cycle, and understanding these can help traders anticipate future price movements and make informed decisions.
The adjustable “Close the Trade” triggers are for setting the crossover/under that determines the trade exits. The options include: Price, Signal FLD, Trade FLD, or Trend FLD. For example, a trader may want to exit trades only when price finally crosses the Trade FLD line.
Shoutouts & Credits for all the raw code, helpful information, ideas & collaboration, conversations together, introductions, indicator feedback, and genuine/selfless help:
🏆 @TerryPascoe
🏅 @Hpotter
👏 @parisboy

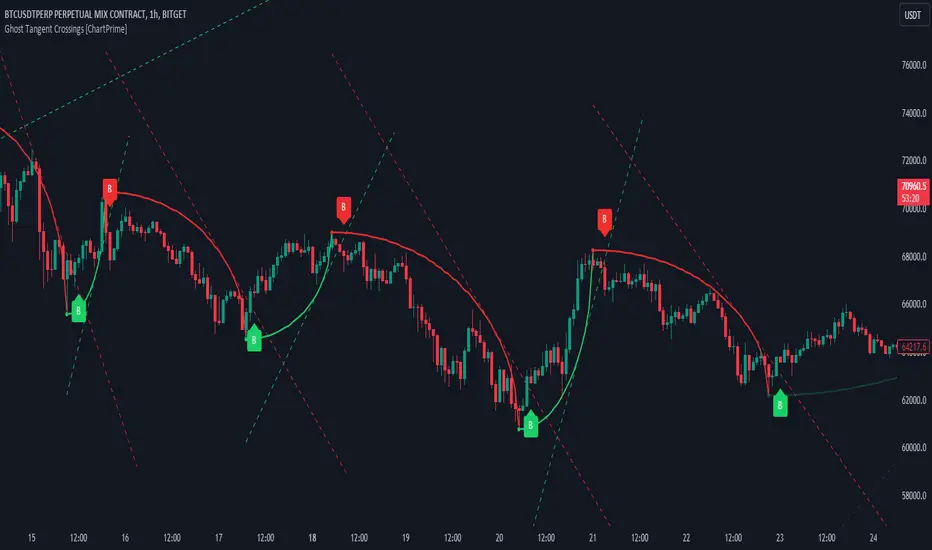
Ghost Tangent Crossings [ChartPrime]Ghost Tangent Crossings (ChartPrime) is a revolutionary way to visualize pivot points and zig-zag patterns that utilizes ellipses. This indicator makes sure that each pivot is plotted from high to low, ensuring a correct zig-zag wave pattern. Before a zig-zag is confirmed Ghost Tangent Crossings (ChartPrime) plots an estimate of the next valid move allowing you to plan well ahead of time. Once it is confirmed, the indicator will fill in the plot with a solid color and print a break label.
Unlike other zig-zag or pivot point indicators, Ghost Tangent Crossings (ChartPrime) only has a pivot lookforward input. This is because the lookback is automatically adjusted based on the last known zig-zag. This allows the indicator to dynamically look for the most recent valid market movement. The equipoint is calculated as the point along the ellipse with an equal change in price on either side. From this point we plot a line with the slope at that location and when the price breaks this level a break label is plotted. Alternatively you can plot this point as a horizontal line. This area works as support and resistance for the market as its the point where the balance in movement is found. We feel that this is a simple and elegant solution to connected zig-zag patterns that utilizes a novel method of visualization that many traders will find useful. With its simple controls and intuitive style, we believe that Ghost Tangent Crossings (ChartPrime) will find a home on most traders charts.
To use Ghost Tangent Crossings (ChartPrime) simply add it to your chart and adjust the lookforward to your taste. From there you can adjust the color of the zig-zags and enable or disable any of the visual features. We have included both wick and body pivot types to accommodate most trading style. From there, you are all done and ready to trade!
Enjoy
ZigZag Library [TradingFinder]🔵 Introduction
The "Zig Zag" indicator is an analytical tool that emerges from pricing changes. Essentially, it connects consecutive high and low points in an oscillatory manner. This method helps decipher price changes and can also be useful in identifying traditional patterns.
By sifting through partial price changes, "Zig Zag" can effectively pinpoint price fluctuations within defined time intervals.
🔵 Key Features
1. Drawing the Zig Zag based on Pivot points :
The algorithm is based on pivots that operate consecutively and alternately (switch between high and low swing). In this way, zigzag lines are connected from a swing high to a swing low and from a swing low to a swing high.
Also, with a very low probability, it is possible to have both low pivots and high pivots in one candle. In these cases, the algorithm tries to make the best decision to make the most suitable choice.
You can control what period these decisions are based on through the "PiPe" parameter.
2.Naming and labeling each pivot based on its position as "Higher High" (HH), "Lower Low" (LL), "Higher Low" (HL), and "Lower High" (LH).
Additionally, classic patterns such as HH, LH, LL, and HL can be recognized. All traders analyzing financial markets using classic patterns and Elliot Waves can benefit from the "zigzag" indicator to facilitate their analysis.
" HH ": When the price is higher than the previous peak (Higher High).
" HL ": When the price is higher than the previous low (Higher Low).
" LH ": When the price is lower than the previous peak (Lower High).
" LL ": When the price is lower than the previous low (Lower Low).
🔵 How to Use
First, you can add the library to your code as shown in the example below.
import TFlab/ZigZagLibrary_TradingFinder/1 as ZZ
Function "ZigZag" Parameters :
🟣 Logical Parameters
1. HIGH : You should place the "high" value here. High is a float variable.
2. LOW : You should place the "low" value here. Low is a float variable.
3. BAR_INDEX : You should place the "bar_index" value here. Bar_index is an integer variable.
4. PiPe : The desired pivot period for plotting Zig Zag is placed in this parameter. For example, if you intend to draw a Zig Zag with a Swing Period of 5, you should input 5.
PiPe is an integer variable.
Important :
Apart from the "PiPe" indicator, which is part of the customization capabilities of this indicator, you can create a multi-time frame mode for the indicator using 3 parameters "High", "Low" and "BAR_INDEX". In this way, instead of the data of the current time frame, use the data of other time frames.
Note that it is better to use the current time frame data, because using the multi-time frame mode is associated with challenges that may cause bugs in your code.
🟣 Setting Parameters
5. SHOW_LINE : It's a boolean variable. When true, the Zig Zag line is displayed, and when false, the Zig Zag line display is disabled.
6. STYLE_LINE : In this variable, you can determine the style of the Zig Zag line. You can input one of the 3 options: line.style_solid, line.style_dotted, line.style_dashed. STYLE_LINE is a constant string variable.
7. COLOR_LINE : This variable takes the input of the line color.
8. WIDTH_LINE : The input for this variable is a number from 1 to 3, which is used to adjust the thickness of the line that draws the Zig Zag. WIDTH_LINE is an integer variable.
9. SHOW_LABEL : It's a boolean variable. When true, labels are displayed, and when false, label display is disabled.
10. COLOR_LABEL : The color of the labels is set in this variable.
11. SIZE_LABEL : The size of the labels is set in this variable. You should input one of the following options: size.auto, size.tiny, size.small, size.normal, size.large, size.huge.
12. Show_Support : It's a boolean variable that, when true, plots the last support line, and when false, disables its plotting.
13. Show_Resistance : It's a boolean variable that, when true, plots the last resistance line, and when false, disables its plotting.
Suggestion :
You can use the following code snippet to import Zig Zag into your code for time efficiency.
//import Library
import TFlab/ZigZagLibrary_TradingFinder/1 as ZZ
// Input and Setting
// Zig Zag Line
ShZ = input.bool(true , 'Show Zig Zag Line', group = 'Zig Zag') //Show Zig Zag
PPZ = input.int(5 ,'Pivot Period Zig Zag Line' , group = 'Zig Zag') //Pivot Period Zig Zag
ZLS = input.string(line.style_dashed , 'Zig Zag Line Style' , options = , group = 'Zig Zag' )
//Zig Zag Line Style
ZLC = input.color(color.rgb(0, 0, 0) , 'Zig Zag Line Color' , group = 'Zig Zag') //Zig Zag Line Color
ZLW = input.int(1 , 'Zig Zag Line Width' , group = 'Zig Zag')//Zig Zag Line Width
// Label
ShL = input.bool(true , 'Label', group = 'Label') //Show Label
LC = input.color(color.rgb(0, 0, 0) , 'Label Color' , group = 'Label')//Label Color
LS = input.string(size.tiny , 'Label size' , options = , group = 'Label' )//Label size
Show_Support= input.bool(false, 'Show Last Support',
tooltip = 'Last Support' , group = 'Support and Resistance')
Show_Resistance = input.bool(false, 'Show Last Resistance',
tooltip = 'Last Resistance' , group = 'Support and Resistance')
//Call Function
ZZ.ZigZag(high ,low ,bar_index ,PPZ , ShZ ,ZLS , ZLC, ZLW ,ShL , LC , LS , Show_Support , Show_Resistance )

BTC Purchasing Power 2009-20XX! Hello, today I'm going to show you something that shifts our perspective on Bitcoin's value, not just in nominal terms, but adjusted for the real buying power over the years. This Pine Script TAS developed for TradingView does exactly that by taking into account inflation rates from 2009 to the present.
As you know, inflation erodes the purchasing power of money. That $100 in 2009 does not buy you the same amount in goods or services today. The same concept applies to Bitcoin. While we often look at its price in terms of dollars, pounds, or euros, it's crucial to understand what that price really means in terms of purchasing power.
What this script does is adjust the price of Bitcoin for cumulative inflation since 2009, allowing us to see not just how the nominal price has changed, but how its value as a means of purchasing goods and services has evolved.
For example, if we see Bitcoin's price at $60,000 today, that number might seem high compared to its early years. However, when we adjust this price for inflation, we might find that in terms of 2009's purchasing power, the effective price might be somewhat lower. This adjusted price gives us a more accurate reflection of Bitcoin's true value over time.
This script plots two lines on the chart:
The Original BTC Price: This is the unadjusted price of Bitcoin as we typically see it.
BTC Purchasing Power: This line shows Bitcoin's price adjusted for inflation, reflecting how many goods or services Bitcoin could buy at that point in time compared to 2009.
By comparing these lines, we can observe periods where Bitcoin's purchasing power significantly increased, even if the nominal price was not at its peak. This can help us identify moments when Bitcoin was undervalued or overvalued in real terms.
This analysis is crucial for long-term investors and traders who want to understand Bitcoin's value beyond the surface-level price movements. It helps us appreciate Bitcoin's potential as a store of value, especially in contexts where traditional currencies are losing purchasing power due to inflation.
Remember, investing is not just about riding price waves; it's about understanding the underlying value. And that's precisely what this script helps us to uncover

ATH finder showing passed daysATH Finder Showing Passed Days Indicator
Introducing the "ATH Finder Showing Passed Days" – a cutting-edge TradingView indicator meticulously designed for traders and investors focused on capturing and analyzing the all-time highs (ATHs) of financial markets. Whether you're navigating the volatile waves of cryptocurrencies, the dynamic shifts of the stock market, forex, or any other trading instrument, this indicator is your essential tool for highlighting and understanding ATHs with precision.
Core Features:
Dynamic ATH Tracking: Seamlessly identifies and marks the most recent ATHs in any given market, ensuring that you are always up-to-date with significant price levels that matter the most.
Days Since ATH Visualization: Innovatively displays the number of days that have passed since the last ATH was reached. This powerful feature provides crucial insights into market sentiment, offering a clear view of how long the current price has been consolidating or retreating from its peak.
Visual Enhancements: Features a striking yellow arrow precisely at the ATH point, drawing immediate attention to pivotal market moments without cluttering your chart.
Strategic Placement of Information: Incorporates a non-intrusive label placed in the top right corner of your chart, summarizing the ATH value alongside the days elapsed since its occurrence. This approach ensures your chart remains clean and organized, allowing for other analyses to be conducted without distraction.
Customizable to Fit Your Needs: While it's ready to use out of the box, the indicator provides flexibility for customization, making it adaptable to various timeframes and individual trading strategies.
Benefits for Traders and Investors:
Provides a historical context to current price levels, helping to gauge the strength and potential of market trends.
Aids in identifying potential resistance levels, offering strategic insights for entry and exit points.
Enhances market analysis with a clear, visual representation of significant price milestones and their temporal context.
Easy Setup:
To integrate the "ATH Finder Showing Passed Days" indicator into your trading strategy, simply add it from the TradingView Indicators menu to your chart. Customize according to your preferences and let the indicator illuminate your path to more informed decision-making.
Why Choose the ATH Finder Showing Passed Days?
In the quest for market excellence, understanding the nuances of price movements and their historical significance is paramount. The "ATH Finder Showing Passed Days" indicator not only highlights where and when the market reached its zenith but also contextualizes these moments within the broader tapestry of trading days. Equip yourself with the insight to discern the momentum and potential retracements, elevating your trading to new heights.

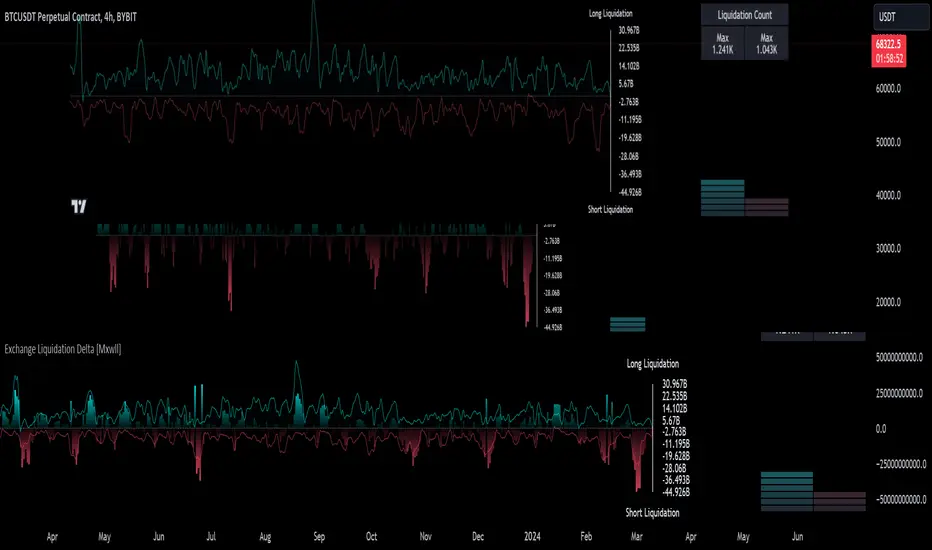
Genuine Liquidation Delta [Mxwll] - No EstimatesTHANK YOU TradingView for allowing us to upload custom data!!!
As a result, Mxwll Capital is providing an indicator that shows REAL liquidation delta for over 100 cryptocurrencies sourced directly from a popular crypto exchange!
Features
Crypto exchange sourced liquidation delta
Crypto exchange sourced long liquidation daily count
Crypto exchange sourced short liquidation daily count
All provided data extends back 2 years!!
Various aesthetic components to illustrate data
Liquidation delta data (sourced from a popular exchange) is provided for:
1000shib
aave
ada
algo
alice
arb
audio
alpha
ankr
ape
apt
atom
avax
axs
bal
band
bat
bch
bel
blz
blur
bnb
bnx
btc
chr
chz
comp
coti
crv
ctk
dash
defi
doge
dot
dydx
edu
egld
enj
ens
eos
etc
eth
fil
flm
ftm
fxs
gala
gmx
grt
hbar
hnt
icx
id
inj
iost
iota
joe
kava
knc
ksm
ldo
lina
link
lit
lrc
ltc
mana
mask
matic
mkr
near
neo
ocean
omg
one
ont
op
people
qtum
reef
ren
rndr
rose
rlc
rsr
rune
rvn
sand
sfp
skl
snx
sol
stmx
storj
sui
sushi
sxp
theta
tomo
trb
trx
unfi
uni
vet
waves
xem
xlm
xmr
xrp
xtz
yfi
zec
zen
zil
zrx
How-To
The image above shows the indicator with default settings.
The image above shows the start point of our data!
Over 2-years of data, allowing for plentiful analysis!
The image above explains the primary plot.
Filled blue columns reflect liquidation delta exceeding the long side. When the liquidation delta plot is aqua and exceeds 0 to the upside, longs were liquidated more than shorts for the
day.
Filled red columns reflect liquidation delta exceeding the short side. When the liquidation delta plot is red and exceeds 0 to the downside, shorts were liquidated more than longs for the day.
The image above explains the solid line (polyline) plot and its intentions!
Filled, solid, blue line reflects the total number of long liquidation events for the period.
Filled, solid, red line reflects the total number of short liquidation events for the period.
Keep in mind that the total number of liquidation events is normalized to plot alongside the total liquidation delta for the day. So, there aren't "millions" of liquidation events taking place, the total liquidation count for the long and short side is simply normalized to fit atop total liquidation delta.
The image above explains the liquidation count meter the indicator provides!
The left (blue columns) reflect the intensity of long liquidation events for the day. The right (red columns) reflect the intensity of short liquidation events for the day.
The "Max" numbers at the top show the maximum number of long liquidation events, or short liquidation events, for their respective columns.
Therefore, if the number of long liquidation events were "1.241k", as stated for this cryptocurrency in the table, the blue meter would be full. Similar logic applies to the red meter.
Once more, THANK YOU @TradingView and @PineCoders for allowing us to upload custom data! This project wouldn't be possible without it!
Alligator + Fractals + Divergent & Squat Bars + Signal AlertsThe indicator includes Williams Alligator, Williams Fractals, Divergent Bars, Market Facilitation Index, Highest and Lowest Bars, maximum and minimum peak of Awesome Oscillator, and signal alerts based on Bill Williams' Profitunity strategy.
MFI and Awesome Oscillator
According to the Market Facilitation Index Oscillator, the Squat bar is colored blue, all other bars are colored according to the Awesome Oscillator color, except for the Fake bars, colored with a lighter AO color. In the indicator settings, you can enable the display of "Green" bars (in the "Green Bars > Show" field). In the indicator style settings, you can disable changing the color of bars in accordance with the AO color (in the "AO bars" field), including changing the color for Fake bars (in the "Fake AO bars" field).
MFI is calculated using the formula: (high - low) / volume.
A Squat bar means that, compared to the previous bar, its MFI has decreased and at the same time its volume has increased, i.e. MFI < previous bar and volume > previous bar. A sign of a possible price reversal, so this is a particularly important signal.
A Fake bar is the opposite of a Squat bar and means that, compared to the previous bar, its MFI has increased and at the same time its volume has decreased, i.e. MFI > previous bar and volume < previous bar.
A "Green" bar means that, compared to the previous bar, its MFI has increased and at the same time its volume has increased, i.e. MFI > previous bar and volume > previous bar. A sign of trend continuation. But a more significant trend confirmation or warning of a possible reversal is the Awesome Oscillator, which measures market momentum by calculating the difference between the 5 Period and 34 Period Simple Moving Averages (SMA 5 - SMA 34) based on the midpoints of the bars (hl2). Therefore, by default, the "Green" bars and their opposite "Fade" bars are colored according to the color of the Awesome Oscillator.
According to Bill Williams' Profitunity strategy, using the Awesome Oscillator, the third Elliott wave is determined by the maximum peak of AO in the range from 100 to 140 bars. The presence of divergence between the maximum AO peak and the subsequent lower AO peak in this interval also warns of a possible correction, especially if the AO crosses the zero line between these AO peaks. Therefore, the chart additionally displays the prices of the highest and lowest bars, as well as the maximum or minimum peak of AO in the interval of 140 bars from the last bar. In the indicator settings, you can hide labels, lines, change the number of bars and any parameters for the AO indicator - method (SMA, Smoothed SMA, EMA and others), length, source (open, high, low, close, hl2 and others).
Bullish Divergent bar
🟢 A buy signal (Long) is a Bullish Divergent bar with a green circle displayed above it if such a bar simultaneously meets all of the following conditions:
The high of the bar is below all lines of the Alligator indicator.
The closing price of the bar is above its middle, i.e. close > (high + low) / 2.
The low of the bar is below the low of 2 previous bars or below the low of one previous bar, and the low of the second previous bar is a lower fractal (▼). By default, Divergent bars are not displayed, the low of which is lower than the low of only one previous bar and the low of the 2nd previous bar is not a lower fractal (▼), but you can enable the display of any Divergent bars in the indicator settings (by setting the value "no" in the " field Divergent Bars > Filtration").
The following conditions strengthen the Bullish Divergent bar signal:
The opening price of the bar, as well as the closing price, is higher than its middle, i.e. Open > (high + low) / 2.
The high of the bar is below all lines of the open Alligator indicator, i.e. the green line (Lips) is below the red line (Teeth) and the red line is below the blue line (Jaw). In this case, the color of the circle above the Bullish Divergent bar is dark green.
Squat Divergent bar.
The bar following the Bullish Divergent bar corresponds to the green color of the Awesome Oscillator.
Divergence on Awesome Oscillator.
Formation of the lower fractal (▼), in which the low of the Divergent bar is the peak of the fractal.
Bearish Divergent bar
🔴 A signal to sell (Short) is a Bearish Divergent bar under which a red circle is displayed if such a bar simultaneously meets all the following conditions:
The low of the bar is above all lines of the Alligator indicator.
The closing price of the bar is below its middle, i.e. close < (high + low) / 2.
The high of the bar is higher than the high of 2 previous bars or higher than the high of one previous bar, and the high of the second previous bar is an upper fractal (▲). By default, Divergent bars are not displayed, the high of which is higher than the high of only one previous bar and the high of the 2nd previous bar is not an upper fractal (▲), but you can enable the display of any Divergent bars in the indicator settings (by setting the value "no" in the " field Divergent Bars > Filtration").
The following conditions strengthen the Bearish Divergent bar signal:
The opening price of the bar, as well as the closing price, is below its middle, i.e. open < (high + low) / 2.
The low of the bar is above all lines of the open Alligator indicator, i.e. the green line (Lips) is above the red line (Teeth) and the red line is above the blue line (Jaw). In this case, the color of the circle under the Bearish Divergent bar is dark red.
Squat Divergent bar.
The bar following the Bearish Divergent bar corresponds to the red color of the Awesome Oscillator.
Divergence on Awesome Oscillator.
Formation of the upper fractal (▲), in which the high of the Divergent bar is the peak of the fractal.
Alligator lines crossing
Bars crossing the green line (Lips) of the open Alligator indicator is the first warning of a possible correction (price rollback) if one of the following conditions is met:
If the bar closed below the Lips line, which is above the Teeth line, and the Teeth line is above the Jaw line, while the closing price of the previous bar is above the Lips line.
If the bar closed above the Lips line, which is below the Teeth line, and the Teeth line is below the Jaw line, while the closing price of the previous bar is below the Lips line.
The intersection of all open Alligator lines by bars is a sign of a deep correction and a warning of a possible trend change.
Frequent intersection of Alligator lines with each other is a sign of a sideways trend (flat).
Signal Alerts
To receive notifications about signals when creating an alert, you must select the condition "Any alert() function is call", in which case notifications will arrive in the following format:
D — timeframe, for example: D, 4H, 15m.
🟢 BDB⎾ - a signal for a Bullish Divergent bar to buy (Long), triggers once after the bar closes and includes additional signals:
/// — if Alligator is open.
⏉ — if the opening price of the bar, as well as the closing price, is above its middle.
+ Squat 🔷 - Squat bar or + Green ↑ - "Green" bar or + Fake ↓ - Fake bar.
+ AO 🟩 - if after the Divergent bar closes, the oscillator color change for the next bar corresponds the green color of the Awesome Oscillator. ┴/┬ — AO above/below the zero line. ∇ — if there is divergence on AO in the interval of 140 bars from the last bar.
🔴 BDB⎿ - a signal for a Bearish Divergent bar to sell (Short), triggers once after the bar closes and includes additional signals:
/// — if Alligator is open.
⏊ — if the opening price of the bar, as well as the closing price, is below its middle.
+ Squat 🔷 - Squat bar or + Green ↑ - "Green" bar or + Fake ↓ - Fake bar.
+ AO 🟥 - if after the Divergent bar closes, the oscillator color change for the next bar corresponds to the red color of the Awesome Oscillator. ┴/┬ — AO above/below the zero line. ∇ — if there is divergence on AO in the interval of 140 bars from the last bar.
Alert for bars crossing the green line (Lips) of the open Alligator indicator (can be disabled in the indicator settings in the "Alligator > Enable crossing lips alerts" field):
🔴 Crossing Lips ↓ - if the bar closed below the Lips line, which is above than the other lines, while the closing price of the previous bar is above the Lips line.
🟢 Crossing Lips ↑ - if the bar closed above the Lips line, which is below the other lines, while the closing price of the previous bar is below the Lips line.
The fractal signal is triggered after the second bar closes, completing the formation of the fractal, if alerts about fractals are enabled in the indicator settings (the "Fractals > Enable alerts" field):
🟢 Fractal ▲ - upper (Bearish) fractal.
🔴 Fractal ▼ — lower (Bullish) fractal.
⚪️ Fractal ▲/▼ - both upper and lower fractal.
↳ (H=high - L=low) = difference.
If you redirect notifications to a webhook URL, for example, to a Telegram bot, then you need to set the notification template for the webhook in the indicator settings in the "Webhook > Message" field (contains a tooltip with an example), in which you just need to specify the text {{message}}, which will be automatically replaced with the alert text with a ticker and a link to TradingView.
‼️ A signal is not a call to action, but only a reason to analyze the chart to make a decision based on the rules of your strategy.
***
Индикатор включает в себя Williams Alligator, Williams Fractals, Дивергентные бары, Market Facilitation Index, самый высокий и самый низкий бары, максимальный и минимальный пик Awesome Oscillator, а также оповещения о сигналах на основе стратегии Profitunity Билла Вильямса.
MFI и Awesome Oscillator
В соответствии с осциллятором Market Facilitation Index Приседающий бар окрашен в синий цвет, все остальные бары окрашены в соответствии с цветом Awesome Oscillator, кроме Фальшивых баров, которые окрашены более светлым цветом AO. В настройках индикатора вы можете включить отображение "Зеленых" баров (в поле "Green Bars > Show"). В настройках стиля индикатора вы можете выключить изменение цвета баров в соответствии с цветом AO (в поле "AO bars"), в том числе изменить цвет для Фальшивых баров (в поле "Fake AO bars").
MFI рассчитывается по формуле: (high - low) / volume.
Приседающий бар означает, что по сравнению с предыдущим баром его MFI снизился и в тоже время вырос его объем, т.е. MFI < предыдущего бара и объем > предыдущего бара. Признак возможного разворота цены, поэтому это особенно важный сигнал.
Фальшивый бар является противоположностью Приседающему бару и означает, что по сравнению с предыдущим баром его MFI увеличился и в тоже время снизился его объем, т.е. MFI > предыдущего бара и объем < предыдущего бара.
"Зеленый" бар означает, что по сравнению с предыдущим баром его MFI увеличился и в тоже время вырос его объем, т.е. MFI > предыдущего бара и объем > предыдущего бара. Признак продолжения тренда. Но более значимым подтверждением тренда или предупреждением о возможном развороте является Awesome Oscillator, который измеряет движущую силу рынка путем вычисления разницы между 5 Периодной и 34 Периодной Простыми Скользящими Средними (SMA 5 - SMA 34) по средним точкам баров (hl2). Поэтому по умолчанию "Зеленые" бары и противоположные им "Увядающие" бары окрашены в соответствии с цветом Awesome Oscillator.
По стратегии Profitunity Билла Вильямса с помощью осциллятора Awesome Oscillator определяется третья волна Эллиота по максимальному пику AO в интервале от 100 до 140 баров. Наличие дивергенции между максимальным пиком AO и следующим за ним более низким пиком AO в этом интервале также предупреждает о возможной коррекции, особенно если AO переходит через нулевую линию между этими пиками AO. Поэтому на графике дополнительно отображаются цены самого высокого и самого низкого баров, а также максимальный или минимальный пик АО в интервале 140 баров от последнего бара. В настройках индикатора вы можете скрыть метки, линии, изменить количество баров и любые параметры для индикатора AO – метод (SMA, Smoothed SMA, EMA и другие), длину, источник (open, high, low, close, hl2 и другие).
Бычий Дивергентный бар
🟢 Сигналом на покупку (Long) является Бычий Дивергентный бар над которым отображается зеленый круг, если такой бар соответствует одновременно всем следующим условиям:
Максимум бара ниже всех линий индикатора Alligator.
Цена закрытия бара выше его середины, т.е. close > (high + low) / 2.
Минимум бара ниже минимума 2-х предыдущих баров или ниже минимума одного предыдущего бара, а минимум второго предыдущего бара является нижним фракталом (▼). По умолчанию не отображаются Дивергентные бары, минимум которых ниже минимума только одного предыдущего бара и минимум 2-го предыдущего бара не является нижним фракталом (▼), но вы можете включить отображение любых Дивергентных баров в настройках индикатора (установив значение "no" в поле "Divergent Bars > Filtration").
Усилением сигнала Бычьего Дивергентного бара являются следующие условия:
Цена открытия бара, как и цена закрытия, выше его середины, т.е. Open > (high + low) / 2.
Максимум бара ниже всех линий открытого индикатора Alligator, т.е. зеленая линия (Lips) ниже красной линии (Teeth) и красная линия ниже синей линии (Jaw). В этом случае цвет круга над Бычьим Дивергентным баром окрашен в темно-зеленый цвет.
Приседающий Дивергентный бар.
Бар, следующий за Бычьим Дивергентным баром, соответствует зеленому цвету Awesome Oscillator.
Дивергенция на Awesome Oscillator.
Образование нижнего фрактала (▼), у которого минимум Дивергентного бара является пиком фрактала.
Медвежий Дивергентный бар
🔴 Сигналом на продажу (Short) является Медвежий Дивергентный бар под которым отображается красный круг, если такой бар соответствует одновременно всем следующим условиям:
Минимум бара выше всех линий индикатора Alligator.
Цена закрытия бара ниже его середины, т.е. close < (high + low) / 2.
Максимум бара выше маскимума 2-х предыдущих баров или выше максимума одного предыдущего бара, а максимум второго предыдущего бара является верхним фракталом (▲). По умолчанию не отображаются Дивергентные бары, максимум которых выше максимума только одного предыдущего бара и максимум 2-го предыдущего бара не является верхним фракталом (▲), но вы можете включить отображение любых Дивергентных баров в настройках индикатора (установив значение "no" в поле "Divergent Bars > Filtration").
Усилением сигнала Медвежьего Дивергентного бара являются следующие условия:
Цена открытия бара, как и цена закрытия, ниже его середины, т.е. open < (high + low) / 2.
Минимум бара выше всех линий открытого индикатора Alligator, т.е. зеленая линия (Lips) выше красной линии (Teeth) и красная линия выше синей линии (Jaw). В этом случае цвет круга под Медвежьим Дивергентным Баром окрашен в темно-красный цвет.
Приседающий Дивергентный бар.
Бар, следующий за Медвежьим Дивергентным баром, соответствует красному цвету Awesome Oscillator.
Дивергенция на Awesome Oscillator.
Образование верхнего фрактала (▲), у которого максимум Дивергентного бара является пиком фрактала.
Пересечение линий Alligator
Пересечение барами зеленой линии (Lips) открытого индикатора Alligator является первым предупреждением о возможной коррекции (откате цены) при выполнении одного из следующих условий:
Если бар закрылся ниже линии Lips, которая выше линии Teeth, а линия Teeth выше линии Jaw, при этом цена закрытия предыдущего бара находится выше линии Lips.
Если бар закрылся выше линии Lips, которая ниже линии Teeth, а линия Teeth ниже линии Jaw, при этом цена закрытия предыдущего бара находится ниже линии Lips.
Пересечение барами всех линий открытого Alligator является признаком глубокой коррекции и предупреждением о возможной смене тренда.
Частое пересечение линий Alligator между собой является признаком бокового тренда (флэт).
Оповещения о сигналах
Для получения уведомлений о сигналах при создании оповещения необходимо выбрать условие "При любом вызове функции alert()", в таком случае уведомления будут приходить в следующем формате:
D — таймфрейм, например: D, 4H, 15m.
🟢 BDB⎾ — сигнал Бычьего Дивергентного бара на покупку (Long), срабатывает один раз после закрытия бара и включает дополнительные сигналы:
/// — если Alligator открыт.
⏉ — если цена открытия бара, как и цена закрытия, выше его середины.
+ Squat 🔷 — Приседающий бар или + Green ↑ — "Зеленый" бар или + Fake ↓ — Фальшивый бар.
+ AO 🟩 — если после закрытия Дивергентного бара, изменение цвета осциллятора для следующего бара соответствует зеленому цвету Awesome Oscillator. ┴/┬ — AO выше/ниже нулевой линии. ∇ — если есть дивергенция на AO в интервале 140 баров от последнего бара.
🔴 BDB⎿ — сигнал Медвежьего Дивергентного бара на продажу (Short), срабатывает один раз после закрытия бара и включает дополнительные сигналы:
/// — если Alligator открыт.
⏊ — если цена открытия бара, как и цена закрытия, ниже его середины.
+ Squat 🔷 — Приседающий бар или + Green ↑ — "Зеленый" бар или + Fake ↓ — Фальшивый бар.
+ AO 🟥 — если после закрытия Дивергентного бара, изменение цвета осциллятора для следующего бара соответствует красному цвету Awesome Oscillator. ┴/┬ — AO выше/ниже нулевой линии. ∇ — если есть дивергенция на AO в интервале 140 баров от последнего бара.
Сигнал пересечения барами зеленой линии (Lips) открытого индикатора Alligator (можно отключить в настройках индикатора в поле "Alligator > Enable crossing lips alerts"):
🔴 Crossing Lips ↓ — если бар закрылся ниже линии Lips, которая выше остальных линий, при этом цена закрытия предыдущего бара находится выше линии Lips.
🟢 Crossing Lips ↑ — если бар закрылся выше линии Lips, которая ниже остальных линий, при этом цена закрытия предыдущего бара находится ниже линии Lips.
Сигнал фрактала срабатывает после закрытия второго бара, завершающего формирование фрактала, если оповещения о фракталах включены в настройках индикатора (поле "Fractals > Enable alerts"):
🟢 Fractal ▲ — верхний (Медвежий) фрактал.
🔴 Fractal ▼ — нижний (Бычий) фрактал.
⚪️ Fractal ▲/▼ — одновременно верхний и нижний фрактал.
↳ (H=high - L=low) = разница.
Если вы перенаправляете оповещения на URL вебхука, например, в бота Telegram, то вам необходимо установить шаблон оповещения для вебхука в настройках индикатора в поле "Webhook > Message" (содержит подсказку с примером), в котором в качестве текста сообщения достаточно указать текст {{message}}, который будет автоматически заменен на текст оповещения с тикером и ссылкой на TradingView.
‼️ Сигнал — это не призыв к действию, а лишь повод проанализировать график для принятия решения на основе правил вашей стратегии.

Interest Bricks @shrilssInterest Bricks utilize a unique approach to visualize changes in interest over time. It calculates the difference between the current and previous values of a specified asset's closing price on a daily basis. The resulting value indicates whether there has been an increase, decrease, or no change in interest.
This indicator employs a sine wave plot to represent the trend of interest changes. Positive values of the sine wave indicate increasing interest, while negative values denote decreasing interest. The color of the plot dynamically changes based on the direction of the trend: lime for upward trends and red for downward trends.

Supertrended RSI [AlgoAlpha]🚀📈 Introducing the Supertrended RSI Indicator by AlgoAlpha!
Designed to empower your trading decisions, this innovative Pine Script™ creation marries the precision of the Relative Strength Index (RSI) with the dynamic prowess of the SuperTrend methodology. Whether you’re charting the course of cryptos, riding the waves of stock markets, or navigating the futures landscape, our SuperTrended RSI Indicator is your go-to tool for uncovering unique trend insights and crafting trading strategies. 🌟
Key Features:
🔍 Enhanced RSI Analysis: Combines the traditional RSI with a supertrend calculation for a dynamic look at market trends.
🔄 Multiple Moving Averages: Offers a selection of moving averages including SMA, HMA, EMA, and more for tailored analysis.
🎨 Customizable Visuals: Choose your own color scheme for uptrends and downtrends to match your trading dashboard.
📊 Flexible Input Settings: Tailor the indicator with customizable lengths, factors, and smoothing options.
⚡ Real-Time Alerts: Set alerts for bullish and bearish reversals to stay ahead of market movements.
Quick Guide to Using the Supertrended RSI Indicator
Maximize your trading with the Supertrended RSI by following these streamlined steps! 🚀✨
🛠 Add the Indicator: Search for "Supertrended RSI " in TradingView's Indicators & Strategies. Customize settings like RSI length, MA type, and Supertrend factors to fit your trading style.
🎨 Visual Customization: Adjust uptrend and downtrend colors for clear trend visualization.
📊 Market Analysis: Watch for the Supertrend color change for trend reversals. Use the 70 and 30 lines to spot overbought/oversold conditions.
🔔 Alerts: Enable notifications for reversal conditions to capture trading opportunities without constant chart monitoring.
How It Works:
At the core of this indicator is the combination of the Relative Strength Index (RSI) and the Supertrend framework, it does so by applying the SuperTrend on the RSI. The RSI settings can be adjusted for length and smoothing, with the option to select the data source. The Supertrend calculation takes into account a specified trend factor and the Average True Range (ATR) over a given period to determine trend direction.
Visual elements include plotting the RSI, its moving average, and the Supertrend line, with customizable colors for clarity. Overbought and oversold conditions are highlighted, and trend changes are filled with distinct colors.
🔔 Alerts: Enable alerts for crossover and crossunder events to catch every trading opportunity.
🌈 Whether you're a seasoned trader or just starting, the Supertrended RSI offers a fresh perspective on market trends. 📈
💡 Tip: Experiment with different settings to find the perfect balance for your trading style!
🔗 Explore, customize, and enhance your trading experience with the Supertrended RSI Indicator! Happy trading! 🎉

Fusion Traders - RSI Overbought/Oversold + Divergence IndicatorFusion Traders - RSI Overbought/Oversold + Divergence Indicator - new version
This indicator has lots of various add ons.
RSI overbought / oversold with changeable inputs
Divergence indicator
DESCRIPTION:
This script combines the Relative Strength Index ( RSI ), Moving Average and Divergence indicator to make a better decision when to enter or exit a trade.
- The Moving Average line (MA) has been made hidden by default but enhanced with an RSIMA cloud.
- When the RSI is above the selected MA it turns into green and when the RSI is below the select MA it turns into red.
- When the RSI is moving into the Overbought or Oversold area, some highlighted areas will appear.
- When some divergences or hidden divergences are detected an extra indication will be highlighted.
- When the divergence appear in the Overbought or Oversold area the more weight it give to make a decision.
- The same colour pallet has been used as the default candlestick colours so it looks familiar.
HOW TO USE:
The prerequisite is that we have some knowledge about the Elliot Wave Theory, the Fibonacci Retracement and the Fibonacci Extension tools.
We are hoping you like this indicator and added to your favourite indicators. If you have any question then comment below, and I'll do my best to help.
FEATURES:
• You can show/hide the RSI .
• You can show/hide the MA.
• You can show/hide the lRSIMA cloud.
• You can show/hide the Stoch RSI cloud.
• You can show/hide and adjust the Overbought and Oversold zones.
• You can show/hide and adjust the Overbought Extended and Oversold Extended zones.
• You can show/hide the Overbought and Oversold highlighted zones.
HOW TO GET ACCESS TO THE SCRIPT:
• Favorite the script and add it to your chart.
Volume Spike IndicatorHello dear traders,
Today we're discussing an indicator I've coded: the Volume Spike Indicator (VSI).
The indicator isn't a groundbreaking invention and certainly not a novelty. Nevertheless, I haven't seen this version of the indicator on TradingView before, so I'd like to introduce it.
1. The Origin of the Idea:
We're all familiar with volume charts: A volume chart visually represents the trading activity for a specific asset over a certain period, indicating the total number of shares or contracts traded.
We also know that volume spikes can significantly impact the market. A volume spike represents an extreme anomaly, a day, week, or month with an extraordinary amount of trading. However, recognizing these spikes in practice isn't always straightforward. What constitutes high volume? How do we define and identify it? The answers to these questions aren't easy.
It's commonly said that a volume spike could be identified if the volume is 25% more than the average of the two weeks prior, but how do you measure this 25%? It's not always easy to calculate, especially in real-time.
This challenge led me to develop the concept into an indicator.
How Does It Work?
Imagine being able to "feel" the market's energy like a surfer feels the ocean. The VSI does something similar by examining trading volume and comparing it to what has been typical over the past few weeks. Here's a quick look at the magic behind it:
Step 1: Establishing the Baseline: We start by establishing a baseline, i.e., the average trading volume over a given period. Let's use the last 10 days as the default setting. We choose 10 days because, in the traditional stock market, 10 days represent two weeks if you subtract weekends. This gives us a fixed line to compare against.
Step 2: Recognizing Peaks: Next, we look for days when the trading volume significantly exceeds this average. The size of the jump is where you have a say. You can set a threshold, such as 25%, to define what you consider a volume spike.
Step 3: The Calculation: This is where the math comes into play. We calculate the percentage change in today's volume compared to the average volume of the last 10 days. For example, if today's volume is 30% above the average and you've set your threshold at 25%, the VSI will recognize this as a spike.
Step 4: Visual Cue: These spikes are then plotted on a graph, with each spike represented as a bar. The height of the bar indicates the spike's percentage size, so you can see at a glance how significant a spike is.
Step 5: Intuitive Color Coding: For quick analysis, the VSI employs a color-coding system. Exceptionally high peaks, such as those exceeding a 100% increase, are highlighted in blue to emphasize their importance. Other peaks are shown in red, creating a visual hierarchy for quick volume data interpretation.
Why This Matters:
Identifying these spikes can help pinpoint the beginning or end of a trend. The idea is that when trading peaks at a certain level, there might be no more buyers or sellers willing to engage at that price level. Volume peaks, and a reversal is likely imminent. It's a simple yet effective concept. Therefore, it's crucial to use this indicator in the context of the trend, as not every spike carries the same significance.
Customizable:
The beauty of the VSI lies in its flexibility. Trading futures? You might want to adjust the averaging period to 14 days to better suit your market. You have full control over the settings to tailor them to your trading style.
Interpreting the Figures:
A positive percentage indicates a volume spike above the average – the higher the percentage, the more significant the spike.
If the percentage exceeds a certain threshold (which you can set, e.g., 25%), it signals a volume spike, indicating increased market activity that could precede significant price movement.
What makes the VSI genuinely adaptable is your ability to tweak the parameters to suit your needs.
Are you trading in a volatile market? Extend the SMA period to smooth out the noise. Trading in a 24-hour market? Adjust the length of your SMA. Seeking finer details? Shorten it. The VSI is yours to adapt to your trading strategy.
---------------------------------------------------------------------------------------------------------------------
As we wrap up this introduction to the Volume Spike Indicator, I hope you're as excited about its potential as I am. This tool, born out of curiosity and a desire for clarity in the vast ocean of market data, is designed to be your ally in navigating the waves of trading activity.
Remember, the true power of the VSI lies not just in its ability to highlight significant volume spikes, but in its adaptability to your unique trading style and needs. Whether you're charting courses through the tumultuous seas of day trading or navigating the broader currents of long-term investments, the VSI is here to offer insights and guidance.
I encourage you to experiment with it, customize it, and see how it can enhance your trading strategy. And as you do, remember that every tool, no matter how powerful, is just one piece of the puzzle. Combine the VSI with your knowledge, experience, and intuition to make informed and strategic trading decisions.
Thank you for taking the time to explore the Volume Spike Indicator with me.
Best Regards,
Karim Subhieh
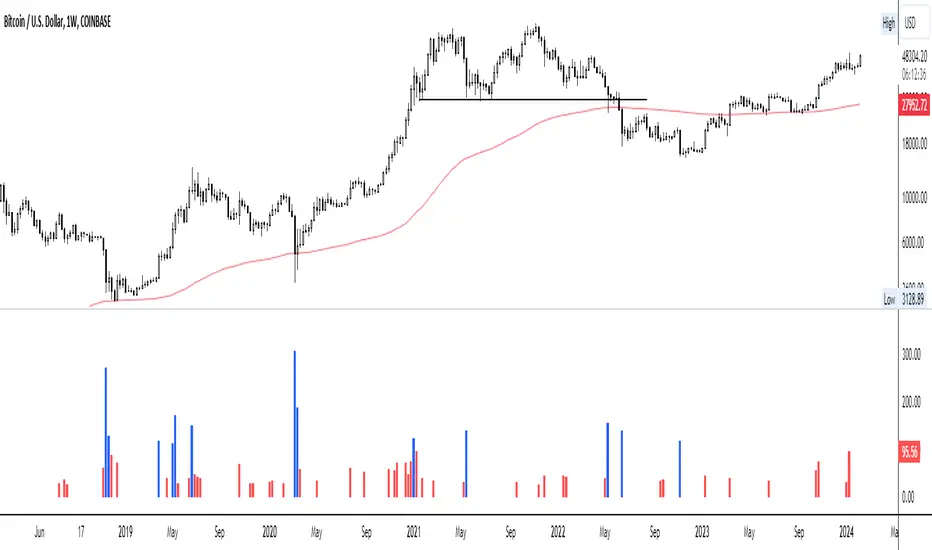
Harmony Or Divergence WavesThis script visually identifies harmony and divergence within the market through an analysis of volume and price action over a specified lookback period. The script highlights these phenomena on the price chart, aiding traders in making informed decisions based on observed patterns.
What It Does:
The script operates on the principle of comparing volume and candle body sizes within two halves of a user-defined lookback period. It aims to detect periods of harmony, where price and volume trends move in synchrony, and periods of divergence, where they do not. Specifically, it:
Calculates the highest volume and corresponding lowest price point in the first and second halves of the lookback period.
Determines the increase ratios for price and volume between these two points.
Visualizes these findings by drawing lines and labels on the chart, with the color indicating harmony (green) or divergence (red).
Optionally displays a table with detailed metrics and an "End H/D Period" label to mark the analysis boundary.
How It Does It
It begins by iterating over each candle within the specified lookback period, dividing the period into two halves to compare early and later segments.
For each half, it identifies the candle with the highest volume and records its volume, the price at its lowest point, and the size of its candle body.
After identifying these key points, the script calculates ratios of price increase and volume increase from the first half to the second.
Using these ratios, it determines whether price and volume are moving in harmony or diverging.
Based on this analysis, it then dynamically draws lines connecting the two key points, with the line color indicating whether the period is classified as harmony or divergence.
Additionally, it can display a table with the calculated metrics for both points and their ratios, and optionally, a label to mark the end of the analyzed period.
How Traders Might Use It:
It Can Be Used To
Identifying potential reversal points: Periods of divergence may indicate upcoming changes in market direction, offering traders clues for entry or exit points.
Confirming trend strength: Harmony between price and volume trends can serve as a confirmation of the current market direction, suggesting a stronger trend that traders might follow.
Adjusting strategies: By observing the dynamics of price and volume, traders can adjust their trading strategies to better align with market conditions, potentially increasing their chances of successful trades.
Educational insights: The visual and tabular data provided by the script can help traders understand the relationship between volume and price action, enriching their market analysis skills.

Candlesticks Patterns [TradingFinder] Pin Bar Hammer Shooting🔵 Introduction
Truly, the title "TradingView" doesn't do justice to this excellent website, and that's why I've written about its crucial aspect. In this indicator, the identification of all candlesticks known as "Pin bars" is explored.
These candlesticks include the following:
- Hammer : A Pin bar formed at the end of a bearish trend, with its body being either bearish or bullish.
- Shooting Star : Formed at the end of a bullish trend, with its body being either bearish or bullish.
- Hanging Man : Formed during an upward trend, characterized by a candle with a lower shadow.
- Inverted Hammer : Formed during a downward trend, characterized by a candle with an upper shadow.
🟣 Important : For ease of use, we refer to these four candlestick patterns as Pin Bars and categorize them into the main friends "Bullish" and "Bearish."
🟣 Important : In all sources, Hanging Man and Inverted Hammer are referred to as "Reversal candles." However, in reality, whenever they appear after breaking a significant area (Break Out), we expect these candles to signal a continuation of the trend and confirmation in the direction of the trend.
🟣 Important : One of the best signs of market manipulation and entry by market giants is the "Ice Berg." So, it provides one of the best trading opportunities.
🔵 Reason for Creation
Many traders, especially volume traders, use Pin bars as confirmation and enter the market after their occurrence. In this indicator, all four patterns are identified and displayed in a colored candle format, using "triangle" and "circle."
When they are evident on the chart, directly or by drawing a horizontal line, they give us good alerts for reversal or continuation areas.
🔵 Information Table
1. Red circle: Pin bars formed in a downtrend.
2. Blue circle: Bullish Pin bars formed in an uptrend.
3. Black triangle: Bearish Pin bar candle in an uptrend.
4. Blue triangle: Bullish Pin bar candle in a downtrend.
🔵 Settings
Trend Detection Period: A special feature that considers smaller or larger fluctuations. If individual price waves need to be considered, use lower numbers; if the overall trend direction is desired, use larger numbers (e.g., 5-7 or higher). This precisely sets the Zigzag or Pivot format, not displayed but considered in the indicator calculation.
Trend Effect : By changing the Trend Effect status to "Off," all Pin bars, whether bullish or bearish, are displayed regardless of the current market trend. If the status remains "On," only Pin bars in the direction of the main market trend are shown.
🟣 Important : Black triangles "Number 3" and blue triangles "Number 4" displayed in the information table section, as explained in the "Information Table" section.
Show Bullish Pin Bar : When set to "Yes," displays bullish Pin bars; when set to "No," does not display them.
Show Bearish Pin Bar : When set to "Yes," allows the display of bearish Pin bars; when set to "No," does not display them.
Bullish Pin Bar Setting : Using the "Ratio Lower Shadow to Body" and "Ratio Lower Shadow to Higher Shadow" settings, you can customize your bullish Pin bar candles. Larger numbers impose stricter conditions for identifying bullish Pin bars.
Bearish Pin Bar Setting : Using the "Ratio Higher Shadow to Body" and "Ratio Higher Shadow to Lower Shadow" settings, you can customize your bearish Pin bar candles. Larger numbers impose stricter conditions for identifying bearish Pin bars.
Show Info Table : Allows the display or non-display of the information table (located at the bottom of the page and on the right side).
🔵 How to Use
At the end of a downtrend, look for "Hammer" candles, easily identified one by one.
To identify the "Shooting Star" candle pattern at the end of an uptrend; expect a price reversal in the downtrend.
For trades in the downward direction, wait for the formation of an "Inverted Hammer" Pin bar.
And finally, in an uptrend, where a "Hanging Man" candle can form.
🔵 Features
For better visualization, triangles and circles are used above the candles, but they can be easily removed. All Pin bars are displayed in color with the following meanings:
- Black-bodied candle: Inverted Hammer
- Turquoise blue candle: Hammer
- Pink candle: Hanging Man
- Red candle: Shooting Star
🟣 Important : The capability to detect the powerful two-candle pattern "Tweezer Top" at the end of an uptrend emerges by forming two "Shooting Star" candles side by side.
Similarly, the two-candle pattern "Tweezer Bottom" is created at the end of a downtrend with the formation of two "Hammer" candles side by side. To identify the "Tweezer" pattern, make sure the settings in the "Trend Effect" section are set to "Off."
🟣 Auxiliary Indicators
During the start of trading sessions such as Asia, London, and New York, where the highest liquidity exists, alongside this indicator, you can use the Trading Sessions indicator.
Sessions
The combination of Order Blocks "-OB" and "+OB" with candles is one of the best trading methods. The indicator that identifies order blocks, along with this indicator, can yield remarkable results in the success of Pin bar candles.
Order Blocks Finder
The trading toolset "TFlab" presents this indicator. To benefit from all indicators, we invite you to visit our page " TFlab Scripts ".

Flags and Pennants [Trendoscope®]🎲 An extension to Chart Patterns based on Trend Line Pairs - Flags and Pennants
After exploring Algorithmic Identification and Classification of Chart Patterns and developing Auto Chart Patterns Indicator , we now delve into extensions of these patterns, focusing on Flag and Pennant Chart Patterns. These patterns evolve from basic trend line pair-based structures, often influenced by preceding market impulses.
🎲 Identification rules for the Extension Patterns
🎯 Identify the existence of Base Chart Patterns
Before identifying the flag and pennant patterns, we first need to identify the existence of following base trend line pair based converging or parallel patterns.
Ascending Channel
Descending Channel
Rising Wedge (Contracting)
Falling Wedge (Contracting)
Converging Triangle
Descending Triangle (Contracting)
Ascending Triangle (Contracting)
🎯 Identifying Extension Patterns.
The key to pinpointing these patterns lies in spotting a strong impulsive wave – akin to a flagpole – preceding a base pattern. This setup suggests potential for an extension pattern:
A Bullish Flag emerges from a positive impulse followed by a descending channel or a falling wedge
A Bearish Flag appears after a negative impulse leading to an ascending channel or a rising wedge.
A Bullish Pennant is indicated by a positive thrust preceding a converging triangle or ascending triangle.
A Bearish Pennant follows a negative impulse and a converging or descending triangle.
🎲 Pattern Classifications and Characteristics
🎯 Bullish Flag Pattern
Characteristics of Bullish Flag Pattern are as follows
Starts with a positive impulse wave
Immediately followed by either a short descending channel or a falling wedge
Here is an example of Bullish Flag Pattern
🎯 Bearish Flag Pattern
Characteristics of Bearish Flag Pattern are as follows
Starts with a negative impulse wave
Immediately followed by either a short ascending channel or a rising wedge
Here is an example of Bearish Flag Pattern
🎯 Bullish Pennant Pattern
Characteristics of Bullish Pennant Pattern are as follows
Starts with a positive impulse wave
Immediately followed by either a converging triangle or ascending triangle pattern.
Here is an example of Bullish Pennant Pattern
🎯 Bearish Pennant Pattern
Characteristics of Bearish Pennant Pattern are as follows
Starts with a negative impulse wave
Immediately followed by either a converging triangle or a descending converging triangle pattern.
Here is an example of Bearish Pennant Pattern
🎲 Trading Extension Patterns
In a strong market trend, it's common to see temporary periods of consolidation, forming patterns that either converge or range, often counter to the ongoing trend direction. Such pauses may lay the groundwork for the continuation of the trend post-breakout. The assumption that the trend will resume shapes the underlying bias of Flag and Pennant patterns
It's important, however, not to base decisions solely on past trends. Conducting personal back testing is crucial to ascertain the most effective entry and exit strategies for these patterns. Remember, the behavior of these patterns can vary significantly with the volatility of the asset and the specific timeframe being analyzed.
Approach the interpretation of these patterns with prudence, considering that market dynamics are subject to a wide array of influencing factors that might deviate from expected outcomes. For investors and traders, it's essential to engage in thorough back testing, establishing entry points, stop-loss orders, and target goals that align with your individual trading style and risk appetite. This step is key to assessing the viability of these patterns in line with your personal trading strategies and goals.
It's fairly common to witness a breakout followed by a swift price reversal after these patterns have formed. Additionally, there's room for innovation in trading by going against the bias if the breakout occurs in the opposite direction, specially when the trend before the formation of the pattern is in against the pattern bias.
🎲 Cheat Sheet
🎲 Indicator Settings
Custom Source : Enables users to set custom OHLC - this means, the indicator can also be applied on oscillators and other indicators having OHLC values.
Zigzag Settings : Allows users to enable different zigzag base and set length and depth for each zigzag.
Scanning Settings : Pattern scanning settings set some parameters that define the pattern recognition process.
Display Settings : Determine the display of indicators including colors, lines, labels etc.
Backtest Settings : Allows users to set a predetermined back test bars so that the indicator will not time out while trying to run for all available bars.

INTELLECT_city - abcd PatternThe ABCD Pattern indicator is a tool that helps identify potential geometric patterns of price movement on the chart of a financial instrument. This indicator is based on trading strategies that use the formation of four separate points, designated A, B, C and D.
Point A: The starting point of the pattern, which usually represents the end of the previous price trend.
Point B: The top of the first price wave directed against the current trend.
Point C: Completion of the second price wave started from point B. Often point C is formed at a level close to the completion of the correction.
Point D: The end point of the pattern where price forms a third wave directed towards the original trend.
The indicator displays the AB, BC and CD lines on the chart and also provides labels for these levels. This can help traders and analysts identify and analyze potential ABCD patterns on a price action chart.
It is important to remember that the ABCD Pattern does not guarantee successful trading and traders should combine it with other analysis methods and strategies to make informed decisions. Testing and adaptation to specific market conditions are also key steps when using this indicator.
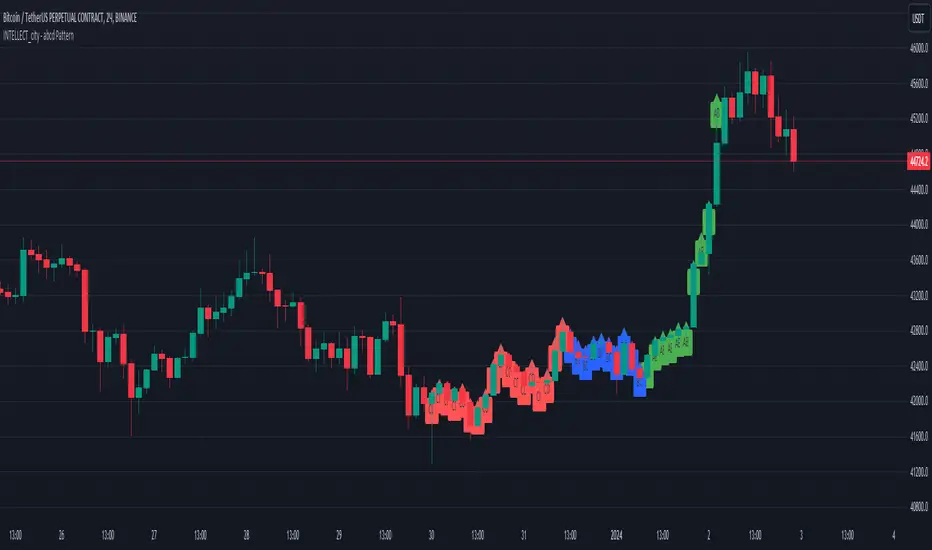
The Flash-Strategy with Minervini Stage Analysis QualifierThe Flash-Strategy (Momentum-RSI, EMA-crossover, ATR) with Minervini Stage Analysis Qualifier
Introduction
Welcome to a comprehensive guide on a cutting-edge trading strategy I've developed, designed for the modern trader seeking an edge in today's dynamic markets. This strategy, which I've honed through my years of experience in the trading arena, stands out for its unique blend of technical analysis and market intuition, tailored specifically for use on the TradingView platform.
As a trader with a deep passion for the financial markets, my journey began several years ago, driven by a relentless pursuit of a trading methodology that is both effective and adaptable. My background in trading spans various market conditions and asset classes, providing me with a rich tapestry of experiences from which to draw. This strategy is the culmination of that journey, embodying the lessons learned and insights gained along the way.
The cornerstone of this strategy lies in its ability to generate precise long signals in a Stage 2 uptrend and equally accurate short signals in a Stage 4 downtrend. This approach is rooted in the principles of trend following and momentum trading, harnessing the power of key indicators such as the Momentum-RSI, EMA Crossover, and Average True Range (ATR). What sets this strategy apart is its meticulous design, which allows it to adapt to the ever-changing market conditions, providing traders with a robust tool for navigating both bullish and bearish scenarios.
This strategy was born out of a desire to create a trading system that is not only highly effective in identifying potential trade setups but also straightforward enough to be implemented by traders of varying skill levels. It's a reflection of my belief that successful trading hinges on clarity, precision, and disciplined execution. Whether you are a seasoned trader or just beginning your journey, this guide aims to provide you with a comprehensive understanding of how to harness the full potential of this strategy in your trading endeavors.
In the following sections, we will delve deeper into the mechanics of the strategy, its implementation, and how to make the most out of its features. Join me as we explore the nuances of a strategy that is designed to elevate your trading to the next level.
Stage-Specific Signal Generation
A distinctive feature of this trading strategy is its focus on generating long signals exclusively during Stage 2 uptrends and short signals during Stage 4 downtrends. This approach is based on the widely recognized market cycle theory, which divides the market into four stages: Stage 1 (accumulation), Stage 2 (uptrend), Stage 3 (distribution), and Stage 4 (downtrend). By aligning the signal generation with these specific stages, the strategy aims to capitalize on the most dynamic and clear-cut market movements, thereby enhancing the potential for profitable trades.
1. Long Signals in Stage 2 Uptrends
• Characteristics of Stage 2: Stage 2 is characterized by a strong uptrend, where prices are consistently rising. This stage typically follows a period of accumulation (Stage 1) and is marked by increased investor interest and bullish sentiment in the market.
• Criteria for Long Signal Generation: Long signals are generated during this stage when the technical indicators align with the characteristics of a Stage 2 uptrend.
• Rationale for Stage-Specific Signals: By focusing on Stage 2 for long trades, the strategy seeks to enter positions during the phase of strong upward momentum, thus riding the wave of rising prices and investor optimism. This stage-specific approach minimizes exposure to less predictable market phases, like the consolidation in Stage 1 or the indecision in Stage 3.
2. Short Signals in Stage 4 Downtrends
• Characteristics of Stage 4: Stage 4 is identified by a pronounced downtrend, with declining prices indicating prevailing bearish sentiment. This stage typically follows the distribution phase (Stage 3) and is characterized by increasing selling pressure.
• Criteria for Short Signal Generation: Short signals are generated in this stage when the indicators reflect a strong bearish trend.
• Rationale for Stage-Specific Signals: Targeting Stage 4 for shorting capitalizes on the market's downward momentum. This tactic aligns with the natural market cycle, allowing traders to exploit the downward price movements effectively. By doing so, the strategy avoids the potential pitfalls of shorting during the early or late stages of the market cycle, where trends are less defined and more susceptible to reversals.
In conclusion, the strategy’s emphasis on stage-specific signal generation is a testament to its sophisticated understanding of market dynamics. By tailoring the long and short signals to Stages 2 and 4, respectively, it leverages the most compelling phases of the market cycle, offering traders a clear and structured approach to aligning their trades with dominant market trends.
Strategy Overview
At the heart of this trading strategy is a philosophy centered around capturing market momentum and trend efficiency. The core objective is to identify and capitalize on clear uptrends and downtrends, thereby allowing traders to position themselves in sync with the market's prevailing direction. This approach is grounded in the belief that aligning trades with these dominant market forces can lead to more consistent and profitable outcomes.
The strategy is built on three foundational components, each playing a critical role in the decision-making process:
1. Momentum-RSI (Relative Strength Index): The Momentum-RSI is a pivotal element of this strategy. It's an enhanced version of the traditional RSI, fine-tuned to better capture the strength and velocity of market trends. By measuring the speed and change of price movements, the Momentum-RSI provides invaluable insights into whether a market is potentially overbought or oversold, suggesting possible entry and exit points. This indicator is especially effective in filtering out noise and focusing on substantial market moves.
2. EMA (Exponential Moving Average) Crossover: The EMA Crossover is a crucial component for trend identification. This strategy employs two EMAs with different timeframes to determine the market trend. When the shorter-term EMA crosses above the longer-term EMA, it signals an emerging uptrend, suggesting a potential long entry. Conversely, a crossover below indicates a possible downtrend, hinting at a short entry opportunity. This simple yet powerful tool is key in confirming trend directions and timing market entries.
3. ATR (Average True Range): The ATR is instrumental in assessing market volatility. This indicator helps in understanding the average range of price movements over a given period, thus providing a sense of how much a market might move on a typical day. In this strategy, the ATR is used to adjust stop-loss levels and to gauge the potential risk and reward of trades. It allows for more informed decisions by aligning trade management techniques with the current volatility conditions.
The synergy of these three components – the Momentum-RSI, EMA Crossover, and ATR – creates a robust framework for this trading strategy. By combining momentum analysis, trend identification, and volatility assessment, the strategy offers a comprehensive approach to navigating the markets. Whether it's capturing a strong trend in its early stages or identifying a potential reversal, this strategy aims to provide traders with the tools and insights needed to make well-informed, strategically sound trading decisions.
Detailed Component Analysis
The efficacy of this trading strategy hinges on the synergistic functioning of its three key components: the Momentum-RSI, EMA Crossover, and Average True Range (ATR). Each component brings a unique perspective to the strategy, contributing to a well-rounded approach to market analysis.
1. Momentum-RSI (Relative Strength Index)
• Definition and Function: The Momentum-RSI is a modified version of the classic Relative Strength Index. While the traditional RSI measures the velocity and magnitude of directional price movements, the Momentum-RSI amplifies aspects that reflect trend strength and momentum.
• Significance in Identifying Trend Strength: This indicator excels in identifying the strength behind a market's move. A high Momentum-RSI value typically indicates strong bullish momentum, suggesting the potential continuation of an uptrend. Conversely, a low Momentum-RSI value signals strong bearish momentum, possibly indicative of an ongoing downtrend.
• Application in Strategy: In this strategy, the Momentum-RSI is used to gauge the underlying strength of market trends. It helps in filtering out minor fluctuations and focusing on significant movements, providing a clearer picture of the market's true momentum.
2. EMA (Exponential Moving Average) Crossover
• Definition and Function: The EMA Crossover component utilizes two exponential moving averages of different timeframes. Unlike simple moving averages, EMAs give more weight to recent prices, making them more responsive to new information.
• Contribution to Market Direction: The interaction between the short-term and long-term EMAs is key to determining market direction. A crossover of the shorter EMA above the longer EMA is an indicator of an emerging uptrend, while a crossover below signals a developing downtrend.
• Application in Strategy: The EMA Crossover serves as a trend confirmation tool. It provides a clear, visual representation of the market's direction, aiding in the decision-making process for entering long or short positions. This component ensures that trades are aligned with the prevailing market trend, a crucial factor for the success of the strategy.
3. ATR (Average True Range)
• Definition and Function: The ATR is an indicator that measures market volatility by calculating the average range between the high and low prices over a specified period.
• Role in Assessing Market Volatility: The ATR provides insights into the typical market movement within a given timeframe, offering a measure of the market's volatility. Higher ATR values indicate increased volatility, while lower values suggest a calmer market environment.
• Application in Strategy: Within this strategy, the ATR is instrumental in tailoring risk management techniques, particularly in setting stop-loss levels. By accounting for the market's volatility, the ATR ensures that stop-loss orders are placed at levels that are neither too tight (risking premature exits) nor too loose (exposing to excessive risk).
In summary, the combination of Momentum-RSI, EMA Crossover, and ATR in this trading strategy provides a comprehensive toolkit for market analysis. The Momentum-RSI identifies the strength of market trends, the EMA Crossover confirms the market direction, and the ATR guides in risk management by assessing volatility. Together, these components form the backbone of a strategy designed to navigate the complexities of the financial markets effectively.
1. Signal Generation Process
• Combining Indicators: The strategy operates by synthesizing signals from the Momentum-RSI, EMA Crossover, and ATR indicators. Each indicator serves a specific purpose: the Momentum-RSI gauges trend momentum, the EMA Crossover identifies the trend direction, and the ATR assesses the market’s volatility.
• Criteria for Signal Validation: For a signal to be considered valid, it must meet specific criteria set by each of the three indicators. This multi-layered approach ensures that signals are not only based on one aspect of market behavior but are a result of a comprehensive analysis.
2. Conditions for Long Positions
• Uptrend Confirmation: A long position signal is generated when the shorter-term EMA crosses above the longer-term EMA, indicating an uptrend.
• Momentum-RSI Alignment: Alongside the EMA crossover, the Momentum-RSI should indicate strong bullish momentum. This is typically represented by the Momentum-RSI being at a high level, confirming the strength of the uptrend.
• ATR Consideration: The ATR is used to fine-tune the entry point and set an appropriate stop-loss level. In a low volatility scenario, as indicated by the ATR, the stop-loss can be set tighter, closer to the entry point.
3. Conditions for Short Positions
• Downtrend Confirmation: Conversely, a short position signal is indicated when the shorter-term EMA crosses below the longer-term EMA, signaling a downtrend.
• Momentum-RSI Confirmation: The Momentum-RSI should reflect strong bearish momentum, usually seen when the Momentum-RSI is at a low level. This confirms the bearish strength of the market.
• ATR Application: The ATR again plays a role in determining the stop-loss level for the short position. Higher volatility, as indicated by a higher ATR, would warrant a wider stop-loss to accommodate larger market swings.
By adhering to these mechanics, the strategy aims to ensure that each trade is entered with a high probability of success, aligning with the market’s current momentum and trend. The integration of these indicators allows for a holistic market analysis, providing traders with clear and actionable signals for both entering and exiting trades.
Customizable Parameters in the Strategy
Flexibility and adaptability are key features of this trading strategy, achieved through a range of customizable parameters. These parameters allow traders to tailor the strategy to their individual trading style, risk tolerance, and specific market conditions. By adjusting these parameters, users can fine-tune the strategy to optimize its performance and align it with their unique trading objectives. Below are the primary parameters that can be customized within the strategy:
1. Momentum-RSI Settings
• Period: The lookback period for the Momentum-RSI can be adjusted. A shorter period makes the indicator more sensitive to recent price changes, while a longer period smoothens the RSI line, offering a broader view of the momentum.
• Overbought/Oversold Thresholds: Users can set their own overbought and oversold levels, which can help in identifying extreme market conditions more precisely according to their trading approach.
2. EMA Crossover Settings
• Timeframes for EMAs: The strategy uses two EMAs with different timeframes. Traders can modify these timeframes, choosing shorter periods for a more responsive approach or longer periods for a more conservative one.
• Source Data: The choice of price data (close, open, high, low) used in calculating the EMAs can be varied depending on the trader’s preference.
3. ATR Settings
• Lookback Period: Adjusting the lookback period for the ATR impacts how the indicator measures volatility. A longer period may provide a more stable but less responsive measure, while a shorter period offers quicker but potentially more erratic readings.
• Multiplier for Stop-Loss Calculation: This parameter allows traders to set how aggressively or conservatively they want their stop-loss to be in relation to the ATR value.
Here are the standard settings:

Triple Confirmation Kernel Regression Overlay [QuantraSystems]Kernel Regression Oscillator - Overlay
Introduction
The Kernel Regression Oscillator (ᏦᏒᎧ) represents an advanced tool for traders looking to capitalize on market trends.
This Indicator is valuable in identifying and confirming trend directions, as well as probabilistic and dynamic oversold and overbought zones.
It achieves this through a unique composite approach using three distinct Kernel Regressions combined in an Oscillator.
The additional Chart Overlay Indicator adds confidence to the signal.
Which is this Indicator.
This methodology helps the trader to significantly reduce false signals and offers a more reliable indication of market movements than more widely used indicators can.
Legend
The upper section is the Overlay. It features the Signal Wave to display the current trend.
Its Overbought and Oversold zones start at 50% and end at 100% of the selected Standard Deviation (default σ = 3), which can indicate extremely rare situations which can lead to either a softening momentum in the trend or even a mean reversion situation.
The lower one is the Base Chart.
The Indicator is linked here
It features the Kernel Regression Oscillator to display a composite of three distinct regressions, also displaying current trend.
Its Overbought and Oversold zones start at 50% and end at 100% of the selected Standard Deviation (default σ = 2), which can indicate extremely rare situations.
Case Study
To effectively utilize the ᏦᏒᎧ, traders should use both the additional Overlay and the Base
Chart at the same time. Then focus on capturing the confluence in signals, for example:
If the 𝓢𝓲𝓰𝓷𝓪𝓵 𝓦𝓪𝓿𝓮 on the Overlay and the ᏦᏒᎧ on the Base Chart both reside near the extreme of an Oversold zone the probability is higher than normal that momentum in trend may soften or the token may even experience a reversion soon.
If a bar is characterized by an Oversold Shading in both the Overlay and the Base Chart, then the probability is very high to experience a reversion soon.
In this case the trader may want to look for appropriate entries into a long position, as displayed here.
If a bar is characterized by an Overbought Shading in either Overlay or Base Chart, then the probability is high for momentum weakening or a mean reversion.
In this case the trade may have taken profit and closed his long position, as displayed here.
Please note that we always advise to find more confluence by additional indicators.
Recommended Settings
Swing Trading (1D chart)
Overlay
Bandwith: 45
Width: 2
SD Lookback: 150
SD Multiplier: 2
Base Chart
Bandwith: 45
SD Lookback: 150
SD Multiplier: 2
Fast-paced, Scalping (4min chart)
Overlay
Bandwith: 75
Width: 2
SD Lookback: 150
SD Multiplier: 3
Base Chart
Bandwith: 45
SD Lookback: 150
SD Multiplier: 2
Notes
The Kernel Regression Oscillator on the Base Chart is also sensitive to divergences if that is something you are keen on using.
For maximum confluence, it is recommended to use the indicator both as a chart overlay and in its Base Chart.
Please pay attention to shaded areas with Standard Deviation settings of 2 or 3 at their outer borders, and consider action only with high confidence when both parts of the indicator align on the same signal.
This tool shows its best performance on timeframes lower than 4 hours.
Traders are encouraged to test and determine the most suitable settings for their specific trading strategies and timeframes.
The trend following functionality is indicated through the "𝓢𝓲𝓰𝓷𝓪𝓵 𝓦𝓪𝓿𝓮" Line, with optional "Up" and "Down" arrows to denote trend directions only (toggle “Show Trend Signals”).
Methodology
The Kernel Regression Oscillator takes three distinct kernel regression functions,
used at similar weight, in order to calculate a balanced and smooth composite of the regressions. Part of it are:
The Epanechnikov Kernel Regression: Known for its efficiency in smoothing data by assigning less weight to data points further away from the target point than closer data points, effectively reducing variance.
The Wave Kernel Regression: Similarly assigning weight to the data points based on distance, it captures repetitive and thus wave-like patterns within the data to smoothen out and reduce the effect of underlying cyclical trends.
The Logistic Kernel Regression: This uses the logistic function in order to assign weights by probability distribution on the distance between data points and target points. It thus avoids both bias and variance to a certain level.
kernel(source, bandwidth, kernel_type) =>
switch kernel_type
"Epanechnikov" => math.abs(source) <= 1 ? 0.75 * (1 - math.pow(source, 2)) : 0.0
"Logistic" => 1/math.exp(source + 2 + math.exp(-source))
"Wave" => math.abs(source) <= 1 ? (1 - math.abs(source)) * math.cos(math.pi * source) : 0.
kernelRegression(src, bandwidth, kernel_type) =>
sumWeightedY = 0.
sumKernels = 0.
for i = 0 to bandwidth - 1
base = i*i/math.pow(bandwidth, 2)
kernel = kernel(base, 1, kernel_type)
sumWeightedY += kernel * src
sumKernels += kernel
(src - sumWeightedY/sumKernels)/src
// Triple Confirmations
Ep = kernelRegression(source, bandwidth, 'Epanechnikov' )
Lo = kernelRegression(source, bandwidth, 'Logistic' )
Wa = kernelRegression(source, bandwidth, 'Wave' )
By combining these regressions in an unbiased average, we follow our principle of achieving confluence for a signal or a decision, by stacking several edges to increase the probability that we are correct.
// Average
AV = math.avg(Ep, Lo, Wa)
The Standard Deviation bands take defined parameters from the user, in this case sigma of ideally between 2 to 3,
to help the indicator detect extremely improbable conditions and thus take an inversely probable signal from it to forward to the user.
The parameter settings and also the visualizations allow for ample customizations by the trader. The indicator comes with default and recommended settings.
For questions or recommendations, please feel free to seek contact in the comments.

Triple Confirmation Kernel Regression Base [QuantraSystems]Kernel Regression Oscillator - BASE
Introduction
The Kernel Regression Oscillator (ᏦᏒᎧ) represents an advanced tool for traders looking to capitalize on market trends.
This Indicator is valuable in identifying and confirming trend directions, as well as probabilistic and dynamic oversold and overbought zones.
It achieves this through a unique composite approach using three distinct Kernel Regressions combined in an Oscillator. The additional Chart Overlay Indicator adds confidence to the signal.
This methodology helps the trader to significantly reduce false signals and offers a more reliable indication of market movements than more widely used indicators can.
Legend
The upper section is the Overlay. It features the Signal Wave to display the current trend.
Its Overbought and Oversold zones start at 50% and end at 100% of the selected Standard Deviation (default σ = 3), which can indicate extremely rare situations which can lead to either a softening momentum in the trend or even a mean reversion situation.
The lower one is the Base Chart - This Indicator.
It features the Kernel Regression Oscillator to display a composite of three distinct regressions, also displaying current trend.
Its Overbought and Oversold zones start at 50% and end at 100% of the selected Standard Deviation (default σ = 2), which can indicate extremely rare situations.
Case Study
To effectively utilize the ᏦᏒᎧ, traders should use both the additional Overlay and the Base
Chart at the same time. Then focus on capturing the confluence in signals, for example:
If the 𝓢𝓲𝓰𝓷𝓪𝓵 𝓦𝓪𝓿𝓮 on the Overlay and the ᏦᏒᎧ on the Base Chart both reside near the extreme of an Oversold zone the probability is higher than normal that momentum in trend may soften or the token may even experience a reversion soon.
If a bar is characterized by an Oversold Shading in both the Overlay and the Base Chart, then the probability is very high to experience a reversion soon.
In this case the trader may want to look for appropriate entries into a long position, as displayed here.
If a bar is characterized by an Overbought Shading in either Overlay or Base Chart, then the probability is high for momentum weakening or a mean reversion.
In this case the trade may have taken profit and closed his long position, as displayed here.
Please note that we always advise to find more confluence by additional indicators.
Recommended Settings
Swing Trading (1D chart)
Overlay
Bandwith: 45
Width: 2
SD Lookback: 150
SD Multiplier: 2
Base Chart
Bandwith: 45
SD Lookback: 150
SD Multiplier: 2
Fast-paced, Scalping (4min chart)
Overlay
Bandwith: 75
Width: 2
SD Lookback: 150
SD Multiplier: 3
Base Chart
Bandwith: 45
SD Lookback: 150
SD Multiplier: 2
Notes
The Kernel Regression Oscillator on the Base Chart is also sensitive to divergences if that is something you are keen on using.
For maximum confluence, it is recommended to use the indicator both as a chart overlay and in its Base Chart.
Please pay attention to shaded areas with Standard Deviation settings of 2 or 3 at their outer borders, and consider action only with high confidence when both parts of the indicator align on the same signal.
This tool shows its best performance on timeframes lower than 4 hours.
Traders are encouraged to test and determine the most suitable settings for their specific trading strategies and timeframes.
The trend following functionality is indicated through the "𝓢𝓲𝓰𝓷𝓪𝓵 𝓦𝓪𝓿𝓮" Line, with optional "Up" and "Down" arrows to denote trend directions only (toggle “Show Trend Signals”).
Methodology
The Kernel Regression Oscillator takes three distinct kernel regression functions,
used at similar weight, in order to calculate a balanced and smooth composite of the regressions. Part of it are:
The Epanechnikov Kernel Regression: Known for its efficiency in smoothing data by assigning less weight to data points further away from the target point than closer data points, effectively reducing variance.
The Wave Kernel Regression: Similarly assigning weight to the data points based on distance, it captures repetitive and thus wave-like patterns within the data to smoothen out and reduce the effect of underlying cyclical trends.
The Logistic Kernel Regression: This uses the logistic function in order to assign weights by probability distribution on the distance between data points and target points. It thus avoids both bias and variance to a certain level.
kernel(source, bandwidth, kernel_type) =>
switch kernel_type
"Epanechnikov" => math.abs(source) <= 1 ? 0.75 * (1 - math.pow(source, 2)) : 0.0
"Logistic" => 1/math.exp(source + 2 + math.exp(-source))
"Wave" => math.abs(source) <= 1 ? (1 - math.abs(source)) * math.cos(math.pi * source) : 0.
kernelRegression(src, bandwidth, kernel_type) =>
sumWeightedY = 0.
sumKernels = 0.
for i = 0 to bandwidth - 1
base = i*i/math.pow(bandwidth, 2)
kernel = kernel(base, 1, kernel_type)
sumWeightedY += kernel * src
sumKernels += kernel
(src - sumWeightedY/sumKernels)/src
// Triple Confirmations
Ep = kernelRegression(source, bandwidth, 'Epanechnikov' )
Lo = kernelRegression(source, bandwidth, 'Logistic' )
Wa = kernelRegression(source, bandwidth, 'Wave' )
By combining these regressions in an unbiased average, we follow our principle of achieving confluence for a signal or a decision, by stacking several edges to increase the probability that we are correct.
// Average
AV = math.avg(Ep, Lo, Wa)
The Standard Deviation bands take defined parameters from the user, in this case sigma of ideally between 2 to 3,
to help the indicator detect extremely improbable conditions and thus take an inversely probable signal from it to forward to the user.
The parameter settings and also the visualizations allow for ample customizations by the trader. The indicator comes with default and recommended settings.
For questions or recommendations, please feel free to seek contact in the comments.