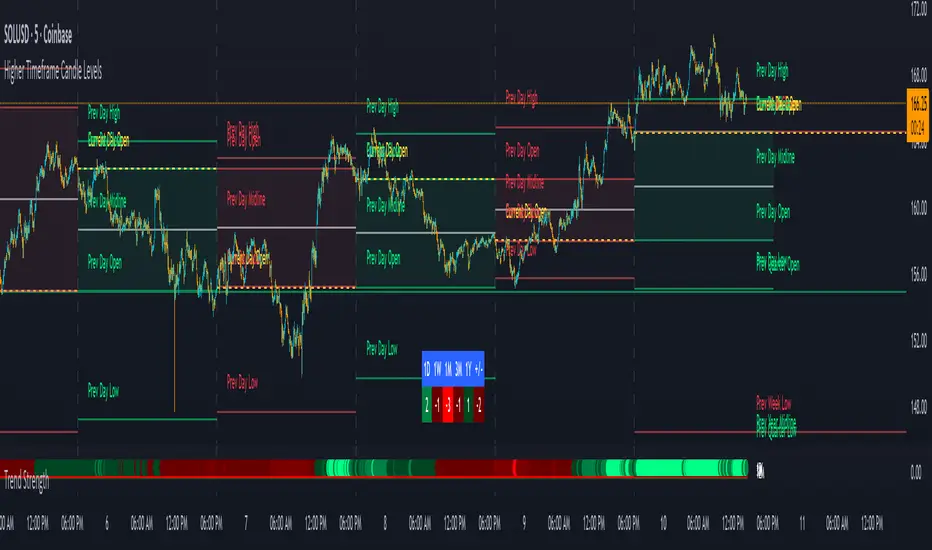
Breakout ScannerThis is a Breakout Scanner that shows you the immediate trend across 4 higher timeframes for up to 10 different tickers. It calculates a score from 1 to 3 for bullish and -1 to -3 for bearish based on where price is currently at compared to the previous higher timeframe’s candle levels.
When price is breaking out of the previous higher timeframe candle’s range, then it will have a score of 3 for bullish breakout or -3 for bearish breakout. When price is above the high or below the low of multiple different higher timeframe candles, you can expect price to continue the breakout and move to a new area of price range.
The brighter red or green the color is, the stronger the trend is on that timeframe. When it shows a bright green or red box on the far right side of a ticker, it is notifying you that the ticker is bullish or bearish on all timeframes and trending strongly, so switch over to that chart and look to trade in the direction of that trend.
The tickers, colors and time frames can be customized to suit your preference and you can also turn off as many tickers or time frames as you’d like if you want less tickers or time frames to show up on the indicator. It also includes alerts for when all timeframes are bullish or all timeframes are bearish for one ticker.
Make sure to keep each timeframe set to a timeframe that is higher than your chart timeframe.
Bullish Scoring & Colors
If the current candle close is above the midline of the higher time frame candle, it is given a score of 1 and a dark green background. If the current candle close is above the higher timeframe candle body, then it is given a score of 2 and a medium green background. If the current candle close is above the high of the higher time frame candle, it is given a score of 3 and a bright green background.
The higher the score the stronger the bullish trend and the brighter green the color will be.
Bearish Scoring & Colors
If the current candle close is below the midline of the higher timeframe candle, it is given a score of -1 and a dark red background. If the current candle close is below the higher timeframe candle body, then it is given a score of -2 and a medium red background. If the current candle close is below the low of the higher timeframe candle, it is given a score of -3 and a bright red background.
The lower the score, the stronger the bearish trend and the brighter red the color will be.
Total Score Display
On the right side of the indicator table, there is a column that displays the total score by adding all the scores together so you can easily tell the overall strength of the trend across all timeframes. Wait for the trend score to be at least 75% of the possible score to trade so you can ensure you are only trading very strong trends and increase your probability of winning your trade. The total score will update according to how many time frames you have enabled in the settings. You can also turn on or off the total score count if you prefer. The default setting is off.
All Timeframe Trends Agree
When all of the timeframes that you have turned on are in the same direction at the same time, a green or red box will appear on the far right side of the scanner. This is a visual cue that lets you know the strongest trending markets without having to read any of the numbers. Make sure to check out the charts for the markets that have a green or red box on the far right side and look for potential trend trading opportunities.
Alerts
You can set alerts for when all time frames for a certain ticker are bullish or bearish. If you have some time frames turned off at the time of creating your alerts, then it will only require all time frames that are on to be all bullish or bearish to generate an alert. Make sure to set your alerts to once per bar close to ensure you don’t get premature alerts that aren’t yet valid.
Best Way To Use The Scanner
For best results, make sure you wait for the trend to show all bullish or all bearish at the same time and then look to trade in the direction of the strong trend. If you can be patient enough to do that, you will increase the probability of winning your trade because you are trading with the direction of the overall higher timeframe trend when the market is trending strongly and making new highs or lows.
When one of the markets in the scanner shows all timeframes trending, go to that chart and see how price action is reacting to the previous higher timeframe candle levels. You can see those levels easily by adding our Higher Timeframe Candle Levels indicator to your chart and using the same timeframes as your Breakout Scanner is using.
If price is holding the higher timeframe candle levels well, then look to place trades in the direction of the trend that the Breakout Scanner is showing.
Other Indicators To Pair This With
Use this in combination with our Higher Timeframe Candle Levels indicator so you can see all of these levels being used to calculate the trend strength scores and watch how price reacts to those levels. You should also use our Trend Strength Indicator to easily read the historical trends of price compared to the higher timeframes and use those trends to guide you on when to trade and which direction to trade.
Trend Strength Indicator, Higher Timeframe Candle Levels and the Breakout Scanner all use the same levels to calculate the trend scores so they are designed to work all together to help you quickly be able to read a chart and find what direction to trade in.
Sentiment

Trend Strength IndicatorThis is a Trend Strength Indicator that shows you the immediate trend and historical trend of price for up to 7 higher timeframes.
It shows the strength of each timeframe by showing a red or green dot based on where price is at compared to the previous higher timeframe candle. The brighter red or green the dot is, the stronger the trend is compared to that higher timeframe candle.
The colors and timeframes can be customized to suit your preference and you can also turn off as many timeframes as you’d like if you want less time frames to show up on the indicator.
It also includes alerts for when all timeframes are bullish or all timeframes are bearish.
Keep these timeframes set to higher time frames than your chart so you can trade in the direction of the overall higher timeframe trend.
Bullish Scoring & Colors
If the current candle close is above the midline of the higher time frame candle, it is given a score of 1 and a dark green dot. If the current candle close is above the higher timeframe candle body, then it is given a score of 2 and a medium green dot. If the current candle close is above the high of the higher time frame candle, it is given a score of 3 and a bright green dot.
The higher the score the stronger the bullish trend and the brighter green the dot will be.
Bearish Scoring & Colors
If the current candle close is below the midline of the higher timeframe candle, it is given a score of -1 and a dark red dot. If the current candle close is below the higher timeframe candle body, then it is given a score of -2 and a medium red dot. If the current candle close is below the low of the higher timeframe candle, it is given a score of -3 and a bright red dot.
The lower the score, the stronger the bearish trend and the brighter red the dot will be.
Trend Scoring Modes
We gave you the option to set the trend scoring mode to either score based on price above or below the midline for quick and easy trend identification, or using the midline, candle body and highs and lows to give you a more detailed view of the trend strength. You can switch between these modes by selecting your preferred mode in the settings panel. The default is Open, High, Low, Close + Midline.
Sending Trend Direction To External Indicators
We coded in the ability to use the trend strength score as a signal that you can use to filter other indicators. This feature is great for notifying signal generating indicators what direction the market is trending in so that the signal generating indicator only gives signals in the direction of the trend.
This feature works by providing a data output of 1, 0 or -1. 1 means the trend is bullish, 0 means the trend is neutral and -1 means the trend is bearish.
This score is calculated by using the score of each timeframe that is turned on and checking if all timeframes are in the same direction or not. So if 3 timeframes are turned on and they are all bullish, the indicator will provide a data output of 1. This tells your external indicators that the trend is bullish.
This data output can be found in the data window and is labeled Trend Direction To Send To External Indicators.
At the bottom of the settings panel, there is a setting called Trend Score Threshold For External Indicators. This setting is the score threshold that all timeframes will need to meet to allow a trend strength signal to go through. So if set to 1, then all timeframes must be scored 1 or higher for bullish or -1 or lower for bearish. If set to 2, then all timeframes must be 2 or higher for bullish or -2 or lower for bearish. If set to 3, then all timeframes must be 3 for bullish or -3 for bearish. If all timeframes have met this threshold, then a bullish or bearish signal can be sent to your external indicator as a trend filter.
Labels
There are labels to the right of each row of dots, telling you which timeframe is which so you can easily identify what timeframe each row is showing the trend for.
Alerts
You can set alerts for when all timeframes are bullish or when all timeframes are bearish. If you have some time frames turned off at the time of creating your alerts, then it will only require all timeframes that are on to be all bullish or bearish to generate an alert. Make sure to set your alerts to once per bar close to ensure you don’t get premature alerts that aren’t yet valid.
Backtesting
This indicator helps you quickly identify and backtest the trend direction, how strong that trend is on multiple timeframes and helps you spot reversals and trend continuations. Make sure you look back at a lot of historical data to see how price moves when trend changes take place and how well price continues in each direction compared to the overall trend. This will help you gain confidence in reading the indicator and using it to your advantage when trading.
Best Way To Use The Indicator
This indicator is designed to help you quickly identify the trend on various different timeframes. The brighter the green dots are, the stronger the bullish trend is. The brighter the red dots are, the stronger the bearish trend is.
Trade in the direction of the trend. If the colors are mixed green and red, then price is likely to chop back and forth, so only trade the extremes of the ranges when that happens.
When most of the lower timeframe dots are the same color, that means it is a strong trend and you should place trades in the direction of the trend to be safe. The lower timeframes will start trending before the higher timeframes, so take notice of the lower timeframe colors starting to agree with each other and then take advantage of the trend that is forming.
You can also spot reversals with this indicator by watching for the lower timeframes to start changing color after a strong trend in one direction. The lower timeframes will start to change color one by one, indicating that the trend is actually changing direction.
For best results, make sure you wait for the trend to show all bullish or all bearish at the same time before you place any trades. If you can be patient enough to do that, you will increase the probability of winning your trade because you are trading with the direction of the overall higher timeframe trend which is typically an easy way to win more trades. Of course wait for pullbacks during the trend so you can keep a tight stop loss after entering your trade.
If you are scalping, you can turn off the higher timeframes and just use the 1 hour through 1 day. This won’t be as reliable as using all timeframes and waiting for them to align, but it is suitable for scalping quick intraday movements.
Other Indicators To Pair This With
Use this in combination with our Higher Timeframe Candle Levels indicator so you can see all of these levels being used to calculate the trend strength scores and watch how price reacts to those levels. You should also use our Breakout Scanner to find other markets with strong trends so you always know which market is trending the strongest and can trade those. Trend Strength Indicator, Higher Timeframe Candle Levels and the Breakout Scanner all use the same levels and calculate the trend scores the same way so they are designed to work all together to help you quickly be able to read a chart and find what direction to trade in.
High/Low from Set Period with LabelsMark high and low from a set period.
I use it to mark Overnight Low and High of FDAX instrument, to achieve that :
- you need to use candle chart
- you need to use regular trading hours ( to include overnight trades )
- you need to set that on M2 timeframe
- you need to set time begin : 17:30
- you need to set time end : 08:58
- when it will be drawn in 09:02, then let extend it via a hand and then you can disable
Issues :
- it will be visible after finished miminum period time :
-- after 2 minutes on M2 ( 9:02 )
-- after 5 minutes on M5 ( 9:05 )
etc ...

DAX Sectors OverviewIt's a table with a realtime read of DAX sectors, their changes in the day, weight for the whole DAX index.
Weights are fixed values defined in the script - recommended to refresh them periodically.

TrendMaster V2TrendMaster V2 is a comprehensive Pine Script indicator designed for TradingView. It combines multiple technical indicators and an advanced scoring logic to provide actionable trading signals. The script is highly customizable, allowing users to adjust trading modes, color themes, and signal filters according to their preferences and risk tolerance.
Key Features
Composite Scoring System:
The script calculates a composite score based on trend, momentum, pattern recognition, volume, volatility, divergence, Pearson correlation, and the CCI index. This score helps identify the best buy or sell opportunities.
Customizable Parameters:
Users can choose between “Aggressive,” “Balanced,” or “Conservative” trading modes, adjust indicator periods, and customize the color scheme of all visual elements.
Confluence Analysis:
The script evaluates the number of matching bullish or bearish signals, providing a confluence summary for higher-confidence trades.
Visual Signals:
Clear visual cues (triangles, circles, crosses) are displayed on the chart for strong buy/sell signals, confluences, and divergences.
Information Panels:
Two panels display real-time data such as score, RSI, volume, volatility, Pearson, CCI, trend, signal, and mode, along with the confluence status for quick reference.
Alert Conditions:
The script supports alerts for strong buy/sell signals, confluences, and divergences.
How It Works
Main Configuration:
Users select a trading mode (Aggressive, Balanced, or Conservative) and a color theme (Dark or Light).
Custom colors can also be set for bullish, bearish, strong, neutral, and signal elements.
Technical Indicators
Moving Averages (SMA/EMA) for trend analysis.
RSI to assess momentum and overbought/oversold conditions.
MACD for trend confirmation.
Volume and Volatility (ATR) for market activity evaluation.
Advanced Indicators
Pearson Correlation to measure trend strength.
CCI for cyclic momentum analysis.
Pattern Recognition
The script identifies common bullish and bearish reversal patterns (e.g., engulfing, hammer, morning/evening star) and continuation patterns (e.g., three white soldiers/black crows).
Composite Score
Each indicator contributes to a composite score, weighted according to the selected trading mode.
The score determines the strength of buy/sell signals.
Confluence Analysis
The script counts the number of matching bullish or bearish signals, providing a confluence summary for higher-confidence trades.
Visual Signals and Alerts
Strong buy/sell signals: triangles
Confluence signals: circles
Divergences: crosses
Alerts are triggered for strong buy/sell signals, confluences, and divergences.
Usage Instructions
Add the script to your TradingView chart.
Adjust the settings in the configuration panel to match your trading style.
Monitor the information panels and visual signals to spot trading opportunities.
Set up alerts for your preferred signal types.

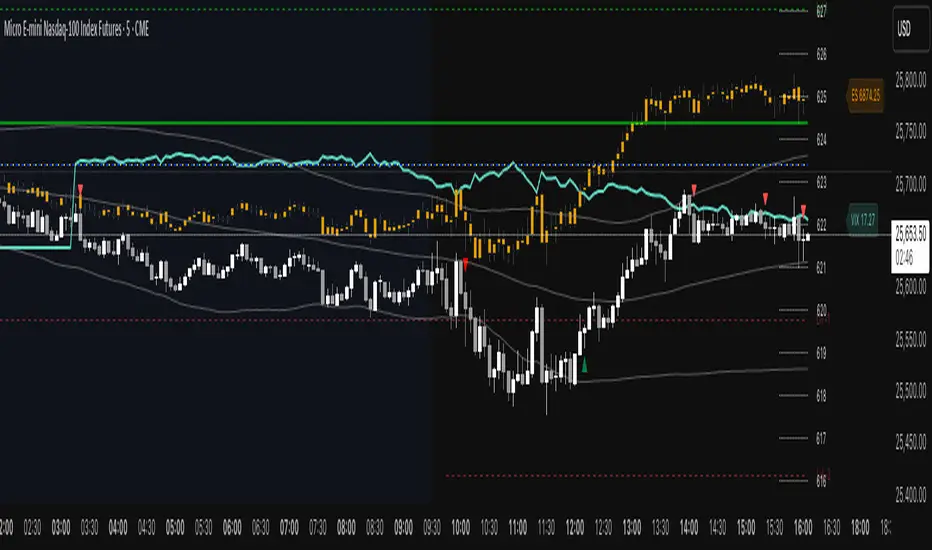
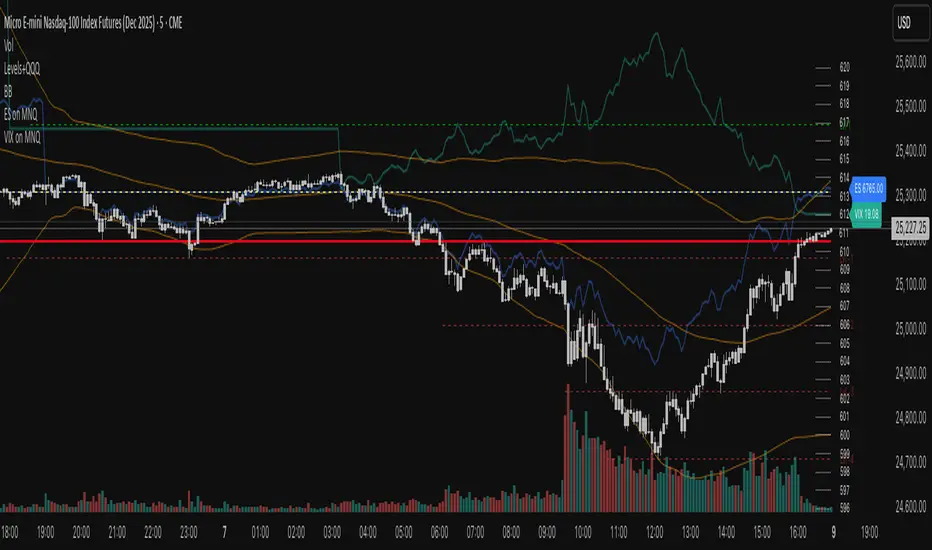
ES VIX on MNQ🧭 ES + VIX Overlay on MNQ
This indicator overlays the ES (S&P 500 futures) and VIX (Volatility Index) directly on the MNQ (Micro Nasdaq Futures) chart, allowing traders to visualize in real time the correlation, divergence, and volatility influence between the three instruments.
⸻
⚙️ How It Works
• The VIX is dynamically rescaled to the MNQ’s daily open, so its moves appear on the same price scale.
• The ES line is projected based on its percentage move relative to the session open (18:00 NY).
• Both are plotted in sync with MNQ to expose relative strength and divergence zones that often precede strong directional moves.
⸻
🧩 Inputs
• VIX Symbol: choose between VIX, CBOE:VIX, TVC:VIX
• Invert VIX Correlation: flips the VIX line for inverse-correlation setups
• VIX Step: controls how sensitively the VIX moves on the MNQ scale
• ES Symbol: defines the ES contract (e.g. ES1!)
• Show Signals: toggles on/off buy & sell markers
• Step (points): minimum distance between MNQ and VIX for a valid signal
• Block Signals: disables signals between 16:15 – 03:15 (illiquid hours)
⸻
💡 Signal Logic
The system tracks crossings between MNQ and the projected VIX line:
• Buy signal → when MNQ crosses above the VIX and expands upward by ≥ X points.
• Sell signal → when MNQ crosses below the VIX and expands downward by ≥ X points.
A time filter avoids noise during low-volume sessions.
⸻
📊 Visual Guide
• Cyan line = VIX on MNQ scale
• Orange line = ES on MNQ scale
• Labels on the right = current VIX / ES values
• BUY/SELL markers = potential volatility-based reversals
⸻
🚀 Practical Use
Perfect for traders who monitor:
• VIX–price divergence
• ES vs MNQ momentum confirmation
• Early volatility expansions before trend moves
⸻
💬 Core Idea:
“Volatility leads — price confirms.”
ES on MNQES on MNQ — ES percent-move overlay on the MNQ price scale.
Overview
This indicator projects the ES’s intraday percent change since session open onto the MNQ price scale. At the session start (18:00 chart time), it stores the ES open and the MNQ open, tracks ES’s percentage move from that anchor, and applies the same percent move to the MNQ open. The result is a single line that behaves like ES but is plotted in MNQ points—useful for spotting convergence/divergence, failed breaks, and mean-reversion setups between ES and MNQ.
How it works
1. Detects session open (18:00 on your chart).
2. Saves ES_open and MNQ_open.
3. Computes pct = (ES_close - ES_open) / ES_open.
4. Plots MNQ_open * (1 + pct) as the ES-on-MNQ line.
A label on the last bar shows the current ES value for quick reference.
Inputs
• ES Symbol: default ES1! (change if you use a different continuous).
• Line Color: color of the overlaid ES-on-MNQ line.
Works best on intraday timeframes and when your chart’s session aligns with ES.
Why it’s useful
• Highlights divergences (MNQ decoupling from ES baseline).
• Aids confirmation on pullbacks/breakouts when MNQ’s move disagrees with the ES-based projection.
• Helps risk control by flagging stretches likely to revert toward the ES-anchored path.
Notes & limitations
• This is a percent-rebasing overlay, not a hedge ratio, fair value, or spread model.
• Session/timezone settings matter; if your feed doesn’t print exactly at 18:00 on a higher timeframe, use a smaller TF or adjust session settings.
• Minor differences between ES (full) and MNQ (micro) and data latency can create small offsets.
Disclaimer
For educational use only. Not financial advice. Use proper risk management.
VIX on MNQVIX on MNQ — VIX percent-move overlay on the MNQ price scale (daily-open anchor, optional inversion)
Overview
This indicator projects the VIX’s intraday percent change from the daily open onto the MNQ price scale. It takes today’s open for both VIX and MNQ, measures the VIX’s percentage move since that open, optionally inverts it (given the typical inverse relationship), and applies a scale factor to fit that move onto MNQ’s price axis. The result is a single line that reflects VIX dynamics but is plotted in MNQ points—great for reading risk-on/risk-off tone, spotting divergences, and timing mean-reversion around volatility spikes.
How it works
• Fetches VIX close on your chart timeframe and today’s open for VIX and MNQ.
• Computes pct = (VIX_close − VIX_open) / VIX_open.
• Optionally multiplies by −1 (invert) and then by a Scale Factor to compress amplitude.
• Plots MNQ_open * (1 + pct * (invert? −1 : 1) * scaleFactor) as the VIX-on-MNQ line.
• Adds a last-bar label with the current VIX value and a small info panel (VIX, % change, scaled level).
Inputs
• VIX Symbol: VIX, CBOE:VIX, or TVC:VIX (pick the one that matches your data feed).
• VIX Line Color: color of the overlay line.
• Invert VIX: flip the sign to reflect inverse correlation with MNQ.
• Scale Factor (default 0.05): tune how much of the VIX move is mapped onto MNQ points.
Why it’s useful
• Surfaces volatility-led divergences: when MNQ’s path disagrees with VIX’s risk signal.
• Helps confirm/fade breakouts and pullbacks during volatility expansions/compressions.
• Provides a quick, visual “volatility baseline” directly on the MNQ chart without juggling two panes.
Notes & limitations
• This is a percent-rebased overlay, not a hedge ratio, fair value, or spread model.
• It anchors to the current day’s open; session/timezone settings and your VIX symbol choice (CBOE:VIX vs TVC:VIX) can affect exact prints.
• The scale factor is intentionally manual—adjust until the overlay’s swings are visually informative for your setup.
Disclaimer
For educational use only. Not financial advice. Always manage risk.

Relative Strength vs Benchmark SPYRelative Strength vs Benchmark (SPY)
This indicator compares the performance of the charted symbol (stock or ETF) against a benchmark index — by default, SPY (S&P 500). It plots a Relative Strength (RS) ratio line (Symbol / SPY) and its EMA(50) to visualize when the asset is outperforming or underperforming the market.
Key Features
📈 RS Line (blue): Shows how the asset performs relative to SPY.
🟠 EMA(50): Smooths the RS trend to highlight sustained leadership.
🟩 Green background: Symbol is outperforming SPY (RS > EMA).
🟥 Red background: Symbol is underperforming SPY (RS < EMA).
🔔 Alerts: Automatic notifications when RS crosses above/below its EMA — signaling new leadership or weakness.
How to Use
Apply to any stock or ETF chart.
Keep benchmark = SPY, or switch to another index (e.g., QQQ, IWM, XLK).
Watch for RS crossovers and trends:
Rising RS → money flowing into the asset.
Falling RS → rotation away from the asset.
Perfect for sector rotation, ETF comparison, and momentum analysis workflows.

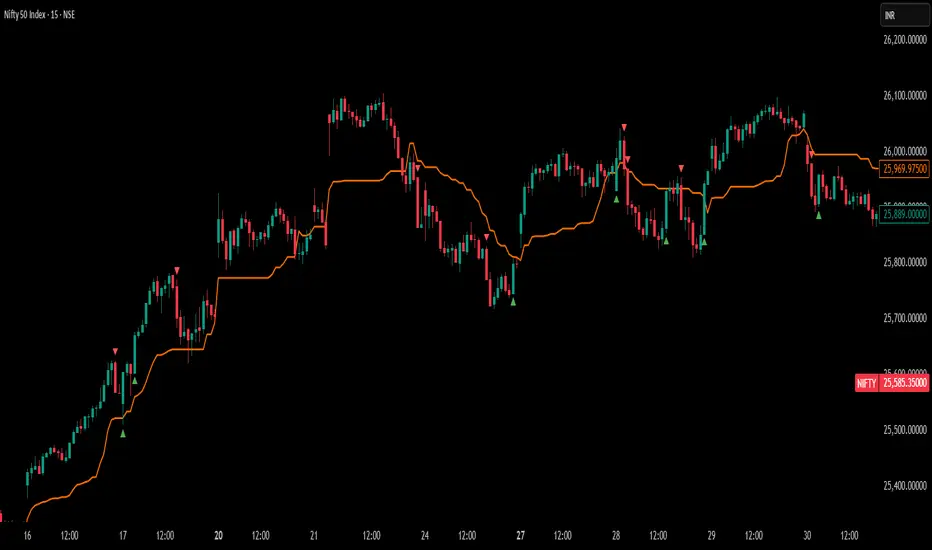
Option Selling Indicator @mybullandbearThe Option Selling Indicator is designed to help traders identify high-probability buy and sell zones based on market momentum and trend conditions. It provides a simple yet powerful visual cue system to make trading decisions clear and intuitive.
🎯 How It Works:
When the background turns green and the price moves above the black trend line, it signals bullish strength — a good condition to go for BUY or sell PUT options.
When the background turns red and the price moves below the black trend line, it signals bearish strength — a good condition to go for SELL or sell CALL options.
⚙️ Key Features:
Clear color-coded background for instant trend visualization.
Dynamic black trend line acts as a support/resistance guide.
Simple setup suitable for both beginners and experienced option sellers.
Works effectively across multiple timeframes and instruments.
💡 Usage Tip:
Combine this indicator with volume or volatility filters for more accurate entries, and always confirm signals with your trading strategy and risk management rules.

RSI Heatmap (≤35 Highlight)Highlights when RSI is less than or equal to 35 which can signal a potential reversal soon.

Risk-On / Risk-Off Toolkit [SB1] (NQ, RTY, YM) VIXDescription:
The Risk-On / Risk-Off Toolkit is a professional-grade market context indicator designed to help traders quickly identify broad market sentiment shifts and gauge risk appetite. By combining major US equity futures (NQ, RTY, YM) with VIX dynamics, this toolkit provides clear visual signals of “Risk-On” (bullish, lower volatility environment) and “Risk-Off” (bearish, higher volatility environment) conditions. This is ideal for traders using discretionary analysis, swing strategies, intraday scalping, or portfolio positioning decisions.
My Personal Thoughts: Utilize all 3 charts to Identify which is Leading and who is lagging between the 3 (NQ, RTY, YM) Key Features:
Futures Trend Analysis:
Monitors the Nasdaq 100 (NQ), Russell 2000 (RTY), and Dow Jones (YM) futures in real-time.
Determines bullish/bearish bias based on each futures contract’s current close relative to its open.
Identifies when all three indices are moving in sync, highlighting broad market directional alignment.
VIX Confirmation:
Integrates the CBOE Volatility Index (VIX) to gauge market risk sentiment.
Confirms Risk-On conditions when VIX is falling while all three futures are bullish.
Confirms Risk-Off conditions when VIX is rising while all three futures are bearish.
Optional background shading visually highlights Risk-On (green) and Risk-Off (red) conditions for quick, intuitive assessment.
Strong Body Candle Signals:
Detects high conviction candlestick moves where the body represents at least 85% of the total range.
Confirms whether the candle closes near its extreme (top for bullish, bottom for bearish) within 15% of the range.
Plots arrows for strong bullish or bearish candles:
Green triangle-up for bullish strong candles
Red triangle-down for bearish strong candles
Provides a visual cue for intraday or swing traders to confirm trend momentum without cluttering the chart with labels.
Alert System:
Alerts can be set for Risk-On alignment: all monitored futures are bullish and VIX is falling.
Alerts can also be set for Risk-Off alignment: all monitored futures are bearish and VIX is rising.
Ensures traders never miss shifts in broad market sentiment, suitable for both intraday and end-of-day review.
Table Summary:
Provides a top-right summary table of each monitored market and VIX:
Displays Index Name and Current Bias (Bullish/Bearish/Neutral).
Highlights bullish conditions in green and bearish conditions in red.
Includes VIX status as “↓ Falling”, “↑ Rising”, or “Flat”, providing a quick visual reference of volatility trends.
Customizable Visuals:
Control the visibility of strong candle arrows.
Maintains dynamic bar coloring for strong candle moves (green for bullish, red for bearish).
How to Use the Risk-On / Risk-Off Toolkit:
Trend Confirmation: Use the alignment of NQ, RTY, and YM to determine whether the overall market environment is bullish or bearish.
Risk Sentiment Filter: Use VIX confirmation to identify if traders are in a risk-on or risk-off sentiment. This is especially useful for adjusting position sizing, hedging, or timing entries.
Momentum Validation: Strong candle arrows indicate decisive moves, providing additional confirmation for trade entries, breakouts, or trend continuation.
Alerts & Visual Cues: Set alerts to be notified whenever Risk-On or Risk-Off conditions are met, helping you act in real-time.
Quick Reference: Use the summary table for a bird’s-eye view of market alignment across indices and VIX, avoiding the need to track multiple charts simultaneously.
Why This Indicator is Unique:
Combines three major US indices with volatility confirmation to identify true macro market sentiment shifts.
Provides both visual and alert-based signals for actionable insights.
The inclusion of strong candle arrows gives intraday and swing traders a clear, low-latency cue for high-probability moves.
Perfect for multi-timeframe analysis and adaptable to both short-term and long-term strategies.
Indicator Name Justification:
The name “Risk-On / Risk-Off Toolkit ” accurately reflects the core function: identifying broad market risk appetite and sentiment alignment across key indices with volatility confirmation. It communicates instantly that the tool helps traders understand when the market is favoring risk-taking (Risk-On) versus risk-aversion (Risk-Off).

Liquidation Reversal Signals [AlgoAlpha]🟠 OVERVIEW
This tool detects potential liquidation-driven reversals by combining z-score analysis of up/down volume with the classic Supertrend. It watches for abnormal surges in directional volume (on a lower timeframe) and links them to trend flips on the main chart. When both align within a short window, it flags a probable reversal caused by forced liquidations. The goal is to help traders identify exhaustion points where aggressive liquidation moves may mark the end of a trend leg.
🟠 CONCEPTS
The logic revolves around Z-score normalization of up and down volume to locate statistical extremes. When up-volume z-scores exceed a threshold during a bearish Supertrend, it implies trapped shorts being squeezed; the opposite applies for long liquidations. The script tracks these liquidation spikes and monitors whether a Supertrend regime change follows soon after. If confirmed within the allowed timeout, a colored signal marks the event.
In essence:
Z-score outliers = potential forced liquidations.
Supertrend = structural regime context.
Combined = statistically confirmed reversal signals, not random flips.
This pairing reduces false positives by ensuring that both volatility structure and order-flow extremes agree before flagging a reversal.
🟠 FEATURES
Z-score detection for liquidation spikes with adjustable lookback and threshold.
Confirmation logic linking liquidations to Supertrend flips.
Alerts for liquidation spikes and confirmed reversal starts.
On-chart “No Volume” warning to avoid misreads on illiquid assets.
🟠 USAGE
Setup : Add the script to your main chart. Choose a lower timeframe (default 15m) to capture more granular liquidation flows. Adjust Z-Score Length to control how far back the script measures normal behavior and Threshold to decide what counts as extreme. Keep Timeout Bars low (e.g. 20–50) for faster reversals, or higher for slower markets.
Read the chart :
• Circles appear below bars when long liquidations occur; above bars for short liquidations.
• A Supertrend flip with a recent liquidation spike will display an arrow and color shift.
• Fills between candles and trend lines show which side dominates: green for bullish reversal, red for bearish.
• Candle color fades based on the magnitude of liquidation pressure.
Settings that matter :
• Z-Score Length : Longer smooths noise but delays signal; shorter reacts faster.
• Z-Score Threshold : Higher means only extreme liquidations trigger; lower finds smaller squeezes.
• Timeout Bars : Defines how long after a liquidation the Supertrend flip remains valid.
• Lower Timeframe : Determines the precision of volume readings; too low may increase noise.


Quantum Leap by GSK-Vizag-AP-IndiaQuantum Leap by GSK-Vizag-AP-India
This indicator detects strong impulse price movements, also known as "quantum leaps," in bullish and bearish directions. Using the Average True Range (ATR) to measure market volatility, it identifies candles with body sizes significantly larger than recent average ranges, suggesting strong momentum surges.
The script groups consecutive impulse candles into blocks, highlighting zones of sustained bullish or bearish strength on the chart. These visual blocks aid traders in quickly spotting powerful price moves that may indicate key market shifts or reversals. Additionally, this tool can be effectively used to identify Fair Value Gaps (FVG) in price action, making FVG detection easier and more intuitive for users.
Inputs allow customization for ATR length, impulse strength threshold, and minimum consecutive candles, enabling adaptation to different markets or timeframes.
Important Disclaimer:
This indicator is for educational and informational purposes only. It is not financial advice and does not guarantee future results. Users should conduct their own research and seek professional guidance before making any trading decisions. Trading involves risk, including the potential loss of capital.
NQ YM Correlogram Meter TypeOverview
This indicator provides a real-time, visual "meter" of the correlation between the Nasdaq 100 (NQ) and the Dow Jones (YM) futures. It is designed as a clean, non-intrusive dashboard panel that displays only the current correlation value, making it an ideal companion for pairs traders who need to see the live relationship at a glance.
Unlike a traditional oscillator that plots historical data, this tool focuses exclusively on the "right now" to aid in immediate trade decisions.
Key Features
Real-Time Correlation Meter: A single vertical bar displays the current correlation, visually mapping the -1.0 to +1.0 range.
Clear Visual Cues: The bar's color gradient (from red for negative correlation to green for positive correlation) and fill level provide an instant understanding of the market relationship.
Precise Value Display: The exact numerical correlation (e.g., 0.85 or -0.50) is shown clearly at the bottom of the meter.
Contextual Y-Axis: Static labels (+1.0, +0.5, 0.0, -0.5) provide quick reference points for the meter's reading.
Dashboard Panel: Renders cleanly as an overlay table on the right side of your chart, saving screen real estate.
How to Use
This indicator is best used as a confirmation tool alongside a primary pairs trading strategy or a historical correlation oscillator.
High Green Bar (near +1.0): Indicates a strong positive correlation. NQ and YM are moving in sync.
Bar near 0.0: Indicates little to no linear relationship.
Low Red Bar (near -1.0): Indicates a strong negative (inverse) correlation. NQ and YM are moving in opposite directions.
For a pairs trader, this meter provides an instant check to confirm if the two assets are in their expected state of correlation at the moment of execution.
Settings & Customization
Correlation Period: Set the lookback length for the correlation calculation.
Symbols: Fully customizable, though it defaults to YM1! and NQ1!.
Panel Appearance: Adjust the Table Size (Small/Large) and Chart Theme (Light/Dark).
Text Size: Independently control the font size for the numerical Value Text and the Y-Axis Labels to perfectly fit your display.

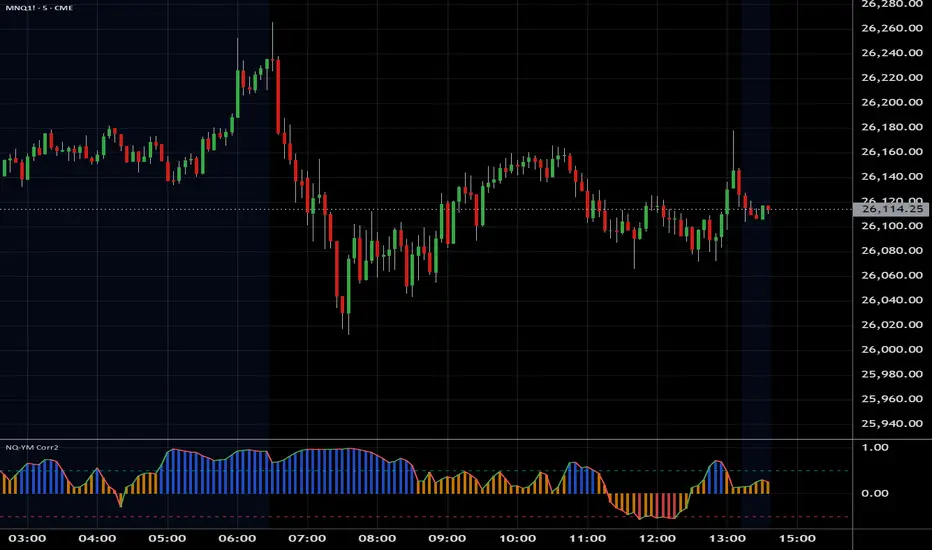
NQ YM Correlation 1 min dataOverview
This indicator plots the correlation between Nasdaq 100 (NQ) and Dow Jones (YM) futures. It is specifically designed to act as an "Engine RPM" gauge for pairs traders who trade divergence or spread breakouts—not mean reversion.
To ensure consistent readings, this indicator always calculates using a 1-minute timeframe data, regardless of the chart timeframe you are currently viewing.
The core idea is:
High Correlation (Blue Zone): "Low RPM" or "Engine Idle." NQ and YM are moving together. The spread is flat. This is a no-trade zone.
Low Correlation (Red Zone): "High RPM" or "Engine Hot." NQ and YM are diverging. The spread is moving. This is the primary trade zone.
Ethereum Sleepy Wallets – 6-Month DormancyWhat This Indicator Does
It measures how many Ethereum addresses have been completely inactive for at least 6 months (≥ 180 days) — using official Glassnode and CryptoQuant on-chain metrics.
This reveals deep conviction among long-term ETH holders
Core Concept: Direct 6-Month Dormancy
The indicator uses two precise on-chain signals:
Total Unique ETH Addresses
From GLASSNODE:ETH_ADDRESSES or CRYPTOQUANT:ETH_TOTAL_ADDRESSES
Counts every address ever used on Ethereum
Addresses Inactive ≥ 180 Days
From GLASSNODE:ETH_ADDRESSES_GREATER_THAN_180_DAYS
Counts every address that has not sent or received ETH in 6+ months
Sleepy ETH = Dormant ≥ 180 Days
Sleepy Ratio % = (Sleepy / Total) × 100
This is not an estimate — it’s direct, real dormancy.
Why 6-Month Dormancy Matters
Short-term activity (7-day) = noise from DeFi, NFTs, trading
180-day inactivity = true HODLing — coins untouched through entire market cycles
Historically:
Rising dormancy → supply drying up → bullish pressure
Falling dormancy → long-term holders selling → bearish warning
How It Works (Step-by-Step)
Fetches daily data from Glassnode (Pro+) or CryptoQuant (free)
Selects real data if available; otherwise uses robust fallback
Calculates raw sleepy wallets = addresses inactive ≥ 180 days
Smooths the signal with a 21-day simple moving average (SMA) to filter noise
Computes Sleepy Ratio % for instant conviction reading
Displays live info table with exact values on every bar
How to Use It
Signal
Interpretation
Suggested Action
Sleepy Ratio > 75% and rising
Extreme long-term HODLing
Strong accumulation — buy/hold
Smooth Sleepy trending up
Dormancy growing over 21 days
Bullish supply shock forming
Sleepy Ratio < 68% and falling
Long-term coins re-entering circulation
Caution — possible distribution
Smooth Sleepy dropping fast
HODLers breaking after 6+ months
Bearish warning — consider exits
Use on Daily (D) or Weekly (W) charts for clean, reliable signals.
Pro+ vs Free Mode
Mode
Data Source
Accuracy
Pro+ (Glassnode ON)
Real 180-day dormancy metric
100% precise
Free (Glassnode OFF)
CryptoQuant + price-scaled estimate
~80% historical correlation
Toggle in settings: Use Glassnode Data
What Makes This Indicator Original
First open-source script to directly plot Ethereum’s 6-month dormancy using official ADDRESSES_GREATER_THAN_180_DAYS
No fake math — uses true inactivity, not active address subtraction
Dual-source logic ensures usability on any TradingView plan
Dual output: raw sleepy count + 21-day SMA for precision and trend
Live info table shows real-time values and data source


[KF] Multi-Duration Rate Expectations IndicatorAfter last fed cut in Oct then following jump in rates, I was frustrated at not having access to good rate expectations vs actual because the market usually prices in prior to fed action. This indicator was developed to make futures market rate expectations accessible and interpretable without requiring professional bond analytics systems.
Summary
This Pine Script indicator reveals what the futures market expects for interest rates across three key durations: Fed Funds (overnight), 2-Year, and 10-Year Treasury yields. By comparing futures-implied rates against current spot yields, it provides a clear visual signal of whether the market expects rates to rise, fall, or remain steady.
Understanding Rate Futures
Fed Funds futures (ZQ1!) use a simple design where the expected rate equals 100 minus the futures price. If ZQ1! trades at 96.12, the market expects a 3.88% Fed Funds rate. Treasury futures work differently - they trade as bond prices (typically 102-115) that move inversely to yields. Converting Treasury futures to implied yields requires complex bond mathematics involving duration and conversion factors.
This indicator solves the Treasury futures complexity by implementing a self-calibrating sensitivity model. It observes the historical relationship between futures prices and yields, then uses this to project rate expectations. The model also compares front-month to next-month contracts to detect expected rate direction, automatically adapting as market conditions change.
How to Use
Add the indicator to any chart and select your desired duration in the settings. The display shows the futures-implied rate, current yield, and the difference between them. Green indicates the market expects higher rates, red means lower expectations, and gray shows expectations in line with current rates.
The indicator excels at identifying divergences between market expectations and current rates, which often precede rate movements or futures repricing. Comparing expectations across different durations reveals insights about yield curve positioning and Fed policy anticipation.
Technical Note
While Fed Funds futures provide exact rate expectations, Treasury futures conversions are sophisticated approximations that provide reliable directional signals and reasonable magnitude estimates sufficient for most trading applications.

VIX/VVIX Spike RiskVIX/VVIX Spike Risk Analyzer
The VIX/VVIX Spike Risk Analyzer analyzes historical VIX behavior under similar market conditions to forecast future VIX spike risk.
By combining current VIX and VVIX levels as dual filters, it identifies historical precedents and calculates the probability and magnitude of VIX spikes over the next 1, 5, and 10 trading days.
IMPORTANT: This indicator must be applied to the VIX chart (CBOE:VIX) to function correctly.
Methodology
1. Dual-Filter Pattern Matching
The indicator uses both VIX and VVIX as simultaneous filters to identify historically analogous market conditions:
By requiring BOTH metrics to match historical levels, the indicator creates more precise market condition filters than using VIX alone. This dual-filter approach significantly improves predictive accuracy because:
VIX alone might be at 15, but VVIX can tell us if that 15 is stable (low VVIX) or explosive (high VVIX)
High VVIX + Low VIX often precedes major spikes
Low VVIX + Low VIX suggests sustained calm
2. Tolerance Settings
VIX Matching (Default: ±10% Relative)
Uses relative percentage matching for consistency across different VIX regimes
Example: VIX at 15 matches 13.5-16.5 (±10%)
Can switch to absolute tolerance (±5 points) if preferred
VVIX Matching (Default: ±10 Points Absolute)
Uses absolute point matching as VVIX scales differently
Example: VVIX at 100 matches 90-110
Can switch to relative percentage if preferred
3. Historical Analysis Window
The indicator scans up to 500 bars backward (limited by VVIX data availability) to find all historical periods where both VIX and VVIX were at similar levels. Each match becomes a "sample" for statistical analysis.
4. Forward-Looking Spike Analysis
For each historical match, the indicator measures VIX behavior over the next 1, 5, and 10 days
Display Metrics Explained
Average Highest Spike
Shows the average of the maximum VIX spikes observed.
Highest Single Spike
Shows the single largest spike ever recorded
Probability No 10% Spike
Shows what percentage of historical cases stayed BELOW a 10% spike:
Probability No 20% Spike
Shows what percentage of historical cases stayed BELOW a 20% spike:
Note : You'll see many more shaded bars than the sample count because each match creates up to 5 consecutive shaded bars (bars 1-5 after the match all "look back" and see it).
Short Volatility Strategies:
Enter when there's a LOW probability of big vol spikes based on today's metrics
Long Volatility Strategies
Enter when there's a HIGH probability of big vol spikes based on today's metrics

Mum Formasyonları TespitiIt is used to detect candles.
It is designed to analyze all the candles that form.
The most frequently formed candles are displayed on the price chart.
