Smart RSI MTF [DotGain]Summary
Are you tired of constantly switching between timeframes to check the RSI, only to miss the bigger picture?
The Smart RSI MTF (Multi-Timeframe) is designed to solve this exact problem. It is a streamlined chart overlay that monitors RSI conditions across up to 10 different timeframes simultaneously —from the 1-minute chart all the way up to the Monthly view.
This indicator removes the need for multiple open tabs and declutters your analysis by plotting signals directly on your main chart using a smart "visual hierarchy" system based on transparency.
⚙️ Core Components and Logic
The Smart RSI MTF relies on a sophisticated 3-layer logic to deliver clear, actionable context:
Multi-Timeframe Engine: The script runs 10 independent RSI calculations in the background. It checks standard intervals (5m, 15m, 1h, 4h, Daily, Weekly, Monthly) to ensure you never miss a momentum extreme on any scale.
Classic RSI Thresholds:
Overbought (> 70): Indicates price may be extended to the upside.
Oversold (< 30): Indicates price may be extended to the downside.
Smart Visibility System (The "Secret Sauce"): Not all signals are equal. A 5-minute Overbought signal is "noise" compared to a Weekly Overbought signal. This indicator automatically applies Transparency to differentiate importance:
Minutes = High Transparency (Faint).
Hours = Medium Transparency.
Days/Weeks/Months = No Transparency (Solid/Bold).
🚦 How to Read the Indicator
The indicator plots shapes (Labels by default) directly above or below the candles. The appearance tells you the direction and the timeframe significance:
🟥 RED SIGNALS (Overbought Condition)
Trigger: RSI is above 70 on a specific timeframe.
Location: Placed above the candle bar.
Meaning: Potential bearish reversal or pullback.
🟩 GREEN SIGNALS (Oversold Condition)
Trigger: RSI is below 30 on a specific timeframe.
Location: Placed below the candle bar.
Meaning: Potential bullish reversal or bounce.
👻 TRANSPARENCY (Signal Strength)
Faint/Ghostly: The signal comes from a lower timeframe (e.g., 5m, 15m). Use for scalping or entry timing.
Solid/Bright: The signal comes from a major timeframe (e.g., Daily, Weekly). Use for swing trading and identifying major market turns.
Visual Elements
Symbol Shapes: Fully customizable (Label, Diamond, Circle, Triangle, etc.) via settings.
Stacking: If multiple timeframes trigger at once, symbols will overlay, creating a visually denser and darker color, indicating Confluence .
Key Benefit
The goal of the Smart RSI MTF is to help traders instantly spot Confluence . When you see a faint short-term signal align with a solid long-term signal, you have identified a high-probability reversal zone without leaving your chart.
Have fun :)
Disclaimer
This "Smart RSI MTF" indicator is provided for informational and educational purposes only. It does not, and should not be construed as, financial, investment, or trading advice.
The signals generated by this tool (both "Buy" and "Sell" indications) are the result of a specific set of algorithmic conditions. They are not a direct recommendation to buy or sell any asset. All trading and investing in financial markets involves substantial risk of loss. You can lose all of your invested capital.
Past performance is not indicative of future results. The signals generated may produce false or losing trades. The creator (© DotGain) assumes no liability for any financial losses or damages you may incur as a result of using this indicator.
You are solely responsible for your own trading and investment decisions. Always conduct your own research (DYOR) and consider your personal risk tolerance before making any trades.
Signals

Whale KitThe Whale Kit is an all-in-one trading toolkit created by ChartPrime, providing a powerful set of indicators and analytical tools. It’s designed with simplicity in mind—clean inputs, intuitive visuals, and straightforward logic—so traders of all experience levels can make informed, confident decisions. This guide gives an overview of each component within the Whale Kit for J Bravo and explains some of the deeper mechanics behind them.
Features of the Whale Kit
Whale Candles
Whale Candles offer a unique visualization of price action by color-coding candles based on their angle relative to previous movement. This allows traders to instantly recognize trend strength and momentum shifts. Users can enable or disable the Whale Candle theme with a single toggle.
Whale Sequential
The Whale Sequential is a refined take on the classic sequential, designed to better detect trend exhaustion. Instead of simply counting consecutive candles, the Whale Sequential analyzes trend angle, giving a more accurate picture of momentum.
By factoring in the slope of the trend—not just higher or lower closes—it can highlight when a trend is weakening even before the traditional 9-count would appear.
When a potential exhaustion is detected, the system prints a “9” along with an optional label for easier visibility. This upgraded angle-based approach often provides earlier and more reliable insight into trend fatigue compared to traditional methods.
Whale Fibonacci Bands
The Whale Fibonacci Bands combine Fibonacci mathematics with a proprietary weighted-average formula to create a dynamic, adaptive price channel. These bands help traders identify key support, resistance, and directional bias in real time.
The system applies the metallic mean (golden/silver mean variations) to the input series, shifting more weight toward recent price action. This results in a smoother, more responsive channel that adapts quickly to market changes while still respecting classical Fibonacci behavior.
The outcome is a highly reliable, intuitive set of bands that reflect both volatility and trend—giving traders a clear visual roadmap of where price is likely to react.
Moving Averages
The suite includes the Whale 9 Moving Average along with several structural moving averages such as the 200-day and 200-week MA. These are custom-tuned, lower-lag moving averages designed to react faster than standard MAs without excessive noise. Users can toggle each MA individually to tailor their chart to their trading style.
The Whale Screener
The Whale Screener allows users to quickly scan for conditions such as active 9-counts, price relative to the Whale 9 MA, above or below the 200-day MA, and readings derived from the Whale Bands. It offers a fast, simplified way to identify setups across multiple market environments.

Filter Ribbon1. Indicator Name
Filter Ribbon
2. One-line Introduction
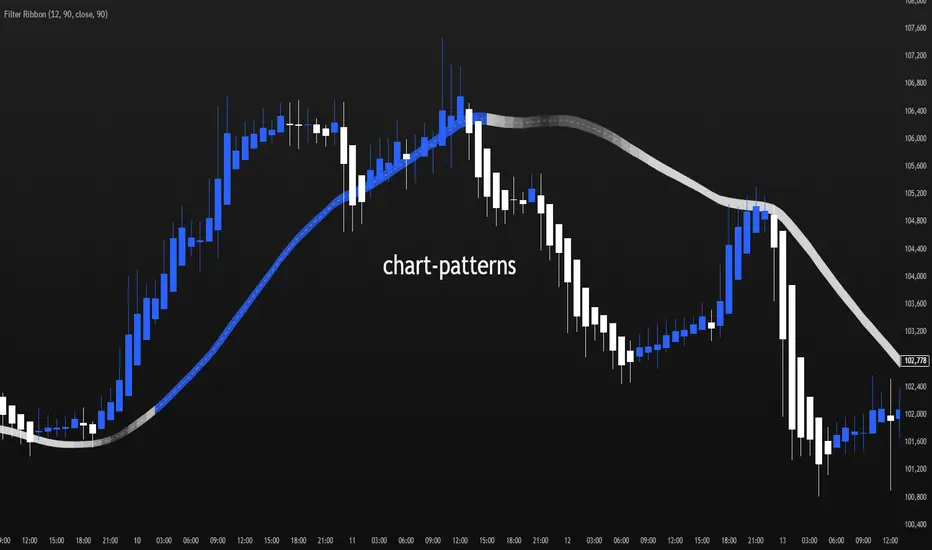
A trend visualization ribbon that uses linear regression and directional scoring to highlight bullish and bearish strength with intuitive color gradients.
3. General Overview
Filter Ribbon is a minimalistic yet powerful trend visualization tool that leverages linear regression slope ordering to determine directional momentum. It analyzes the ordering of regression values over a defined lookback period and quantifies how consistently the price has been trending upward or downward.
Using a pairwise comparison system, it calculates a trend "score" and compares this to a configurable threshold to determine if a bullish, bearish, or neutral condition exists.
The result is a color-coded ribbon that sits over the chart, changing hue and opacity based on both the direction and strength of the trend. The stronger the directional alignment, the more opaque the ribbon becomes, offering traders a fast, intuitive way to assess market sentiment at a glance.
It also includes an optional linear regression line to further help visualize the central trend.
This indicator is best used in trend-following systems or as a dynamic background layer when combined with signal-based strategies.
Thanks to its efficient design and protected logic, Filter Ribbon offers high-performance visualization without compromising strategy integrity.
4. Key Advantages
🌈 Visual Trend Heatmap
Dynamic color ribbon gives real-time visual feedback on both trend direction and strength.
🔢 Quantified Trend Scoring
Calculates a mathematically sound trend score using pairwise linear regression comparisons.
⚖️ Adjustable Sensitivity
Users can tune lookback and threshold parameters to fit different asset classes and timeframes.
📉 Smooth Ribbon Effect
Plots upper/lower bands around regression line with smooth filling for a professional chart look.
🎯 Precise Trend Confirmation
Acts as a confidence layer for other entry/exit signals by confirming broader trend bias.
🔒 Secure and Minimal Codebase
Core logic is embedded securely with minimal exposure, reducing risk of replication or misuse.
📘 Indicator User Guide
📌 Basic Concept
Filter Ribbon determines trend direction and intensity by comparing the order of linear regression values over time.
It forms a ribbon on the chart that changes color based on trend direction and opacity based on trend strength.
This makes it ideal for identifying clear trending periods vs. uncertain consolidations.
⚙️ Settings Explained
Lookback Period: Number of bars for scoring the trend direction (higher = smoother trend)
Range Tolerance (%): Determines how aggressive the trend classification is (lower = stricter)
Regression Length: Period for calculating the base linear regression line
Ribbon Colors: Customize colors for bullish and bearish conditions
📈 Bullish Timing Example
Ribbon color is green and becomes increasingly opaque
Regression line slopes upward and price remains above it
Can be used as trend confirmation for long trades
📉 Bearish Timing Example
Ribbon color is red with higher opacity
Price consistently below the regression line
Useful for confirming short trade setups or avoiding long entries
🧪 Recommended Use Cases
Combine with breakout indicators to validate if the breakout aligns with broader trend
Use in swing or trend-following strategies as a background filter
Helps filter out trades during unclear, sideways market conditions
🔒 Precautions
Not a signal generator on its own — meant for trend context only
Ribbon may lag slightly during sudden trend reversals; best used with reactive entry tools
Always test ribbon parameters on your specific market/timeframe before applying live
Avoid using solely in low-volatility or flat markets — sensitivity may require tuning
+++
[MTX] Weekly Support & Resistance Weekly Support & Resistance
Overview
Discover key market structure with this all-in-one indicator:
Weekly Support & Resistance (SR) levels , Fair Value Gap (FVG) detection , and Automatic Fibonacci retracements .
Designed for MTX traders, it plots non-repainting weekly highs/lows/opens/closes, highlights unmitigated FVGs for potential imbalances, and auto-draws Fib levels, Perfect for swing/day traders on XAUUSD.
🚀 Key Features
- Weekly SR Levels : Plots previous week's High (resistance), Low (support), Open, and Close. Optional historical levels (Week -2/-3).
- SR Zones : Customizable % zones around levels for dynamic support/resistance bands. Fill colors for easy visualization.
- FVG Detection : Identifies bullish (green) and bearish (red) Fair Value Gaps on your chart timeframe.
- buy/sell Signals :
- Trend Filter : Optional EMA/SMA to filter signals
- Auto Fibonacci : auto-retracement with 20+ levels (0%, 23.6%, 38.2%, 50%, 61.8%, 100%, extensions to 423.6%, negatives). Custom colors, labels, and background fills.
- Alerts: Built-in for FVG creation/mitigation + all buy/sell signals. Set up once for real-time notifications.
⚠️ Important Disclaimer
This indicator is for educational and analysis purposes only. It provides visual tools and signals based on historical price action— not financial advice. Past performance ≠ future results. Trading involves risk; use proper risk management. Backtest thoroughly. No guarantees of profitability. Consult a financial advisor.
#tradingview #smc #MTX #fvg #fibonacci #supportresistance

Hash Momentum IndicatorHash Momentum Indicator
Overview
The Hash Momentum Indicator provides real-time momentum-based trading signals with visual entry/exit markers and automatic risk management levels. This is the indicator version of the popular Hash Momentum Strategy, designed for traders who want signal alerts without backtesting functionality.
Perfect for: Live trading, automation via alerts, multi-indicator setups, and clean chart visualization.
What Makes This Indicator Special
1. Pure Momentum-Based Signals
Captures price acceleration in real-time - not lagging moving average crossovers. Enters when momentum exceeds a dynamic ATR-based threshold, catching moves as they begin accelerating.
2. Automatic Risk Management Visualization
Every signal automatically displays:
Entry level (white dashed line)
Stop loss level (red line)
Take profit target (green line)
Partial TP levels (dotted green lines)
3. Smart Trade Management
Trade Cooldown: Prevents overtrading by enforcing waiting period between signals
EMA Trend Filter: Only trades with the trend (optional)
Session Filters: Trade only during Tokyo/London/New York sessions (optional)
Weekend Toggle: Avoid low-liquidity weekend periods (optional)
4. Clean Visual Design
🟢 Tiny green dot = Long entry signal
🔴 Tiny red dot = Short entry signal
🔵 Blue X = Long exit
🟠 Orange X = Short exit
No cluttered labels or dashboard - just clean signals
5. Professional Alerts Ready
Set up TradingView alerts for:
Long signals
Short signals
Long exits
Short exits
How It Works
Step 1: Calculate Momentum
Momentum = Current Price - Price
Normalized by standard deviation for consistency
Must exceed ATR × Threshold to trigger
Step 2: Confirm Acceleration
Momentum must be increasing (positive momentum change)
Price must be moving in signal direction
Step 3: Apply Filters
EMA Filter: Long only above EMA, short only below EMA (if enabled)
Session Filter: Check if in allowed trading session (if enabled)
Weekend Filter: Block signals on Sat/Sun (if enabled)
Cooldown: Ensure minimum bars passed since last signal
Step 4: Generate Signal
All conditions met = Entry signal fires
Lines automatically drawn for entry, stop, and targets
Step 5: Exit Detection
Opposite momentum detected = Exit signal
Stop loss or take profit hit = Exit signal
Lines removed from chart
⚙️ Settings Guide
Core Strategy
Momentum Length (Default: 13)
Number of bars for momentum calculation. Higher values = stronger signals but fewer trades.
Aggressive: 10
Balanced: 13
Conservative: 18-24
Momentum Threshold (Default: 2.25)
ATR multiplier for signal generation. Higher values = only trade the biggest momentum moves.
Aggressive: 2.0
Balanced: 2.25
Conservative: 2.5-3.0
Risk:Reward Ratio (Default: 2.5)
Your target profit as a multiple of your risk. With 2.2% stop and 2.5 R:R, your target is 5.5% profit.
Conservative: 3.0+ (need 25% win rate to profit)
Balanced: 2.5 (need 29% win rate to profit)
Aggressive: 2.0 (need 33% win rate to profit)

Breakdown Sniper [Riz]Breakdown Sniper is a complete structural-based price-action system designed to identify and validate three major setups
1. Failed Breakdowns (FBD)
2. Breakouts / Breakdowns (BO)
3. Back-Tests (BT)
The script analyzes swing structure, undercuts, reclaim behavior, channel bias, support/resistance levels, and a multi-layer confluence engine to highlight high-quality long/short signals.
It also includes trade management, target projections, trailing logic, risk models, and an optional dashboard for clarity.
Core Concepts Behind the System
1. Pivot Structure & New Low/High Logic
Breakdown Sniper continuously detects pivot highs and lows using user-defined left/right bars.
These pivots are used to determine
⦁ Recent structural lows/highs
⦁ Undercuts (for failed breakdowns)
⦁ Structural breaks (for FBO/BO setups)
This provides the foundation for all three setup types.
2. Failed Breakdown (FBD) Detection
The primary logic of the script is to detect failed breakdowns, which follow this sequence:
1. Identify an initial pivot low
2. Price undercuts that low
3. Price reclaims the level by a specified number of points
4. Optional: new higher low print confirming strength
5. Once confirmed, the script calculates:
⦁ Entry trigger price
⦁ Stop placement (multiple options: below undercut, below initial low, ATR-based, fixed)
⦁ Three profit targets based on risk multiples
The reverse logic is applied for failed breakouts (FBO).
3. Breakouts & Breakdowns (BO)
The system also captures momentum breakouts/breakdowns defined by:
⦁ Price breaking major support/resistance
⦁ Bar-level strength (close vs range)
⦁ ATR-based expansion
⦁ Holding above/below breakout level for a user-defined number of bars
If confirmed, the script projects T1/T2/T3 targets and stop placement automatically.
4. Back-test Setups (BT)
After a confirmed breakout/breakdown, the script monitors for a return to the breakout level, within a percentage tolerance.
If a clean retest occurs:
⦁ A BT Long or BT Short setup is generated
⦁ Risk and target calculations are performed automatically
This allows identifying continuation setups after strong breaks.
Channel & Levels System (Support/Resistance Engine)
The script builds a hybrid S/R and environment model using:
⦁ Regression channel OR
⦁ Donchian, Keltner, Bollinger channels (user-selectable)
The channel provides:
⦁ Upper/Lower boundaries
⦁ Midline
⦁ Trend bias based on slope
Additionally, a multi-touch support/resistance detector clusters pivot-based levels and scores them by:
⦁ Touch count
⦁ Recency
⦁ Age
⦁ Whether they classify as major levels
This explains where reversals and breakouts are most likely.
Confluence Engine
Every Long/Short signal receives a 0–100 score derived from:
⦁ Market structure: HH/HL or LL/LH
⦁ Trend filter (EMA-based)
⦁ Volatility conditions (ATR range requirements)
⦁ Session bias (Asian / London / New York / Overlap)
⦁ Volume expansion
⦁ Higher-timeframe trend (optional)
⦁ Location inside channel
⦁ Distance to nearest S/R
⦁ Setup-type priority (FBD/BO/BT)
Users can require a minimum score before a signal becomes valid.
Trade Management Logic
Once a trade triggers, the indicator handles:
⦁ Entry execution confirmation
⦁ Stop loss tracking
⦁ Three independent profit targets
⦁ Optional scale-ins
⦁ ATR-based trailing stop
⦁ Risk calculations
⦁ Real-time PnL monitoring
The script does not execute live trades — it only visualizes management levels for analysis.
Visual Components
Breakdown Sniper plots:
⦁ Channels & fills
⦁ Auto-detected S/R levels
⦁ Pivot highs/lows
⦁ Buy/Sell markers
⦁ Entry/Stop/Targets
⦁ Trade dashboard (optional)
⦁ Equity curve (optional)
Everything is toggle-based for clean charting.
How To Use the Indicator
Recommended Use-Case
⦁ Futures (ES/NQ/CL/RTY)
⦁ Indices
⦁ Crypto
⦁ FX
Works well on:
⦁ 5m / 15m / 1H
Signals do not repaint because pivots and reclaim sequences require bar completion.
Basic Usage Steps
1. Enable the setups you want to trade: FBD, BO, BT
2. Optionally turn on filters:
⦁ Trend filter
⦁ Volatility filter
⦁ Market structure filter
⦁ MTF trend filter
3. Wait for a valid long/short signal with sufficient confluence
4. Follow the plotted entry level, stop, and targets
5. Use the dashboard to monitor performance of each setup type
Important Notes
This is a structural/price-action tool, not a prediction model
No guarantee of profitability is provided
The indicator is educational and analytical
Always use independent confirmation and risk management
Disclaimer
This script is for education and analysis. It does not provide financial advice. Markets involve risk. Past behavior of any pattern or study does not imply future results. You are responsible for your own decisions.

Reduced-Lag Chande Momentum Oscillator [BOSWaves]Reduced-Lag Chande Momentum Oscillator – Adaptive Momentum Geometry with Reduced-Latency Reversion Logic
Overview
The Reduced-Lag Chande Momentum Oscillator represents a sophisticated extension of the classical Chande Momentum Oscillator, preserving the foundational measurement of net directional pressure while addressing inherent limitations in lag, noise, and signal clarity. The traditional CMO provides reliable snapshots of upward versus downward force but reacts slowly to rapid market accelerations and can obscure meaningful momentum inflections with delayed readings. This iteration integrates a dual-stage reduced-lag filter, optional advanced smoothing, and acceleration-based analytics, producing a real-time, multi-dimensional representation of market momentum.
The design reframes classical momentum using a layered curvature and gradient structure - main, midline, and shadow - to show trajectory, velocity, and intensity in one view. Instead of the usual ±70/30 extremes, it uses ±50 as a statistically grounded threshold where one side of the market begins exerting true dominance. This captures structural imbalance more reliably, exposing exhaustion and actionable inflection without amplifying noise.
This visualization gives traders a continuous, responsive read on market structure, revealing not just direction but rate of change, acceleration alignment, and curvature behavior. The oscillator becomes a momentum map, expressing both probability and intensity behind directional shifts.
Where conventional oscillators mislabel short-lived swings as signals, the Reduced-Lag CMO separates baseline shifts from high-conviction transitions, enabling cleaner, more decisive signal interpretation.
Theoretical Foundation
The classical Chande Momentum Oscillator, created by Tushar Chande, calculates the normalized net difference between consecutive upward and downward price changes over a defined window, generating readings from –100 to +100. While effective for capturing basic directional pressure, the unmodified CMO suffers from signal latency and sensitivity to abrupt market swings, which can obscure actionable inflection points.
The Reduced-Lag CMO augments this foundation with three key mechanisms:
Reduced-Lag Filtering : A dual-EMA structure eliminates inertial lag, aligning the oscillator curve closely with real-time market momentum without producing overshoot artifacts.
Smoothing Architecture : Optional SMA, EMA, or WMA smoothing is applied post-filter, balancing noise reduction with trajectory fidelity. A multi-layer line system (shadow → midline → main) communicates depth, curvature, and gradient dynamics.
Acceleration Integration : First and second derivatives of the smoothed curve quantify velocity and acceleration, allowing the indicator to identify not only momentum flips but the force behind each shift, forming the basis for the strong-signal overlay.
The combination of these mechanisms produces an oscillator that respects the original CMO framework while delivering real-time, context-sensitive intelligence. The ±50 boundaries are selected as the statistically validated pressure zones where directional dominance exceeds neutral oscillation. Crosses and rejections at these boundaries are not arbitrary overbought/oversold events, but measurable imbalances with actionable significance.
How It Works
The Reduced-Lag CMO is constructed through a multi-stage process:
Momentum Estimation Core : Raw CMO values are calculated and then passed through a reduced-lag filter to remove delay, creating a curve that closely tracks instantaneous directional pressure.
Smoothing & Layered Representation : The filtered curve can be smoothed and split into three layers - shadow, midline, and main - giving visual depth, trajectory clarity, and curvature instead of a single-line oscillator.
Gradient-Based Pressure Mapping : Color gradients encode momentum strength and polarity. Green-yellow transitions highlight increasing upward dominance, while red-yellow transitions indicate weakening downward force.
Pressure-Zone Anchoring (±50) : The system defines statistically significant pressure zones at ±50. Moves beyond these levels reflect dominant directional control, and rejections inside the zone signal potential exhaustion.
Signal Generation : Momentum events are evaluated through velocity and acceleration. Standard signals appear as triangle markers indicating validated momentum flips. Strong signals appear as triangles with diamonds when acceleration confirms a high-conviction transition.
A cooldown rule spaces signals apart to reduce clutter and emphasize structurally meaningful events.
Interpretation
The Reduced-Lag CMO reframes momentum as a dynamic equilibrium between directional force and structural pressure:
Positive Momentum Phases : Curves above zero with green-yellow gradients indicate sustained upward pressure. Shallow retracements or midline tests denote controlled pullbacks.
Negative Momentum Phases : Curves below zero with red-yellow gradients show downward dominance. Rejections from –50 highlight potential exhaustion and reversal readiness.
Pressure-Zone Dynamics (±50) : Crosses beyond ±50 confirm dominant directional force. Meanwhile, rejections and rotations inside the zone signal structural fatigue.
Velocity & Acceleration Analysis : Rising momentum with decelerating velocity suggests fading force; acceleration alignment amplifies signal strength and forms the basis of strong signals.
Signal Architecture
The Reduced-Lag CMO produces a single event type with two intensities: a validated momentum inflection.
Standard Signals - Triangles:
Triggered by momentum flips confirmed by velocity.
Represent moderate-intensity directional changes.
Appear at zero-line crosses or ±50 rejections with aligned velocity.
Strong Signals Triangles + Diamonds:
Triggered when acceleration confirms the directional change.
Represent high-intensity, high-conviction shifts.
Rare by design; indicate robust momentum inflections.
Cooldown mechanics prevent repeated signals in short succession, emphasizing structural reliability over noise.
Strategy Integration
Trend Confirmation : Align zero-line flips with higher-timeframe directional bias.
Reversal Detection : Strong signals from ±50 zones highlight potential inflection points.
Volatility Assessment : Gradient transitions reveal strengthening or weakening momentum.
Pullback Timing : Multi-layer curvature identifies controlled retracements vs trend exhaustion.
Confluence Mapping : Pair with structure-based indicators to filter signals in context.
Technical Implementation Details
Core Engine : Classical CMO with Ehlers reduced-lag extension
Lag Reduction : Dual EMA filtering
Smoothing : Optional SMA/EMA/WMA post-filter
Multi-Layer Curve : Shadow, midline, main
Signal System : Two-tier momentum-acceleration framework
Pressure Zones : ±50 statistically validated thresholds
Cooldown Logic : Bar-indexed suppression
Gradient Mapping : Encodes magnitude and direction
Alerts : Standard and strong signals
Optimal Application Parameters
Timeframes:
1 - 5 min : Intraday momentum tracking
15 - 60 min : Trend rotations & volatility transitions
4H - Daily : Macro momentum exhaustion & re-accumulation mapping
Suggested Ranges:
CMO Length : 7 - 12
Reduced-Lag Length : 5 - 15
Smoothing : 10 - 20
Cooldown Bars : 5 - 15
Performance Characteristics
High Effectiveness:
Markets with directional pulses & clean pressure transitions
Trending phases with measurable pullbacks
Instruments with stable volatility cycles
Reduced Edge:
Choppy consolidations
Ultra-low volatility environments
Disclaimer
The Reduced-Lag Chande Momentum Oscillator is a professional-grade analytical tool. It is not predictive and carries no guaranteed profitability. Effectiveness depends on asset class, volatility regime, parameter selection, and disciplined execution. Any suggested application timeframes or recommended ranges are guidance only - they are not universally optimal and will not deliver consistent accuracy on every asset or market condition. BOSWaves recommends using it in conjunction with structure, liquidity, and momentum context.

Bollinger Bands Regression Forecast [BigBeluga]🔵 OVERVIEW
The Bollinger Bands Regression Forecast combines volatility envelopes from Bollinger Bands with a linear regression-based projection model .
It visualizes both current and future price zones by extrapolating the Bollinger channel forward in time, giving traders a statistical forecast of probable support and resistance behavior.
🔵 CONCEPTS
Classic Bollinger Bands use a moving average (basis) and standard deviation (deviation) to form dynamic envelopes around price.
This indicator enhances them with linear regression slope detection , allowing it to forecast how the band may expand or contract in the future.
Regression is applied to both the band’s basis and deviation components to predict their trajectory for a user-defined number of Forecast Bars .
The resulting forecast creates a smoothed, funnel-shaped projection that dynamically adapts to volatility.
▲ and ▼ markers highlight potential mean reversion points when price crosses the outer bounds of the bands.
🔵 FEATURES
Forecast Engine : Uses linear regression to project Bollinger Band movement into the future.
Dynamic Channel Width : Adapts standard deviation and slope for realistic volatility modeling.
Auto-Labeled Levels : Displays live upper and lower forecast values for quick reference.
Cross Signals : Marks potential overbought and oversold zones with ▲/▼ signals when price exits the band.
Trend-Adaptive Basis Color : Basis line automatically switches color to represent short-term trend direction.
Customizable Colors and Widths for complete visual control.
🔵 HOW TO USE
Apply the indicator to visualize both current Bollinger structure and its forward projection.
Use ▲/▼ breakout markers to identify short-term reversals or volatility shifts.
When price consistently rides the upper band forecast, the trend is strong and likely continuing.
When regression shows narrowing bands ahead, expect a volatility contraction or consolidation period.
For range traders, outer projected bands can be used as potential mean reversion entry points .
Combine with volume or momentum filters to confirm whether breakouts are genuine or fading.
🔵 CONCLUSION
Bollinger Bands Regression Forecast transforms classic Bollinger analysis into a predictive forecasting model .
By merging volatility dynamics with regression-based extrapolation, it provides traders with a forward-looking visualization of likely price boundaries — revealing not only where volatility is but also where it’s heading next.

Liquidity Hunt Detector PDH/PDL [SmartFoxy]Liquidity Hunt Detector PDH/PDL
The Liquidity Hunt Detector (LHD) is designed to identify and anticipate liquidity grabs around the:
• Previous Day High (PDH);
• Previous Day Low (PDL).
It builds dynamic trigger levels that highlight where price may deliver its first impulse before reaching PDH/PDL.
The Liquidity Hunt Detector (LHD) identifies high-probability reversals and continuations around the Previous Day High (PDH) and Previous Day Low (PDL).
It dynamically tracks the market’s move from the session open, builds trigger levels toward PDH/PDL, and highlights where liquidity is most likely to be taken.
When price taps a Trigger Up/Down level, the indicator generates Long/Short signals with optional confirmation from the integrated MA Ribbon , ensuring only high-quality, trend-aligned setups are shown.
When price interacts with these trigger levels, the indicator generates signals that help traders evaluate the market structure and prepare for potential entries.
Designed for Forex, Crypto, Indices, Stocks , the LHD provides a clean and intuitive structure for navigating intraday liquidity grabs, session impulses, and directional bias shifts.
The indicator is built from three fully independent modules, each of which can be used separately:
Liquidity Hunt Detector (LHD)
Moving Average Ribbon (MA Ribbon)
Previous Day High/Low (PDH/PDL) levels
Liquidity Hunt Detector (LHD) Logic
1.1 Display LHD – Enables or disables the entire Liquidity Hunt Detector module.
1.2 Max Days – Number of previous days used to generate PDH/PDL levels.
1.3 GMT – Corrects all time-based calculations based on your broker/session timezone.
1.4 Calculation Method (Point A Logic)
1) Static Method
Point A = the session’s opening price.
Trigger lines are calculated strictly as a percentage of the move A → PDH or A → PDL.
Intraday fluctuations do not affect the calculation.
2) Dynamic Method
Point A updates using the current intraday high/low:
• If price forms a new low, Point A updates for the PDH-side calculations;
• If price forms a new high, Point A updates for the PDL-side calculations.
This produces trigger lines that reflect the true live market structure rather than a fixed opening reference.
1.5 Main OTT Time (Operational Trading Time)
This is the core time window during which the indicator:
• updates Point A;
• calculates trigger levels;
• validates PDH/PDL;
• draws AB / AC movement structure;
• generates entry signals.
Outside this window, no new signals or recalculations occur.
⚠ If your broker’s first candle opens at a non-standard time (e.g., 00:08), adjust the OTT start time to avoid visual artifacts.
1.6 Show Line A – Displays the opening price level (Point A) until the end of the OTT window.
Style, width, and color are customizable.
1.7 Show Line AB — Price Movement Toward PDH.
Static Method – Single line: A → PDH
Dynamic Method – Two segments:
• A → Daily Low;
• Daily Low → PDH.
If PDH is swept, the “B” label switches to Sweep PDH.
1.8 Show Line AC – Price Movement Toward PDL.
Static Method – Single line: A → PDL
Dynamic Method – Two segments:
• A → Daily High;
• Daily High → PDL.
If PDL is swept, the “C” label switches to Sweep PDL.
1.9 Show Trigger Up Line (LONG Trigger) – Defines the level where the Long signal can activate.
By default, at 50% of the A → PDH movement.
When price touches this line, the script may:
• show a LONG label;
• trigger an alert.
All visual parameters are customizable.
1.10 Show Trigger Up Line (LONG Trigger)
Same logic as Trigger Up, but based on A → PDL.
1.11 Show Main Zone (OTT Zone) – Visual background highlighting of the active OTT window.
Helps instantly see:
• whether signals are allowed;
• how much time remains in the trading window?
Color and opacity are adjustable.
1.12 Upper Zone (toward PDH) – Tracks the protected area towards PDH.
Updates dynamically with new highs.
1.13 Lower Zone (toward PDL) – Tracks the zone toward PDL.
Updates dynamically with new lows.
1.14 Show Labels – Displays reference labels (A, B, C, Trigger Up, Trigger Down).
Label size is customizable.
1.15 Add Price – Adds the exact price value to each label.
1.16 Change Color after Sweep PDH or PDL – After PDH or PDL is broken, the indicator automatically recolors lines and labels to visually confirm the sweep.
1.17 Show SHORT Label – Displays the SHORT entry label when all conditions for a bearish signal are met.
Style parameters are set in the previous blocks.
1.18 Alert on Bearish Trigger Down – Triggers an alert when the price activates the bearish trigger.
1.19 Show LONG Label – Displays the LONG entry label when bullish conditions are met.
Style parameters are set in the previous blocks.
1.20 Alert on Bullish Trigger Up – Triggers an alert when the price activates the bullish trigger.
1.21 Alerts Active Time – Defines a custom time interval during which trigger signals are allowed.
Even if price touches a trigger level,
❗ signals will NOT be generated outside this allowed time.
Useful for:
• avoiding Asian session signals;
• reducing noise in low-liquidity periods.
1.22 Labels and Alerts Display Mode
Two settings modes:
• On Trigger (Instant Mode) – Signals appear immediately when price touches the trigger.
• On Candle Close (Conservative Mode) – Signals form only after the candle closes beyond the trigger level.
A more conservative option.
1.23 Delay LHD Signal Until MA Ribbon Confirms Direction – If enabled, LHD signals will NOT fire until the MA Ribbon produces a matching directional signal.
Logic:
• Price hits the trigger → LHD conditions become “armed”;
• The indicator waits;
• When MA Ribbon confirms trend direction (Long/Short);
• The final LHD label + alert is generated.
This ensures LHD trades are filtered and aligned with MA-based trend confirmation.
⚠ Works only when the MA Ribbon module is active.

Smart Trend Signals# Smart Trend Signals - Universal Adaptive Trend Indicator
## 🌟 Professional-Grade Trend Detection for All Markets
Smart Trend Signals is an advanced technical analysis tool that combines proven methodologies into one powerful, easy-to-use indicator. Whether you trade stocks, forex, crypto, or futures, this indicator adapts to your market with intelligent trend detection and noise reduction technology.
### 🧠 HOW IT WORKS: CORE TECHNOLOGY
This indicator uses a proprietary **Multi-Layer Confirmation System** to ensure signals align with Trend Direction, Volatility, and Momentum.
* **Adaptive Volatility Trail (TrendBand):** Acts as a dynamic support/resistance that adjusts to real-time volatility (ATR) and momentum. Signals only fire when price closes conclusively outside this trail.
* **SFI Noise Reduction Engine:** A proprietary filter that eliminates market "noise" and small fluctuations, ensuring signals reflect true price action.
* **6-Layer Entry Confluence:** Every signal is validated across a strict, six-layer filtering sequence:
1. **TrendBand Alignment** - Core trend direction
2. **SMA Confirmation** - Medium-term trend validation
3. **ADX Strength Filter** - Trend momentum measurement
4. **Pivot Proximity Protection** - Avoids reversal zones near recent structure
5. **Anti-Whip Confirmation** - Reduces false signals in choppy markets
6. **Volume Confirmation** - Validation of institutional activity
### ⚙️ COMPREHENSIVE PARAMETER GUIDE
#### 🎯 TREND & MOMENTUM (ADX)
- **Align Signals with TrendBand**: When enabled, filters signals to appear only in the direction of the main TrendBand.
- **SMA Confirmation Length**: Sets the smoothing period for trend confirmation (15 = medium-term).
- **ADX Length**: Adjusts the sensitivity of the ADX trend strength measurement (10 = balanced).
- **ADX Threshold (25)**: **(Use $\ge 25$ for clear trends; set to $0$ to disable filtering out weak/sideways markets.)**
#### 🔧 SFI NOISE REDUCTION ENGINE (SFI CORE)
- **Sensitivity (3.0)**: **(Controls the threshold for noise reduction. Use lower values for high-frequency scalping; higher values for swing trades.)**
- **TrendBand ATR Length** (10): Volatility measurement period for the adaptive bands.
- **TrendBand Multiplier** (3.0): Band width adjustment to fit different market volatility regimes.
#### 🛡️ RISK MANAGEMENT (ATR Multiples)
- **TP Multiplier (2.0)**: **(Take Profit distance in ATR multiples.
- **SL Multiplier (1.5)**: **(Stop Loss distance in ATR multiples, adapting to current market volatility.)**
- **Use Stop Loss**: Enables/disables TP/SL visualization on the chart. *"disable by default"
- **Anti-Whip**: Enables the final confirmation logic to reduce signal flipping.
### ⚠️ IMPORTANT DISCLAIMER
**EDUCATIONAL PURPOSE ONLY**
This indicator is designed for technical analysis education and strategy development. It is NOT financial advice. The current default setting doesn't use stop loss. the stop loss will be the opposite of the signal. Example; if you see a BUY signal followed by a SELL signal, it means the trade is closed in loss. Highly recommended to use the stop loss.
**NO PERFORMANCE GUARANTEES**
- Past performance is not predictive of future results.
- Always test in simulation before live trading.
- You are responsible for parameter optimization, risk management, and final trading decisions.
ETH/USD using default setting without stop loss
ES1! using default settings without stop loss.
XAU/USD using default settings without stop loss.

Market Echo Screener [BigBeluga]
The Market Echo Screener is a structured multi-asset dashboard capable of tracking up to 15 symbols simultaneously .
Designed to condense complex market data into an actionable format. Each column represents a specialized calculation, giving traders insight into signals, phases, retests, and volatility — all updated in real time.
For each symbol, it displays a full set of analytics: trend signals, take profit progression, wave structure, equilibrium pulls, volatility-adjusted flows, smart band retests, volatility regimes, and live price context — all condensed into one unified table.
Instead of flipping through multiple charts, traders get an instant overview of market dynamics across an entire watchlist, making it easier to spot alignment and high-probability opportunities.
⬤ Trend Signals
This column is powered by a low-pass digital trend filter that smooths short-term fluctuations and isolates directional momentum.
It produces Buy and Sell signals when price crosses adaptive thresholds relative to the smoothed baseline. Stronger “+” signals appear when slope acceleration or momentum divergence confirms additional conviction.
• Uses recursive filtering to eliminate noise.
• Signal strength is determined by the magnitude of deviation from the baseline.
• Tracks how many bars back the signal occurred, using a bar-counting algorithm.
• Combines both normal and power signals to reflect phases of market conviction.
⬤ TPs (Take Profits)
The take profit ladder is generated through an adaptive volatility-projection model .
When a signal fires, projected levels are based on volatility-weighted extensions. Each level (TP1–TP6) represents an incrementally wider confidence band, dynamically recalculated with every new bar.
• Uses volatility-normalized ranges for TP distances.
• Level activation is sequential, progressing as price reaches thresholds.
• Reset occurs when opposite signals are detected.
• Higher TPs imply extended momentum runs, while early TP triggers highlight conservative exits.
⬤ ActionWave
The ActionWave column applies a dual-smoothing algorithm combining custom MA stacks and polynomial regression to capture the underlying wave structure.
It identifies macro phases (Bullish ∆ / Bearish ∇) and flags retests when price folds back into the average after expansion.
• Wave slope is calculated using gradient differentials.
• Retests are confirmed within a bar-window threshold (e.g., 20–25 bars).
• Distinguishes continuation from exhaustion by analyzing whether slope remains positive/negative.
• Provides a clean map of trend rhythm without intrabar noise.
⬤ Magnet
The Magnet measure calculates a dynamic equilibrium band around price.
By averaging the midpoints of recent high–low ranges and weighting them by volatility, it defines a “fair zone” where price tends to trend and mean-revert.
• Bullish/Bearish status is derived from price position relative to the equilibrium mean.
• Retests occur when price leaves the zone and then re-enters within a tolerance band.
• Incorporates a mean-reversion index to highlight strength of pull.
• Acts as a gravitational anchor, showing when price is likely to snap back.
⬤ FlowTrend
FlowTrend is calculated using volatility and noise adjusted envelope bands .
It determines the active market flow by testing whether price consistently holds above or below the smoothed envelope. Retests are logged when price touches the envelope and respects trend direction.
• Bands expand/contract based on ATR and rolling variance.
• Flow state = Bullish if closing above upper envelope, Bearish if below.
• Retests validated only if trend slope and band alignment remain intact.
• Helps identify continuation setups by filtering false flips.
⬤ Smart Bands
Smart Bands employ an adaptive trailing stop framework that shifts with volatility and momentum.
Price interaction with these bands is tracked for bullish (∆) or bearish (∇) retests, highlighting whether the current move has revalidated at its volatility boundary.
• Bands derived from trailing volatility-adjusted stops.
• Upward retest fires when price tests support bands during uptrend.
• Downward retest occurs when resistance bands are tapped in downtrend.
• Provides structured “confirmation points” that validate signals.
⬤ Volatility
Volatility is measured via a hybrid standard deviation logic .
First, the standard deviation of closing prices over 10 bars is scaled by a factor, then normalized against its own 20-bar rolling standard deviation. The result is converted into a 0–100 index, producing three regimes:
❄️ Calm (<50): low dispersion, mean-reversion conditions dominate.
⚠️ Elevated (50–70): directional expansion likely, watch for breakout tension.
💥 Explosive (>70): strong dispersion, trend-following setups favored.
• Uses layered smoothing to dampen noise.
• Normalization ensures comparability across different assets.
• Acts as a meta-filter for selecting strategy type (range vs. momentum).
⬤ Price
The price column displays the latest close rounded to the nearest tick size.
It is color-coded by candle bias: green for bullish closes, red for bearish closes.
• Tick normalization ensures clean display across assets with different decimal precision.
• Color-coding gives instant sentiment context.
• Serves as the anchor reference for all other metrics in the row.
The Market Echo Screener is not a simple signal table — it’s a layered analytics framework.
Each column is driven by technical calculations: smoothing filters, volatility projections, equilibrium models, and adaptive band logic. Together, they create a unified lens on multiple assets, allowing traders to rapidly identify alignment, filter out noise, and focus on the clearest opportunities.

DeMARK 9-13For the first time ever, the power and precision of DeMARK is now available on TradingView. Combining core elements of the renowned Sequential® and Combo® studies, the DeMARK 9-13® indicator delivers the same unique insights in a streamlined interface.
The Sequential and Combo family of indicators have been trusted by the top financial firms, funds and figures for decades to enhance their trading and investment strategies. Known for their 9 Setup® and 13 Countdown® readings, these studies are designed to highlight potential market reversals as well as key areas of support, resistance and momentum. With DeMARK 9-13, users can access these groundbreaking techniques in one integrated offering.
While it's often said, "the trend is your friend," it's also crucial to recognize when it's about to end. Identifying potential market inflection points allows you to buy weakness and sell strength, improving your cost basis, reducing risk and allowing you to capitalize on a greater portion of the reversal.
At its core, 9s and 13s are constructed to measure market momentum and exhaustion. Both Sequential and Combo consist of two phases: Setup and Countdown. The Setup phase compares price activity across nine consecutive bars to define the market environment, while the Countdown phase performs a separate 13-bar comparison to indicate when a reversal may be imminent. A 9-13 reading reflects the fulfillment of both phases. When combined with TDST® lines and Risk Levels®, this approach provides a more comprehensive view of the market.
The DeMARK 9-13 indicator consists of:
Sequential
Combo
9 Setup
13 Countdown
TD Setup Trend (TDST)
Perfected® Setup
Risk Levels & Zones
Together, these elements provide an unparalleled view into the inner workings of the market, helping you anticipate shifts and act with greater precision.
🟡 DESCRIPTION
SETUP
The initial stage of the DeMARK 9-13 indicator is the Setup phase. This series is the same for both Sequential and Combo and compares the close of the current bar to the close four bars earlier. Buy Setup counts are displayed in blue below the data set and fulfilled when there are nine consecutive closes less than the close four bars earlier. Sell Setup counts are displayed in blue above the data set and fulfilled when there are nine consecutive closes greater than the close four bars earlier.
During the active Setup, all number counts remain visible to show the progress of the series. Upon completing the Setup, the 9 is recorded and the 1-8 counts are removed. This reduces visual distraction and allows for more result history (due to TradingView’s 500-label limit). Setups are always counting, with Price Flips® occurring as the series alternates between Buy and Sell Setups.
PERFECTED SETUPS
Setups can be classified as either “Perfected” or “Imperfected.” The Setup is Perfected when the 9 is completed and the 6 and 7 bars have been exceeded. In the case of a Buy Setup, the low of bars 8 or 9 must be less than the low of bars 6 and 7. Conversely, in the case of a Sell Setup, the high of bars 8 or 9 must be greater than the high of bars 6 and 7. The point at which the Setup is perfected is displayed with a solid blue dot, matching the color of the Setup series.
Generally speaking, the market will reverse or stabilize within one to four bars of a completed and Perfected Setup 9. The strength and duration of this response can be assessed with the implementation of other indicators, such as TDST® lines.
TD SETUP TREND (TDST)
The TDST indicator is derived from the Setup phase and is used to confirm market trends and identify likely trend failures. A TDST resistance line is drawn from the highest true high of the completed 9 Buy Setup series, while a TDST support line is drawn from the lowest true low of the completed 9 Sell Setup series. These TDST lines provide an indication of market support, resistance and momentum to help evaluate the integrity of the move.
TDST lines are displayed in a lighter blue than the Setup phase. When Breakout Qualifiers are enabled, TDST lines can be considered qualified or disqualified. Disqualified TDSTs appear as a dashed line, indicating potential support in the case of TDST support lines or resistance in the case of TDST resistance lines. Qualified TDSTs appear as a solid line and will stop drawing when a breakout or breakdown occurs, suggesting continued momentum.
COUNTDOWN
Once the Setup phase is completed, the second stage of the DeMARK 9-13 indicator can begin — the Countdown phase. Sequential and Combo share the same Setup series, but there are subtle differences in their respective Countdown phases, each constructed to identify areas of potential trend exhaustion in different market conditions.
Sequential is designed to respond in both trending and consolidating markets, while Combo is more responsive in trending environments and inactive during periods of market consolidation. For that reason, we often say that Combo identifies the highest or lowest points of a move, with Sequential identifying secondary tests. When aligned, these results are even more powerful.
SEQUENTIAL COUNTDOWN
A Sequential Buy Countdown is possible upon completion of a Buy Setup and looks for 13 closes less than or equal to the low two bars earlier. Sequential Buy Countdown counts are displayed as a dark green number below the data set and can begin as early as the 9 bar of a completed Buy Setup. A Sequential Sell Countdown is possible upon completion of a Sell Setup and looks for 13 closes greater than or equal to the high two bars earlier. Sequential Sell Countdown counts are displayed as a dark red number above the data set and can begin as early as the 9 bar of a Sell Setup. Because of this overlap, Sequential Countdown requires as few as 12 bars beyond the 9 Setup to complete the cycle.
Unlike the Setup phase, Countdown counts need not be consecutive. During the active Countdown, all number counts remain visible to display the progress of the series. Upon completing the Countdown, the 13 is confirmed and the 1-12 counts are removed. This reduces visual distraction and allows for more result history (due to TradingView’s 500-label limit).
A completed Sequential 13 Countdown marks the fulfillment of the 9-13 reading and identifies potential market exhaustion. Additional elements of Sequential Countdown like Intersection, Countdown Deferral, Risk Levels and the 12-bar rule can be used to provide further detail and are outlined below.
COMBO COUNTDOWN
A Combo Buy Countdown is possible upon completion of a Buy Setup and looks for 13 closes less than or equal to the low two bars earlier, with additional rules based on the Combo version selected. Combo Buy Countdown counts are displayed as a light green number below the data set and can begin as early as the 1 bar of a completed Buy Setup. A Combo Sell Countdown is possible upon completion of a Sell Setup and looks for 13 closes greater than or equal to the high two bars earlier, with additional rules based on the Combo version selected. Combo Sell Countdown counts are displayed as a magenta number above the data set and can begin as early as the 1 bar of a Sell Setup. Because of this overlap, Combo Countdown requires as few as four bars beyond the 9 Setup to complete the cycle.
Unlike the Setup phase, Countdown counts need not be consecutive. During the active Countdown, all number counts remain visible to display the progress of the series. Upon completing the Countdown, the 13 is confirmed and the 1-12 counts are removed. This reduces visual distraction and allows for more result history (due to TradingView’s 500-label limit).A completed Combo 13 Countdown marks the fulfillment of the 9-13 reading and identifies potential market exhaustion. Additional elements of Combo Countdown like Risk Levels and the 12-bar rule can be used to provide further detail and are outlined below.
RISK LEVELS
When a 9 Setup or 13 Countdown indication is recorded, a Risk Level is generated to identify the zone within which a reversal should occur. This level accounts for any residual trend momentum without invalidating the buy or sell indication. For a completed buy indication, the Risk Level marks the price above which the 9 or 13 remains active and serves as additional support. Conversely, for a completed sell indication, it marks the price below which the 9 or 13 remains active and serves as additional resistance. This level can be viewed as the maximum threshold the indication can withstand before the prevailing momentum overwhelms and negates it and is often used to establish stop-loss areas.
Risk Level line colors correspond to the completed Setup, Sequential Countdown or Combo Countdown that generated it. Shaded risk zones can also be displayed, further highlighting the indication window. When Breakout Qualifiers are enabled, the Risk Level can be considered qualified or disqualified. Disqualified Risk Levels appear as a dashed line, indicating likely support in the case of a buy indication and likely resistance in the case of a sell indication. Qualified Risk Levels appear as a solid line and will stop drawing when a breakout or breakdown occurs, suggesting continued momentum.
4-BAR & 12-BAR METRICS
Generally speaking, the market should see some sort of response within four bars of a completed 9 Setup indication and 12 bars of a completed 13 Countdown indication. If the chart has not responded in that time the existing trend is likely to continue.
INTERSECTION
Intersection is an elective setting unique to Sequential Countdown. When enabled, it postpones the start of the Countdown phase until the price range of the later Setup counts overlap with the price activity of any Setup count occurring three or more bars earlier. This is intended as a pressure release to avoid commencing the count during an extraordinary breakaway market event or aberration. The Intersection level’s color matches its corresponding Buy and Sell Countdown reading and is displayed as a horizontal line on the confirming bar.
COUNTDOWN DEFERRAL
The Sequential Countdown phase of the DeMARK 9-13 indicator includes two optional Countdown Deferral qualifiers — the 13 vs. 8 rule and the 8 vs. 5 rule.
The 13 vs. 8 Countdown Deferral rule is designed to ensure that the tail end of the Countdown is representative of the existing trend. To fulfill this restriction, the low of the 13 bar must be less than or equal to the close of the 8 bar in the case of a Sequential Buy Countdown, while the high of the 13 bar must be greater than or equal to the close of the 8 bar in the case of a Sequential Sell Countdown. Because Countdown counts can increment in a sideways market, this rule helps to confirm that a trend has remained intact and improves accuracy as the series reaches its completion.
When enabled, this Countdown Deferral condition substitutes a “+” for what would otherwise be a “13,” thereby postponing the count. A Sequential Buy Countdown deferral is displayed in dark green below the data set, while a Sequential Sell Countdown deferral is displayed in dark red above the data set. Note that this optional setting is enabled by default and labeled “Last vs. 8 Qualifier” in the DeMARK 9-13 indicator settings.
Whereas the 13 vs. 8 rule is designed to ensure that the tail end of the Sequential series is representative of the existing trend, the 8 vs. 5 Countdown Deferral rule is designed to ensure that the body of the Countdown phase is properly configured. As with the 13 vs. 8 rule, the 8 vs. 5 rule matches the color and placement of its corresponding Buy or Sell Countdown series and substitutes a “+” for what would otherwise be a “5”, thereby postponing the count. The 13 vs. 8 comparison is critical to the Countdown phase, while the 8 vs. 5 comparison is elective and provides additional confidence that the trend has remained intact.
COUNTDOWN RECYCLE®
Markets are constantly evolving to reflect new information. Just as fundamentals experience occasional adjustments impacting the expectations of the asset, so too do technical analysis and market timing. This is most often reflected in the Sequential and Combo Countdown phase by a process known as Recycling.
Recycling occurs when a Countdown 13 is interrupted by a subsequent overlapping “22” Setup count in the same direction. Recycling suggests that the new Setup is sufficiently strong to weaken the impact of a confirmed Countdown series and resets the process. A recycling indication is represented as an “R” where the Countdown 13 was previously displayed, matching the color and placement of that Buy or Sell Countdown series.
COUNTDOWN CANCELLATION
Once completed, a 9 Setup and 13 Countdown confirmation is permanent and never altered. However, it’s important to note that Countdowns can be cancelled during their construction phase. There are two scenarios where a Countdown series would be removed from the chart.
The first Countdown cancellation scenario occurs when a subsequent 9 Setup is confirmed in the opposite direction prior to the completion of the Countdown phase. The reasoning is that market conditions have changed from what they were when the initial Setup was fulfilled, making the newer Setup more relevant. Upon confirming an opposing 9 Setup, the incomplete Countdown phase is canceled and removed from the chart.
The second Countdown cancellation scenario takes place when the TDST in the opposite direction is violated, suggesting a conclusion to the previous trend and a confirmation of a new one. In these cases, a true low that occurs above the Buy Setup’s TDST resistance line, or a true high that occurs below the Sell Setup’s TDST support line, cancels the incomplete Countdown phase and removes the counts from the chart.
🟡 SETTINGS
DISPLAY
Setup : Displays the Setup phase of the Sequential and Combo indicators. The first swatch controls the color of the Buy Setup phase displayed below the data set. The second swatch controls the color of the Sell Setup phase displayed above the data set.
TDST : Displays the TDST lines for the Sequential and Combo indicators. The first swatch controls the color of the TDST resistance lines associated with the Buy Setup phase. The second swatch controls the color of the TDST support lines associated with the Sell Setup phase.
Sequential Countdown : Displays the Countdown phase of the Sequential indicator. The first swatch controls the color of the Buy Countdown phase displayed below the data set. The second swatch controls the color of the Sell Countdown phase displayed above the data set.
Combo Countdown : Displays the Countdown phase of the Combo indicator. The first swatch controls the color of the Buy Countdown phase displayed below the data set. The second swatch controls the color of the Sell Countdown phase displayed above the data set.
Indicator font size : Adjusts the size of the Sequential and Combo indicator counts displayed above and below the data set. ( Default: 18 )
Display full series count : Displays the full Sequential and Combo numerical series for the active 9 Setup and 13 Countdown phases only, or for all completed indications (within TradingView’s 500-label limit). ( Default: Active only )
SETUP
Bars to Setup : Number of consecutive bars needed to complete the Setup phase. ( Default: 9 )
Bars to look back : Defines the bar to which the current Setup count is compared. ( Default: 4 )
Setup compare : Determines whether equal prices should increment the Setup count. ( Default: Without equal )
Count completion weight : Adjusts the font weight of the Setup completion counts displayed above and below the data set. ( Default: Bold )
Setup Perfection : Identifies when Setup Perfection occurs, with the low of the final two Buy Setup counts less than the lows three or four bars prior to completion, and the high of the final two Sell Setup counts greater than the highs three or four bars prior to completion. With the default “Bars to Setup” setting of “9,” Perfection occurs when the low of Buy Setup bar 8 or 9 is less than the lows of bars 6 and 7, and the high of Sell Setup bar 8 or 9 is greater than the highs of bars 6 and 7. ( Default: Enabled )
Enable Setup Risk Level : Displays the Risk Level tied to the Setup. ( Default: On )
Enable Setup Risk Level Zone : Shades the area between the completed Setup and its Risk Level. ( Default: On )
TD SETUP TREND (TDST)
TDST line thickness : Adjusts the thickness of TDST support and resistance lines. ( Default: Standard )
COUNTDOWN (SHARED)
Bars to Countdown : Number of bars needed to complete the Countdown phase. ( Default: 13 )
Bars to look back : Defines the bar to which the current Countdown count is compared. ( Default: 2 )
Countdown comparison value : Output used in the Countdown look back comparison. For Aggressive settings, Low/High is required. ( Default: Close )
Termination Count price value : Allows the final count of the Countdown phase to use a different comparison value for more flexibility. ( Default: Open or Close )
Countdown compare : Determines whether equal prices should increment the Countdown count. ( Default: With equal )
Count completion weight : Adjusts the font weight of the Countdown completion counts displayed above and below the data set. ( Default: Bold )
SEQUENTIAL COUNTDOWN
Enable Intersection : Toggles the Sequential Intersection phase requirement. ( Default: Off )
8 vs. 5 Qualifier : Qualifier requiring the low of the 8 Buy Countdown to be less than the close of the 5 count, and the high of the 8 Sell Countdown to be greater than the close of the 5 count. ( Default: Off )
Last vs. 8 Qualifier : Qualifier requiring the low of the final Buy Countdown count to be less than the close of the 8 count, and the high of the final Sell Countdown to be greater than the close of the 8 count. With the default “Bars to Countdown” setting of “13,” the low of the 13 Buy Countdown would need to be less than the close of the 8 count, and the high of the 13 Sell Countdown would need to be greater than the close of the 8 count. ( Default: On )
Enable Risk Level : Displays the Risk Level tied to the Countdown. ( Default: On )
Enable Risk Level Zone : Shades the area between the completed Countdown and its Risk Level. ( Default: On )
COMBO COUNTDOWN
Combo version : Determines the version of Combo used for the Countdown phase, whether it’s Standard, Conservative or Aggressive. ( Default: Standard )
Enable Risk Level : Displays the Risk Level tied to the Countdown. ( Default: On )
Enable Risk Level Zone : Shades the area between the completed Countdown and its Risk Level. ( Default: On )
RECYCLE
Enable Recycle : Toggles Recycling, replacing the final Sequential and Combo Countdown count with an “R” when its rules are met. With the default “Bars to Countdown” setting of “13,” a recycled 13 count would be replaced with the ‘R’. ( Default: On )
Setup Count : Defines the number of consecutive Setup bars required to trigger a Recycle. ( Default: 22 )
CANCEL
Reverse Setup : Incomplete Countdowns are cancelled when a Setup in the opposite direction is confirmed. ( Default: On )
TDST Rule : Incomplete Buy Countdowns are cancelled when a true low exceeds the Buy Setup’s TDST resistance line, and incomplete Sell Countdowns are cancelled when a true high breaks the Sell Setup’s TDST support line. ( Default: On )
BREAKOUT QUALIFIERS
Enable Breakout Qualifiers : Breakout Qualifier rules will dictate whether TDST and Risk Level line breakouts can be considered qualified or disqualified. Qualified lines are solid and will stop drawing when a breakout or breakdown occurs, suggesting continued momentum. Disqualified lines are dashed, serving as resistance in the case of a false breakout and support in the case of a false breakdown. When Breakout Qualifier rules are disabled, a line becomes solid on any close beyond the level. ( Default: On )
🟡 DISCLAIMER
By subscribing to and or using DeMARK 9-13 or any other DeMARK Indicators on TradingView, you acknowledge that you have read, understood and agree to the DeMARK for TradingView Terms of Service (located in the DeMARK account signature) as well as any updates to those terms which may happen from time-to-time.
The DeMARK Indicators are powerful tools designed to assist the individual process you use to understand financial markets and make investment decisions but they are not trading systems. Any information presented is not, and should not be construed as, financial or investment advice. You should not make any investment decision based solely on the information provided by these tools. The products we offer do not recommend or endorse any specific securities, financial products or investment strategies. Any information, data or analysis presented by any DeMARK products or tools is generic and does not consider your personal financial situation, investment objectives or risk tolerance. All investment decisions are yours alone and are made at your own risk. Those risks include, but are not limited to, potential system errors, data inaccuracies or outages.
From time to time unauthorized and unaffiliated third parties use the DeMARK name or the names of our copyrighted and/or trademarked products in an unapproved, inaccurate and misleading manner. While we do our best to remove these examples, some fake, flawed and fraudulent may exist. The only official and accurate sources of our products are those listed on the DeMARK company website. Unauthorized reproduction, copying, scraping, republishing, distribution, dissemination or any other use of our name, trademarks and/or copyrighted materials (including this script documentation) is prohibited.
Without in any way limiting DeMARK’s exclusive rights under copyright, trademark and all other intellectual property protections, any use of DeMARK products to “train” generative artificial intelligence (AI) technologies to generate text is expressly prohibited. DeMARK reserves all rights to license uses of this work for generative AI training and development of machine learning language or machine learning visual models.
The data and analysis in our products are based on sources believed to be reliable, but DeMARK does not control or guarantee the accuracy, completeness or timeliness of this information.
As a DeMARK subscriber or user, you are responsible for conducting your own research and due diligence before making any investment decisions.
Past performance, including any simulated or historical data, is not indicative of future results.
付費腳本

Screener (SSA) [AlgoAlpha]🟠 OVERVIEW
This script is a multi-symbol screener that serves as a dashboard companion to the "Smart Signals Assistant (SSA)" indicator. Its purpose is to monitor the entire suite of SSA components—from the core signals to all confluence tools—across a customizable watchlist of up to 18 assets. By displaying the real-time status of each indicator in a single table, it allows traders to get a bird's-eye view of the market, quickly identify assets with strong trend confluence, and filter for high-probability setups without needing to switch charts.
The screener is designed to mirror the modularity of the main SSA indicator, allowing you to enable or disable components in the table to match your preferred trading dashboard.
🟠 CONCEPTS
The screener is built directly on the analytical framework of the Smart Signals Assistant, applying its complex, proprietary algorithms to each symbol in your watchlist and summarizing the results. The combination of these different analytical concepts is what gives the screener its utility, as it helps traders find opportunities where multiple, distinct strategies align.
Each column in the table represents a core trading concept:
Smart Signals: This is the primary signal engine, designed to identify potential entry points. It operates in different modes to capture both long-term swings and faster scalping opportunities.
Fair Value Trail (FVT): This component provides a dynamic, volatility-adjusted baseline for the trend. It acts as a form of dynamic support or resistance, helping to confirm the validity of a trend shown by the Smart Signals.
Trend Spine: This tool is designed to identify the underlying "backbone" of the market's trend. It filters out short-term price noise to provide a more stable, clear indication of the dominant market direction.
Trend Bias: This measures the strength and conviction behind a trend. It helps distinguish between a strong, accelerating move and a weak, decelerating one, adding a layer of momentum analysis.
Firmament Clouds: These are volatility-based bands that create dynamic overbought and oversold zones. They help identify when price is potentially overextended and due for a pullback or consolidation.
Trend-Range Classifier (TRC): A machine-learning model that analyzes market characteristics to classify the current environment as either "Trending" or "Ranging." This is crucial for helping traders apply the right strategy for the current conditions.
🟠 FEATURES
This screener organizes the complex data from the SSA indicator into a simple, color-coded table. Here is a breakdown of each column and its possible values:
Asset: Displays the ticker symbol for the asset being analyzed.
Smart Signals: Shows the latest signal from the core engine.
▲: A standard bullish signal has been detected.
▼: A standard bearish signal has been detected.
▲+: A strong bullish signal with higher conviction has been detected.
▼+: A strong bearish signal with higher conviction has been detected.
Fair Value Trail: Indicates the trend direction based on the volatility trail.
▲: The FVT is in a bullish trend (acting as dynamic support).
▼: The FVT is in a bearish trend (acting as dynamic resistance).
Trend Spine: Shows the direction of the core underlying trend.
▲: The underlying trend backbone is bullish.
▼: The underlying trend backbone is bearish.
Trend Bias: Measures the current momentum strength.
Strong▲: Strong and accelerating bullish momentum.
Weak▲: Bullish momentum exists but is weakening.
Strong▼: Strong and accelerating bearish momentum.
Weak▼: Bearish momentum exists but is weakening.
Firmament Clouds: Identifies overbought/oversold conditions relative to volatility.
Very Overbought / Overbought: Price is significantly extended above its recent range.
Very Oversold / Oversold: Price is significantly extended below its recent range.
Neutral: Price is trading within its normal volatility range.
Trend-Range Classifier: Displays the market state as determined by the ML model.
Trend: The market is in a trending environment, suitable for trend-following strategies.
Range: The market is in a ranging or consolidating environment, suitable for mean-reversion strategies.
Exit Signal Count: Tracks the number of take-profit signals that have occurred since the last primary Smart Signal.
0, 1, 2, 3...: A numerical count of exit signals. A higher number suggests a trend may be maturing or exhausting.
🟠 USAGE
The main purpose of the screener is to quickly identify assets where multiple components of the SSA system are in alignment, indicating a high-confluence trading opportunity.
1. Setup and Configuration:
Add the screener to your chart.
Go into the settings and populate the "Watchlist" group with the symbols you wish to monitor.
Ensure the settings for the components (Time Horizon, Signal Mode, etc.) are synchronized with the settings on your main SSA indicator for consistency.
2. Interpreting the Columns for Trading Decisions:
Start with the Big Picture (TRC): First, look at the "Trend-Range Classifier" column. If it shows "Trend," you should be looking for trend-following setups. If it shows "Range," you might avoid taking strong trend signals.
Establish Directional Bias (Spine & Bias): For trend-following, look for assets where the "Trend Spine" and "Trend Bias" agree. A "▲" in the Spine column combined with a "Strong▲" in the Bias column indicates a healthy and robust uptrend.
Time Your Entry (Smart Signals): Once you have an asset with a clear bias, watch the "Smart Signals" column for a fresh signal that aligns with that bias. A "▲+" signal appearing in an asset with a strong bullish bias across other columns is a high-confluence entry point.
Add Context (FVT & Clouds): Use the "Fair Value Trail" and "Firmament Clouds" to refine your entry. A buy signal is generally stronger if the FVT is also bullish ("▲") and the price is not in a "Very Overbought" state according to the clouds.
Manage the Trade (Exit Count): After entering a trade, keep an eye on the "Exit Signal Count." As the number increases, it serves as a warning that the trend is becoming extended and it might be time to take partial profits or tighten your stop-loss.
付費腳本

McMillan Volatility Bands (MVB) – with Entry Logic// McMillan Volatility Bands (MVB) with signal + entry logic
// Author: ChatGPT for OneRyanAlexander
// Notes:
// - Bands are computed using percentage volatility (log returns), per the Black‑Scholes framing.
// - Inner band (default 3σ) and outer band (default 4σ) are configurable.
// - A setup occurs when price closes outside the outer band, then closes back within the inner band.
// The bar that re‑enters is the "signal bar." We then require price to trade beyond the signal bar's
// extreme by a user‑defined cushion (default 0.34 * signal bar range) to confirm entry.
// - Includes alertconditions for both setups and confirmed entries.

BVC - Momentum Dashboard ForecastBVC – Momentum Dashboard Forecast is an all-in-one indicator designed for the Casablanca Stock Exchange.
It merges trend, momentum, volatility and breakout signals to produce clear, non-repainting Buy/Sell triggers, strength scoring,
short-term forecasting and a complete visual dashboard.
Main Components
• MA20 / MA50 trend structure
• RSI(14) oversold/overbought exits
• Donchian breakouts (non-repainting using previous window)
• Optional volume confirmation
• Buy/Sell labels + strength score (0→5)
• Automatic trend-based background coloring
• Forecasting (J+1 … J+H) using linear regression + ±k·ATR
• Mini Dashboard + Forecast Table
Forecast Module
• Linear projection using slope of linreg
• ATR-based uncertainty envelope
• Projection labels (optional)
• Forecast table: Session, Projection, ATR band
Alerts
• Buy Signal
• Sell Signal
(Add alert on the indicator.)
Best Practices (BVC)
• Use daily for swing trades
• Weekly timeframe for structural trend
• Donchian 20–30 depending on volatility
• Activate volume filter for liquid stocks
• Combine with support/resistance and order book analysis

Quantura - Quantified Price Action StrategyIntroduction
“Quantura – Quantified Price Action Strategy” is an invite-only Pine Script strategy designed to combine multiple price action concepts into a single trading framework. It integrates supply and demand zones, liquidity sweeps and runs, fair value gaps (FVGs), RSI filters, and EMA trend confirmation. The strategy also provides a visual overlay with dynamic trend-colored candles for easier chart interpretation. It is intended for multi-market use across cryptocurrencies, Forex, equities, and indices.
Originality & Value
The strategy is original in how it unifies several institutional-style price action elements and validates trades only when they align. This reduces noise compared to using single indicators in isolation. Its unique value lies in the combination of:
Supply & Demand detection: Dynamic boxes identified through pivots, ATR, and volume sensitivity.
Liquidity sweeps and runs: Detects when swing highs/lows are broken and retested, distinguishing between liquidity grabs (sweeps) and directional runs.
RSI filter: Can be set to normal or aggressive, confirming momentum before trades.
Fair Value Gaps (FVGs): Optional detection and filtering of price inefficiencies.
EMA filter: Aligns trades with the broader market trend.
Trend candle visualization: Candles dynamically colored bullish, bearish, or neutral, based on strategy positions.
This layered confluence approach ensures that entries are not taken on a single condition but require agreement across several dimensions of market structure, momentum, and order flow.
Functionality & Indicators
Supply & Demand Zones: Zones are created when pivots, ATR sensitivity, and volume thresholds overlap.
Liquidity: Swing highs and lows are tracked, with options for sweep (fakeout/reversal) or run (continuation) detection.
RSI: Confirms long signals when oversold and shorts when overbought, with configurable aggressiveness.
FVG filter: Adds validation by requiring price interaction with inefficiency zones.
EMA filter: Ensures longs are above EMA and shorts below EMA.
Signals & Visualization: Trade entries are marked on the chart, while candles change color to reflect trade direction and status.
Parameters & Customization
Supply & Demand: Sensitivity (swing range, volume multiplier, ATR multiplier) and display options.
Liquidity filter: Mode (Run or Sweep), display, and swing length.
RSI: Enable/disable, length, and style (normal or aggressive).
Fair Value Gaps: Sensitivity via ATR factor, optional volume filter, and display toggles.
EMA: Length, enable/disable, and visualization.
Risk management: Up to three configurable take-profit levels, stop-loss, break-even logic, and capital-based position sizing.
Visualization: Custom candle coloring and optional overlay for better clarity.
Default Properties (Strategy Settings)
Initial Capital: 10,000 USD
Position Size: 100% of equity per trade (backtest default)
Commission: 0.1%
Slippage: 1
Pyramiding: 0 (only one position at a time)
Note: The default of 100% equity per trade is used for testing purposes only and would not be sustainable in real trading. A typical allocation in practice would be between 1–5% of account equity per trade, sometimes up to 10%.
Backtesting & Performance
Backtests on XPTUSD over 2.5 years with the default settings produced:
164 trades
67.68% win rate
Profit factor: 1.7
Maximum drawdown: 27.81%
These results show how the confluence of supply/demand, liquidity, and RSI filters can produce robust setups. However, past performance does not guarantee future results. While the trade count (164) is sufficient for statistical analysis, results may vary across markets and timeframes.
Risk Management
Three configurable take-profit levels with percentage allocation.
Initial stop-loss based on user-defined percentage.
Dynamic stop-loss that adjusts with market movement.
Break-even logic that shifts stops to entry after predefined gains.
Position sizing based on risk percentage of equity.
This framework allows both conservative and aggressive configurations, depending on user preference.
Limitations & Market Conditions
Works best in volatile and liquid markets such as crypto, metals, indices, and FX.
May produce false signals in low-volume or sideways environments.
Unexpected news or macro events can override technical conditions.
Default position sizing of 100% equity is highly aggressive and should be reduced before any practical use.
Usage Guide
Add “Quantura – Quantified Price Action Strategy” to your chart.
Select Supply & Demand, Liquidity, RSI, EMA, and FVG settings according to your market and timeframe.
Configure risk management: take-profits, stop-loss, and risk-per-trade percentage.
Use the Strategy Tester to analyze statistics, equity curve, and performance under different conditions.
Optimize parameters before applying the strategy to different markets.
Author & Access
Developed 100% by Quantura. Published as an Invite-Only script.
Important
This description complies with TradingView’s publishing rules. It clarifies originality, explains the underlying logic, discloses default properties, and presents backtest results with realistic disclaimers.

OutsiderEdge - Adaptive Node Efficiency Function (ANEF)Overview - What is ANEF?
ANEF is a zero-centered oscillator that blends price efficiency, effective volume around VWAP (node proximity), order-flow imbalance (uptick/downtick proxy), and returns volatility into a single, normalized score. The goal is to help you spot efficient breakouts and inefficient mean-reversions in a way that’s transparent, systematic, and easy to align with your own analysis.
Users can combine ANEF’s components to build rules such as: “ Only consider short breakout signals when trend context is bearish and the ANEF score pushes into the Efficient Zone ,” or “ Look for mean-reversion setups when the ANEF score sinks into the Inefficient Zone while trend context remains bullish. ”
While ANEF can stand on its own, it also works well as a secondary confirmation layer to a user’s primary process (volume profile, price action, S/R, market structure, or your preferred overlays).
🔹 FEATURES
Below is each ANEF component/feature in the order that typically leads to the most confluence.
ANEF Core (Normalized Score)
Combines a price change term with effective volume near VWAP and order-flow imbalance, scaled by volatility and normalized into a zero-centered oscillator.
Read it like a pressure gauge: high positive values = efficient upside impulse risk; deep negative values = inefficient pressure that often reverts.
Efficient & Inefficient Zones (Thresholds)
Two user-set levels (default ≥ +4.6 and ≤ −4.6) to quickly see when ANEF pushes into efficient breakout territory (top zone) or inefficient territory (bottom zone).
Thresholds are not overbought/oversold; they’re contextual “efficiency bands.”
2nd-Signal Confirmation (Optional)
An opt-in rule to ignore the first signal of a type and only print the second occurrence within X bars (default 6).
Reduces one-off noise without repainting or lookahead.
Trend Context (EMA-based Wave, Optional)
A lightweight EMA context that lets you filter signals (e.g., only show ▼ in downtrend, only show ▲ in uptrend).
The context is plotted as a sub-pane wave centered around zero so it doesn’t fight for price-panel space.
Clean Alerts (Raw & Confirmed)
Raw alerts fire at zone interactions.
Confirmed alerts respect the 2nd-signal rule and (optionally) the trend filter.
Price-Panel Markers (through force_overlay)
Even with the oscillator in a separate pane, ANEF can print mini markers on the main chart.
Useful to correlate impulses/reversions with structure, S/R, or higher-TF levels.
🔹 USAGE
In the examples below, you see chart snapshot with five labeled points of (in)efficiency breakouts.
ICMARKETS:UK100
Point 1 — Efficient Downside Breakout (▼)
ANEF surges into the Efficient Zone, indicating downside momentum that’s aligned with node volume/imbalance and volatility. Typical use: trend-following continuation, takeprofit on existing long or tightening risk on existing shorts (invalidations above recent structure).
Point 2 — Inefficient Upside Reversion (▲)
First rebound after the selloff with ANEF deep in the Inefficient Zone. Not an ideal long entry on its own, but a good management cue: take partial profits on shorts or tighten stops as an early confirmation that the drop may be exhausting.
Point 3, 4 and 5 — Inefficient Upside Reversion (▲)
Another 3x ▲ appears as price forms a higher low and ANEF prints a less extreme negative reading. With the “second-signal within X bars” option enabled, this becomes a more credible mean-reversion attempt. Possible long entries or takeprofits on existing shorts.
Trading involves substantial risk. This tool is for educational purposes only and is not financial advice. Past performance does not guarantee future results. You are solely responsible for your trading decisions and risk management.
🔹 NAVIGATING MARKET CONDITIONS
Trending phases:
Expect more time in or near the zones in the trend direction.
Consider allowing only trend-aligned signals (filter ON) and using counter zone exits for trail/partials rather than counter-trend trades.
Ranging phases:
Expect frequent dips and surges into the (In)efficient Zones and back.
Counter-moves (▲ in range downs, ▼ in range ups) can be productive with tight invalidation and the 2nd-signal rule to reduce noise.
Regime shifts:
Watch for repeated failures of one side’s signals plus cross-pane confluence (e.g., context flips while ANEF re-anchors around zero).
That sequence often marks transitions where your rules should adapt (e.g., disable the trend filter temporarily or widen your 2nd-signal window).
🔹 SETTINGS SUMMARY
ANEF Core: lengthPrice, lengthVol, lengthVolat, imbalanceCap
Zones: Efficient (≥), Inefficient (≤)
Confirmation: Require 2nd signal, Lookahead bars
Trend Filter: Enable, EMA length, optional smoothing & “only show ▲/▼ with trend”
Chart Markers: Also show on main chart (force_overlay)
Alerts: Raw vs Confirmed (pick what suits your workflow)
🔹 GOOD PRACTICES
Treat signals as context cues, not as mechanical buy/sell calls. You can align ANEF with structure (S/R, HTF bias, LVN, HVN or POC) and risk management (partials on zone exit, invalidation beyond recent swing). Start with defaults; tweak parameters to match your market/TF.
🔹 LIMITATIONS / DISCLAIMER
ANEF does not use lookahead and does not repaint, but no indicator guarantees outcomes.
Thresholds are heuristics; markets can remain efficient/inefficient longer than expected.
Use appropriate position sizing and independent validation.
Trading involves substantial risk. This tool is for educational purposes only and is not financial advice. Past performance does not guarantee future results. You are solely responsible for your trading decisions and risk management.
Release Notes
v1.0 — Initial invite-only release with: normalized ANEF core, Efficient/Inefficient zones, optional EMA trend context, 2nd-signal confirmation, raw & confirmed alerts, and optional price-panel markers via force_overlay.

Quantura - Quantitative AlgorythmIntroduction
“Quantura – Quantitative Algorithm” is an invite-only Pine Script strategy designed for multi-timeframe analysis, combining technical filters with user-adjustable fundamental sentiment. It was primarily developed for cryptocurrency markets but can also be applied across other assets such as Forex, stocks, and indices. The goal is to generate structured trade signals through a confluence of techniques rather than relying on a single indicator.
Originality & Value
Quantura is not a simple mashup of indicators. Its originality comes from how multiple layers of analysis are integrated into a single decision framework . Instead of showing indicators separately, the strategy only issues trades when several conditions align simultaneously:
RSI entry triggers confirm overbought/oversold reversals.
Market structure on a higher timeframe confirms trend direction.
Order block detection highlights zones of concentrated supply and demand.
Premium/Discount zones identify potential over- and undervaluation.
HTF EMA provides trend confirmation.
Optional candlestick patterns strengthen reversal or continuation signals.
An optional correlation filter compares the main asset to a reference instrument.
This design forces agreement between different methodologies (momentum, structure, value, volume, sentiment), which reduces noise compared to using them in isolation.
Functionality & Indicators
Entry trigger: RSI exits from extreme zones.
Filters: Only valid when all selected filters (HTF structure, EMA, order blocks, premium/discount, candlesticks, correlation, volume) confirm the direction.
Fundamental bias: User-defined sentiment and analysis settings (bullish, bearish, neutral) influence whether long or short trades are permitted.
Exits: ATR-based take profit and stop loss, with optional breakeven, opposite-signal exit, and session-end exit.
Visualization: Buy/Sell markers, trend-colored candles, and an optional dashboard summarizing indicator status.
Parameters & Customization
Timeframes: Independent HTF and LTF selection.
Trading direction: Long / Short / Both.
Session and weekday filters.
RSI length and thresholds.
Filters: HTF structure, order blocks, premium/discount, EMA, candlestick, ATR volatility, volume zones, correlation.
Exit rules: ATR multipliers for TP/SL, breakeven logic, session-end exit, opposite-signal exit.
Visuals: Toggle signals, candles, dashboard, custom colors.
Default Properties (Strategy Settings)
Initial Capital: 100,000 USD
Position Size: 15% of equity per trade
Commission: 0.25%
Slippage: enabled
Pyramiding: 0 (one position at a time)
Note: The position sizing of 15% equity per trade is intentionally set for backtesting demonstration. In real trading, risking this much is considered aggressive. Most traders prefer to risk 1-5% of equity, and rarely above 10%.
Backtesting & Performance
Backtests on BTCUSD (2 years) with the above defaults showed:
112 trades
Win rate: 40%
Profit factor: 1.4
Maximum drawdown: 34%
These results illustrate how the confluence model behaves, but they are not predictive of future performance . The trade sample size (72 trades) is below the 100+ usually recommended for statistical robustness. Users should re-test with their own preferred symbols, settings, and timeframes.
Risk Management
ATR-based stops and targets scale with volatility.
Commission and slippage are included by default for realistic modeling.
Opposite-signal exit helps capture trend reversals.
Session-end exit can close intraday positions before illiquid hours.
Breakeven option protects profits when available.
Although the default allocation uses 15% per trade for demonstration, this is not a recommendation. Users are encouraged to adjust risk sizing downwards to sustainable levels (commonly 1-5%).
Limitations & Market Conditions
Performs best in volatile, liquid markets (e.g., crypto).
May struggle in prolonged sideways markets with low volatility.
News events and fundamentals outside user inputs can override signals.
Backtests below 100 trades should be considered exploratory, not statistically conclusive.
Usage Guide
Add “Quantura – Quantitative Algorithm” to your chart in strategy mode.
Select HTF and LTF timeframes, trading direction, and session filters.
Configure confluence filters (structure, EMA, order blocks, premium/discount, candlestick, correlation, volume).
Set sentiment and analysis bias in fundamental settings.
Adjust ATR multipliers and exits.
Review buy/sell signals and analyze performance in the Strategy Tester.
Author & Access
Developed 100% by Quantura . Distributed as an Invite-Only script . Details are provided in the Author’s Instructions field.
Important: This description complies with TradingView’s Script Publishing Rules and House Rules. It does not guarantee profitability, avoids unrealistic claims, and explains how the strategy integrates multiple methods into a coherent decision framework.

Island Reversal [LuxAlgo]The Island Reversal tool allows traders to identify reversal patterns directly on the chart. These patterns signal a potential change in trend, either from bullish to bearish or vice versa.
The tool enables traders to filter these patterns by trend, volume, and range, making it easy to display pure or less constrained island reversals.
🔶 USAGE
An island reversal pattern may indicate a change in trend. It occurs when prices change direction from an uptrend to a downtrend, or vice versa.
This pattern is a great tool for timing the market. Traders should be aware of when these patterns develop and watch how prices behave after the pattern forms.
Now, let's take a closer look at one of these island reversal patterns to highlight its different components.
The different parts are depicted in the image above.
1. A trend prior to the pattern
2. A gap starts the pattern.
3. A range of prices
4. A final gap, opposite to the first one, closes the pattern.
5. In this case, the pattern leads to a bearish trend, which is opposite to the trend in the first step.
🔹 Trend, Volume and Range Filters
Enabling the trend filter causes the tool to only detect top island reversals during a bullish trend and bottom island reversals during a bearish trend.
Traders can adjust the size of the detected trend in the settings panel. The larger the trend size, the more relevant the reversal patterns can be.
The volume filter only detects reversal patterns if there is more volume within the range of the pattern than in the preceding trend.
The idea is that more people tend to participate at the top and bottom of a trend as it changes direction.
The tool has two range filters that discriminate the range within the island reversal pattern:
Horizontality Filter (R2): Based on the R-squared statistic from linear regression, it detects whether the price is moving sideways within the range.
Volatility Filter: Based on long-term volatility, it detects the size of the range within the pattern.
The smaller the value in the Horizontality Filter, the more horizontal the prices will be within the range. A larger value will detect more reversal patterns.
The larger the value in the Volatility Filter, the larger the ranges will be. A smaller value will detect fewer reversal patterns.
🔶 SETTINGS
🔹 Trend Filter
Trend Filter: Enable or disable the trend filter.
Trend Length: Select the size of the detected trend.
🔹 Volume Filter
Volume Filter: Enable or disable the volume filter.
🔹 Range Filter
Horizontality Filter (R2): Enable or disable the Horizontality filter and select a threshold value.
Volatility Filter: Enable or disable the Volatility filter and select the multiplier value.
🔹 Style
Bullish: Select a color for bullish sessions.
Bearish: Select a color for bearish sessions.
Transparency: Select a transparency level from 100 to 0.

Strategy Builder v1.0.0 [BigBeluga]🔵 OVERVIEW
The Strategy Builder combines advanced price-action logic, smart-money concepts, and volatility-adaptive momentum signals to automate high-quality entries and exits across any market. It blends trend recognition, market structure shifts, order block reactions, imbalance (FVG) signals, liquidity sweeps, candlestick confirmations, and oscillator-powered divergences into one cohesive engine.
Whether used as a full automation workflow or as a structured confirmation framework, this strategy provides a disciplined, rules-driven method to trade with logic — not emotion.
🔵 BACKTEST WINDOW CONTROL
This module allows you to restrict strategy execution to a specific historical period.
Ideal for performance isolation, regime testing, and forward-walk validation.
Limit Backtest Window
Enabling this option activates custom date filters for the backtest engine.
Start — Define the starting date & time for backtesting
End — Define the ending date & time for backtesting
Only trades and signals inside this window are executed
Reduces computation load on large datasets
Useful for testing specific market environments (e.g., bull cycles, crash periods, sideways regimes)
🔵 SIGNAL GLOSSARY (Advanced Technical Explanation)
Traders can build long and short setups using up to 6 configurable entry conditions for each direction.
Every condition can be set as Bullish or Bearish and mapped to any signal source — allowing deep customization
Below is the full internal logic overview of every signal available in the Strategy Builder.
Signals are based on trend models, volatility structures, liquidity logic, oscillator behavior, and market structure mapping.
Trend Signals (Low-Lag Trend Engine)
Uses a proprietary low-lag baseline + momentum gradient model to detect directional bias.
Trend Signal — Momentum breaks above/below adaptive trend baseline.
Trend Signal+ — Stronger trend confirmation using volatility-weighted momentum.
Trend Signal Any — Triggers when any bullish/bearish trend signal appears.
SmartBand & Retests (Adaptive Volatility Bands)
Dynamic envelope that contracts/expands with volatility & trend strength.
SmartBand Retest — Price retests dynamic band and rejects, confirming continuation.
ActionWave Signals (Impulse-Pullback Engine)
Tracks wave behavior, acceleration and deceleration in price.
ActionWave — Detects directional impulse strength vs pullback weakness.
ActionWave Cross — Momentum acceleration threshold crossed → trend ignition.
Magnet Signals (Liquidity Gravity + Mean Reversion Bias)
Detects zones where price is being drawn due to liquidity voids or imbalance.
Magnet — Trend and liquidity pressure align, creating directional “pull.”
MagnetBar Low Momentum — Low-volatility compression → pre-breakout condition.
Flow Trend (Directional Flow State + ATR Envelope)
Higher-timeframe bias confirmation + dynamic volatility filter.
FlowTrend — Confirms major directional bias (uptrend or downtrend).
FlowTrend Retest — Price tests HTF flow band and rejects → trend resume.
Voltix (Volatility Expansion Pulse)
Detects regime shift from quiet accumulation → trending expansion.
Voltix — Breakout volatility signature, trend acceleration trigger.
Candlestick Pattern (Algorithmic Price Action Recognition)
Auto-recognizes meaningful reversal or continuation candle formations.
Candlestick Pattern — Confirms momentum reversal/continuation via candle logic.
OrderBlock Logic (Institutional Footprint System)
Institutional demand/supply zone tracking with mitigation logic.
Order Block Touch — Price taps institutional zone → reaction filter.
Order Block Break — OB invalidation → institutional flow shift.
Market Structure Engine (Swing Logic + Volume Confirmation)
Tracks major swing breaks and structural reversals.
BoS — Break of Structure in trend direction (continuation bias).
ChoCh — Change of Character — early reversal marker.
Fair Value Gaps (Imbalance & Volume Displacement)
Identifies inefficiencies caused by rapid displacement moves.
FVG Created — Price leaves inefficiency behind.
FVG Retest — Price returns to rebalance inefficiency → reaction zone.
Liquidity Events (Stop-Run & Reversal Logic)
Detects stop-hunt events and liquidity sweeps.
SFP — Swing failure & wick sweep → reversal confirmation.
Liquidity Created — New equal highs/lows form liquidity pool.
Liquidity Grab — Sweep through liquidity line followed by rejection.
Support / Resistance Break Logic
Adaptive zone recognition + momentum confirmation.
Support/Resistance Cross — Zone decisively broken → structural shift.
Pattern Breakouts (Market Geometry Engine)
Tracks breakout from compression & expansion formations.
Channel Break — Channel breakout → trend acceleration.
Wedge Break — Break from contraction wedge → burst of momentum.
Session Logic (Opening Range Behavior)
Session-based volatility trigger.
Session Break — Break above/below session opening range.
Momentum / Reversal Oscillator Suite
Oscillator-driven exhaustion & reversal signals.
Nautilus Signals — Momentum reversal signature (oscillator shift).
Nautilus Peak — Momentum peak → exhaustion risk.
OverSold/Overbought ❖ — Extreme exhaustion zones → reversal setup.
DipX Signals ✦ — Dip buy / Dip sell timing, micro-reversal engine.
Advanced Divergence Engine
Momentum/price disagreement layer with multi-trigger confirmation.
Normal Divergence — Classic divergence reversal.
Hidden Divergence — Trend continuation divergence.
Multiple Divergence — Multiple divergence confirmations stacked → high confidence.
🔧 Adjustable Signal Logic
Some signals in this system can be additionally refined through the strategy settings panel.
This allows traders to tune internal behavior for different market regimes, assets, and volatility conditions.
🔵 LONG / SHORT EXIT CONDITIONS
This section allows you to automate exits using the same advanced market conditions available for entries.
Each exit rule consists of:
Toggle — Enable/disable individual exit rule.
Direction Filter — Trigger exit only if selected market bias appears (Bullish/Bearish).
Signal Type — Choose which market event triggers the exit (same list as entry conditions).
When the active conditions are met, the strategy automatically closes the current position — ensuring emotion-free risk management and systematic trade control.
🔵 TAKE PROFIT & STOP LOSS SYSTEM
This strategy builder provides a fully dynamic risk-management engine designed for both systematic traders and discretionary confirmation users.
Take Profit Logic
Scale out of trades progressively or exit fully using algorithmic TP levels.
Up to 3 Take-Profit targets available
Choose TP calculation method:
• ATR-based distance (volatility-adaptive targets)
• %-based distance (fixed percentage from entry)
Define Size — ATR multiplier or % value
Custom Exit Size per TP (e.g., 25% / 25% / 50%)
Visual TP plotting on chart for clarity
Stop Loss Logic
Automated protection logic for every trade.
Two SL Modes:
• Fixed Stop Loss — static SL from entry
• Trailing Stop Loss — SL follows price as trade progresses
Distance options:
• ATR multiplier (adapts to volatility)
• %-based from entry (fixed distance)
SL dynamically draws on chart for transparency
Trailing SL behavior:
Follows price only in profitable direction
Never moves against the trade
Locks profits as trend develops
🔵 Strategy Dashboard
A compact on-chart performance dashboard is included to help monitor live trade status and backtest results in real time.
It displays key metrics:
Start Capital — Initial account balance used in simulation.
Position Size — % of capital allocated per trade based on user settings (It changes if the trade hits take profits, when more than one take profit is selected).
Current Trade — Shows active trade direction (Long / Short) and real-time % return from entry.
Closed Trades — Counter of completed positions, useful for reading sample size during testing.
🔵 CONCLUSION
The Strategy Builder brings together a powerful suite of smart-money and momentum-driven signals, allowing traders to automate robust trade logic built on modern market structure concepts. With access to trend filters, order blocks, liquidity events, divergence signals, volatility cues, and session-based triggers, it provides a deeply adaptive trade engine capable of fitting many market environments.

Ultimate MACD Suite [BigBeluga]🔵 OVERVIEW
The Ultimate MACD Suite is an advanced momentum-based system that enhances the classic MACD with modern features tailored for professional traders.
It transforms MACD into a full market-decision engine — offering multi-timeframe confluence, adaptive histogram behavior, divergence detection, heatmap trend visualization, and actionable reversal signals.
This toolkit goes far beyond standard MACD, helping traders identify trend momentum shifts, exhaustion zones, high-probability reversal areas, and breakout confirmation signals across multiple timeframes simultaneously. It's to be used as part of a major trading system and to simplify usage of the MACD.
⚠️ Note:
This is not a traditional MACD — it uses normalized values , enhanced visual feedback, and a multi-timeframe dashboard engine for superior signal quality and clarity.
🔵 CONCEPTS
Combines MACD momentum, signal-line crossovers, and histogram reversals into one system
Uses normalized scaling to detect extreme momentum levels and exhaustion zones
Multi-timeframe dashboard displays consensus signal alignment across several timeframes
Divergence engine identifies bullish & bearish trend weakening early
Heatmap mode visually distinguishes strong trend phases from neutral or fading momentum
Reversal arrows & crosses highlight actionable turning points on chart
🔵 FEATURES
Normalized MACD Engine — improves signal clarity across all assets/timeframes
MACD Heatmap Mode — color-coded slope intensity for trend strength monitoring
MACD Rising and Falling Mode — color-coded rising and falling MACD regimes
Histogram Reversal Detection — early momentum fade signal before price turns
Signal-Line Momentum Shifts — bullish ▲ & bearish ▼ alerts on cross-confirmation
Overbought/Oversold Bands — enhanced visual thresholds at ±80 levels
Smart Divergence Detection (Non-Lag) — confirms regular bullish & bearish divergences
Multi-Timeframe Dashboard — MACD, signal, histogram & divergence signals across 5+ TFs
Reversal Push-Filter — ensures only clean signals after confirmed momentum inflection
On-Chart Reversal Labels — optional compact signal markers for clean visual execution
Histogram Color Logic — rising/falling or heatmap mode for deeper momentum reading
🔵 HOW TO USE
Look for MACD crossing above signal + green histogram to confirm bullish momentum
Use ▼ and ▲ arrows to catch confirmed momentum reversals
Monitor the dashboard — the more timeframes align, the stronger the setup
Watch divergences for trend exhaustion or reversal setups
Treat histogram trend shifts as early momentum clues before price reacts
Use ±80 levels to identify overheated conditions & fade opportunities
Combine with structure, volume, or BigBeluga liquidity tools for higher accuracy
🔵 ALERTS
The indicator includes a full alert suite for automation and real-time trade readiness:
MACD crossovers (Bullish / Bearish)
Histogram reversals & zero-line shifts
Bullish / Bearish divergence detection
Overbought / Oversold MACD alerts
Bullish ▲ and bearish ▼ reversal triggers
Use these alerts to automate signal monitoring or feed algorithmic systems.
🔵 CONCLUSION
The Ultimate MACD Suite transforms a classic indicator into a powerful trading engine.
With multi-timeframe alignment, heatmapping, divergence logic, normalized scaling and automated signals, it becomes an elite momentum-confirmation and reversal-timing system built for serious traders.
Whether scalping intraday or managing swing positions, this MACD engine helps identify the most profitable phases of trend movement — while warning early when a trend is weakening.
付費腳本

Ultimate RSI Suite [BigBeluga]🔵 OVERVIEW
The Ultimate RSI Suite elevates the classic RSI into a full professional trading system.
It combines momentum analysis, advanced divergence detection, volatility-based RSI channels, multi-timeframe signals, deviation tracking, and reversal alerts into one powerful tool.
This is no ordinary RSI — it’s a complete momentum intelligence engine designed to identify trend strength, exhaustion, breakout conditions, and reliable reversal points with high precision.
⚠️ Note:
This suite enhances RSI with MTF dashboards, dynamic channels, deviation logic, and smart alerting — ideal for scalpers, swing traders, and institutional-style trend followers.
🔵 CONCEPTS
Measures market momentum to detect overbought/oversold zones and trend health
Tracks RSI behavior relative to dynamic channels (BB/Keltner/Donchian)
Identifies regular bullish & bearish divergences
Detects deviation moves after divergence to confirm trend continuation or exhaustion
Multi-timeframe RSI conditions reveal higher-timeframe confluence
Reversal triggers confirm early momentum shifts
Overbought/oversold gradients visually highlight exhaustion zones
🔵 FEATURES
Classic + Enhanced RSI with configurable lookback & price source
RSI-Channel System (Bollinger, Keltner, Donchian) for volatility-adaptive trend structure
RSI-Smoothing MA for trend direction filters
RSI Reversal Signals for early trend inflection detection
RSI Reversal Signals Deviation Levels +1 / +2 for advanced continuation confirmation
Overbought/Oversold Gradient Zones at 35/65 or user-defined levels
Divergence Engine for bullish & bearish momentum exhaustion signals
On-Chart Divergence & Signals (full overlay capability)
Divergence Engine Deviation Levels +1 / +2 for advanced continuation confirmation
Multi-Timeframe Dashboard (RSI OB/OS, signals, divergences, channel breaks)
• Hover your mouse over any signal cell to see how many bars ago it was triggered
• Signals automatically expire after 50 bars
Smart Alerts for divergence, reversals, channel breaks, and deviation triggers
🔵 HOW TO USE
Enter long when RSI reverses from oversold & prints bullish divergence or a ▲ signal
Enter short when RSI reverses from overbought & prints bearish divergence or ▼
Use channel breaks to confirm momentum expansions or trend shifts
Look for deviation crosses (+1 / +2) for strong confirmation after divergence
Track MTF table — more timeframe agreement = stronger conviction
Avoid trading against MTF RSI extremes (OB/OS stacked zones)
Combine with market structure or volume-based tools for maximum precision
🔵 ALERTS
Includes full automation suite:
Bullish / Bearish divergence
Reversal signals (▲ / ▼)
Channel breakouts (Up/Down)
Deviation +1 / +2 confirmation triggers
Extra RSI signal deviation alerts for precision continuation reads
Great for automated systems, confirmation models, and high-probability intraday/swing entries.
🔵 CONCLUSION
The Ultimate RSI Suite transforms RSI into a smart momentum-analysis system.
With multi-timeframe logic, dynamic channels, advanced divergence/deviation systems, and powerful visual cues, it offers institutional-grade trend, exhaustion, and reversal detection.
If you rely on RSI, this toolkit provides superior clarity, deeper context, and stronger execution timing — making it an elite upgrade for professional traders.
付費腳本

Ornstein-Uhlenbeck Trend Channel [BOSWaves]Ornstein-Uhlenbeck Trend Channel - Adaptive Mean Reversion with Dynamic Equilibrium Geometry
Overview
The Ornstein-Uhlenbeck Trend Channel introduces an advanced equilibrium-mapping framework that blends statistical mean reversion with adaptive trend geometry. Traditional channels and regression bands react linearly to volatility, often failing to capture the natural rhythm of price equilibrium. This model evolves that concept through a dynamic reversion engine, where equilibrium adapts continuously to volatility, trend slope, and structural bias - forming a living channel that bends, expands, and contracts in real time.
The result is a smooth, equilibrium-driven representation of market balance - not just trend direction. Instead of static bands or abrupt slope shifts, traders see fluid, volatility-aware motion that mirrors the natural pull-and-release dynamic of market behavior. Each channel visualizes the probabilistic boundaries of fair value, showing where price tends to revert and where it accelerates away from its statistical mean.
Unlike conventional envelopes or Bollinger-type constructs, the Ornstein-Uhlenbeck framework is volatility-reactive and equilibrium-sensitive, providing traders with a contextual map of where price is likely to stabilize, extend, or exhaust.
Theoretical Foundation
The Ornstein-Uhlenbeck Trend Channel is inspired by stochastic mean-reversion processes - mathematical models used to describe systems that oscillate around a drifting equilibrium. While linear regression channels assume constant variance, financial markets operate under variable volatility and shifting equilibrium points. The OU process accounts for this by treating price as a mean-seeking motion governed by volatility and trend persistence.
At its core are three interacting components:
Equilibrium Mean (μ) : Represents the evolving balance point of price, adjusting to directional bias and volatility.
Reversion Rate (θ) : Defines how strongly price is pulled back toward equilibrium after deviation, capturing the self-correcting nature of market structure.
Volatility Coefficient (σ) : Controls how far and how quickly price can diverge from equilibrium before mean reversion pressure increases.
By embedding this stochastic model inside a volatility-adjusted framework, the system accurately scales across different markets and conditions - maintaining meaningful equilibrium geometry across crypto, forex, indices, or commodities. This design gives traders a mathematically grounded yet visually intuitive interpretation of dynamic balance in live market motion.
How It Works
The Ornstein-Uhlenbeck Trend Channel is constructed through a structured multi-stage process that merges stochastic logic with volatility mechanics:
Equilibrium Estimation Core : The indicator begins by identifying the evolving mean using adaptive smoothing influenced by trend direction and volatility. This becomes the live centerline - the statistical anchor around which price naturally oscillates.
Volatility Normalization Layer : ATR or rolling deviation is used to calculate volatility intensity. The output scales the channel width dynamically, ensuring that boundaries reflect current variance rather than static thresholds.
Directional Bias Engine : EMA slope and trend confirmation logic determine whether equilibrium should tilt upward or downward. This creates asymmetrical channel motion that bends with the prevailing trend rather than staying horizontal.
Channel Boundary Construction : Upper and lower bands are plotted at volatility-proportional distances from the mean. These envelopes form the “statistical pressure zones” that indicate where mean reversion or acceleration may occur.
Signal and Lifecycle Control : Channel breaches, mean crossovers, and slope flips mark statistically significant events - exhaustion, continuation, or rebalancing. Older equilibrium zones gradually fade, ensuring a clear, context-aware visual field.
Through these layers, the channel forms a continuously updating equilibrium corridor that adapts in real time - breathing with the market’s volatility and rhythm.
Interpretation
The Ornstein-Uhlenbeck Trend Channel reframes how traders interpret balance and momentum. Instead of viewing price as directional movement alone, it visualizes the constant tension between trending force and equilibrium pull.
Uptrend Phases : The equilibrium mean tilts upward, with price oscillating around or slightly above the midline. Upper band touches signal momentum extension; lower touches reflect healthy reversion.
Downtrend Phases : The mean slopes downward, with upper-band interactions marking resistance zones and lower bands acting as reversion boundaries.
Equilibrium Transitions : Flat mean sections indicate balance or distribution phases. Breaks from these neutral zones often precede directional expansion.
Overextension Events : When price closes beyond an outer boundary, it marks statistically significant disequilibrium - an early warning of exhaustion or volatility reset.
Visually, the OU channel translates volatility and equilibrium into structured geometry, giving traders a statistical lens on trend quality, reversion probability, and volatility stress points.
Strategy Integration
The Ornstein-Uhlenbeck Trend Channel integrates seamlessly into both mean-reversion and trend-continuation systems:
Trend Alignment : Use mean slope direction to confirm higher-timeframe bias before entering continuation setups.
Reversion Entries : Target rejections from outer bands when supported by volume or divergence, capturing snapbacks toward equilibrium.
Volatility Breakout Mapping : Monitor boundary expansions to identify transition from compression to expansion phases.
Liquidity Zone Confirmation : Combine with BOS or order-block indicators to validate structural zones against equilibrium positioning.
Momentum Filtering : Align with oscillators or volume profiles to isolate equilibrium-based pullbacks with statistical context.
Technical Implementation Details
Core Engine : Stochastic Ornstein-Uhlenbeck process for continuous mean recalibration.
Volatility Framework : ATR- and deviation-based scaling for dynamic channel expansion.
Directional Logic : EMA-slope driven bias for adaptive mean tilt.
Channel Composition : Independent upper and lower envelopes with smoothing and transparency control.
Signal Structure : Alerts for mean crossovers and boundary breaches.
Performance Profile : Lightweight, multi-timeframe compatible implementation optimized for real-time responsiveness.
Optimal Application Parameters
Timeframe Guidance:
1 - 5 min : Reactive equilibrium tracking for short-term scalping and microstructure analysis.
15 - 60 min : Medium-range setups for volatility-phase transitions and intraday structure.
4H - Daily : Macro equilibrium mapping for identifying exhaustion, distribution, or reaccumulation zones.
Suggested Configuration:
Mean Length : 20 - 50
Volatility Multiplier : 1.5× - 2.5×
Reversion Sensitivity : 0.4 - 0.8
Smoothing : 2 - 5
Parameter tuning should reflect asset liquidity, volatility, and desired reversion frequency.
Performance Characteristics
High Effectiveness:
Trending environments with cyclical pullbacks and volatility oscillation.
Markets exhibiting consistent equilibrium-return behavior (indices, majors, high-cap crypto).
Reduced Effectiveness:
Low-volatility consolidations with minimal variance.
Random walk markets lacking definable equilibrium anchors.
Integration Guidelines
Confluence Framework : Pair with BOSWaves structural tools or momentum oscillators for context validation.
Directional Control : Follow mean slope alignment for directional conviction before acting on channel extremes.
Risk Calibration : Use outer band violations for controlled contrarian entries or trailing stop management.
Multi-Timeframe Synergy : Derive macro equilibrium zones on higher timeframes and refine entries on lower levels.
Disclaimer
The Ornstein-Uhlenbeck Trend Channel is a professional-grade equilibrium and volatility framework. It is not predictive or profit-assured; performance depends on parameter calibration, volatility regime, and disciplined execution. BOSWaves recommends using it as part of a comprehensive analytical stack combining structure, liquidity, and momentum context.
