Entrate, take profit e stop loss, target 1
Questo script vuole essere un aiuto nell'impostare le operazioni a mercato giorno per giorno.
A seconda della posizione che si vuole scegliere (long o short) guardando il grafico si può essere aiutati dall'indicatore Entrare.
Le linee trasparenti verdi e arancioni sono entrate:
long: la mia entrata a mercato sarà al prezzo della riga arancione trasparente, il mio stop loss alla riga rossa, il mio tp 1 alla riga bianca superiore e il tp 2 alla riga verde.
short: la mia entrata a mercato sarà al prezzo della riga verde trasparente, il mio stop loss alla riga verde, il mio tp 1 alla riga bianca inferiore e il tp 2 alla riga rossa.
Questa semplice strategia è basata su altri due script di mia creazione che trovate a questi indirizzi:
This script is made for help people with their entry day per dar.
Depending on the position yuo decided (long or short) and whatcing the chart you can be helped by this script "Entrate".
Transparent Green and Orange line are entry points:
long: the entry point will be the transparent orange line, stop loss at red line, tp1 at upper white line and tp 2 at green line.
short: the entry point will be the transparent green line, stop loss at green line, tp1 at lower white line and tp2 at red line.
This simple strategy is based on other 2 script made by me, and you can find at these links:
Buona fortuna e Good Luck!
Signals

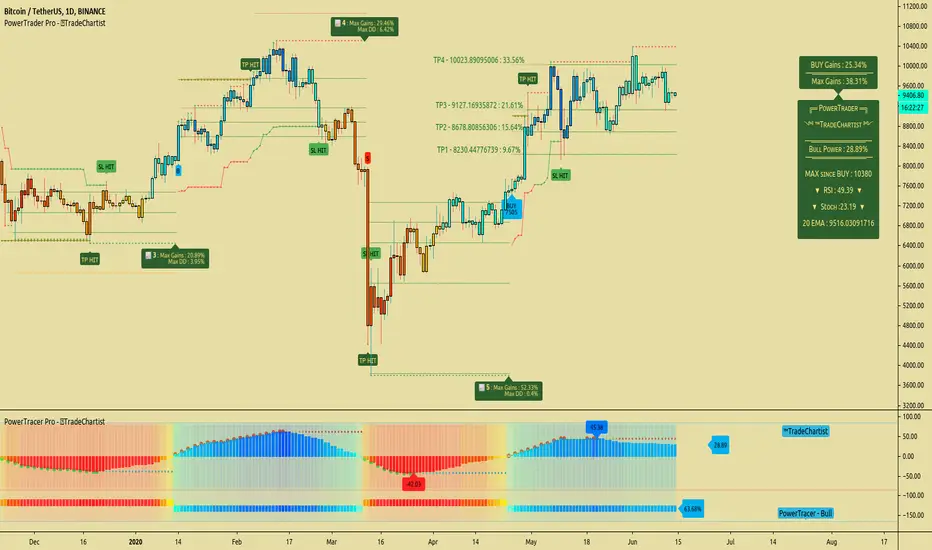
TradeChartist Plug and Trade™TradeChartist Plug and Trade is an extremely useful indicator that can be connected to almost any Study script (not a Strategy) on Trading View (with an Oscillatory or Non-Oscillatory Signal plot) to generate Trade Signals with Stop Loss plot, user set or automatic Target plots and create Alerts based on Past Performance, determined by Past Gains/Drawdowns for each Trade. The indicator is packed with a lot of features including TradeChartist's signature Dashboard and Real-time Gains Tracker, Automatic Targets Generator, Take Profit recommendation, option to paint price bars based on Trade/Price Trend, 3 types of Stop Loss plots to choose from, with option for user to set fixed Target to take profits.
1. How does ™TradeChartist Plug and Trade connect to another Study script/indicator signal?
Plug and Trade is elegantly designed with simplicity in mind, without compromising on functionality, so any trader - beginner to advanced, can just plug an external signal to the indicator with ease by just following these simple steps.
Add to price chart, the Indicator along with the signal plot to be tested and assessed for performance.
Plug the signal into ™TradeChartist Plug and Trade by choosing it from the Plug Signal Here drop-down.
Choose Signal type as Oscillatory if signal oscillates between set values or crosses a certain value periodically (Example: RSI, CCI, TRIX etc that are mostly not overlayed on Price chart and may be in a separate pane from price chart as it may not fit on Price scale), Choose Signal Type as Non Oscillatory if the signal can be plotted on price scale and Trades are normally generated when price crosses above or below it (Moving Averages, SAR indicators like SuperTrend, etc.).
For oscillators, default Oscillator value for Trade Signals is 0 as most Oscillators have 0 as their mid point. The value can be changed if the Signal doesn't oscillate with 0 as its mid point. For example, if the connected Signal is RSI, the values can be changed to Upper and Lower band values to generate Trade Signals.
Plot the Signal on chart if the signal is Non Oscillatory.
2. How can the plugged Signal's performance be assessed using ™TradeChartist Plug and Trade and subsequently used for generating Trade Entries and to create Alerts?
Once the Signal is plugged into the indicator based on steps above, Plug and Trade automatically plots the Trade entries based on the Signal type.
Plot Trade Entries after Bar Close from settings can be checked for signals that do not confirm until bar close. By doing this, repainting can be avoided for most signals and true performance can be assessed. Also, alerts can be created using Once Per Bar rather than Once Per Bar Close .
The real-time Gains Tracker and Dashboard are useful in tracking gains and other useful indicator values like RSI, Stoch, ATR and EMA in real-time with price movement.
Enabling Past Performance from settings will plot Maximum Gains achieved and Maximum Drawdown for each trade as labels . Trading View only plots finite number of labels and old labels are deleted automatically. But to access past performance beyond the last available label, bar replay can be used.
User can choose from 3 types of Stop Losses from the settings - Fixed %, Trailing % and ATR Stop Loss namely and a Fixed TP % to create plots on price chart and to create alerts.
If the user prefers automatic targets based on Trade entries, Recommend Targets can be enabled from the settings. The automatic targets are generated at the time of Trade Entry, along with Target prices and % which turn green when hit.
Each BUY and SELL Trade are tracked in its entirety and the highest high since BUY and lowest low since SELL are plotted on the price chart and also displayed on the Plug and Play Dashboard
Choppiness can be easily spotted if there are numerous Past Performance labels or several Trade Entries around a short timeframe on chart. This may mean that the signal needs smoothing or may not be suitable for the asset to trade on the chart timeframe. Suitability of a Study script for the asset can be determined in many ways using this indicator.
3. What other features are included in ™TradeChartist Plug and Trade?
Enabling Spot Price Bars to take Profit option from settings automatically plots $ sign above/below candles where Profit taking is recommended or Stop Loss moved to secure profits/reduce loss.
Enabling Paint Price Bars with Trade Trend paints price bars with colors that help picture Trade/Price trend. Trend spotting using this works best with (bars/hollow candles/candles with no border) on dark background.
Both features work on Price chart even without any Signal plugged in.
===================================================================================================================
Example Charts using different Signals plugged into ™TradeChartist Plug and Trade
1. RSI Signal (Oscillatory) plugged in with >60 for BUYs and <40 for SELLs - BTC-USDT on 1hr
2. PowerTracer Signal (Oscillatory) plugged in - GBP-USD 1hr
3. 55 period VWMA Signal (Non Oscillatory) plugged in - ADA-USDT 4hr
4. RSI Signal (Oscillatory) plugged in with >70 for BUYs and <30 for SELLs - SPX 1hr with Trailing SL - 3% and TP - 2%
===================================================================================================================
This is not a free to use indicator. Get in touch with me (PM me directly if you would like trial access to test the indicator)
Premium Scripts - Trial access and Information
Trial access offered on all Premium scripts.
PM me directly to request trial access to the scripts or for more information.
===================================================================================================================

Ichimoku ++ public v0.9Description:
The intention of this script is to build/provide a kind of work station / work bench for analysing markets and especially Bitcoin . Another goal is to get maximum market information while maintaining a good chart overview. A chart overloaded with indicators is useless because it obscures the view of the chart as the most important indicator. The chart should be clear and market structure should be easy to see. In addition, some indicator signals can be activated to better assess the quality of signals from the past. The chart environment or the chart context is important for the quality of a signal.
The intention of this script is not to teach someone how to trade or how to use these Indicators but to provide a tool to analyse markets better and to help to draw conclusions of market behaviour in a higher quality.
A general advise:
Use the included indicators and signals in a confluent way to get stoploss, buy and sell entry points. SR clusters can be identified for use in conjunction with fractals as entry and exit pints. My other scripts can also help. Prefer 4 hours, daily and a longer time frame. There is no "Holy Grail" :).
If someone is new to trading you should learn about the indicators first. Definitely learn about Ichimoku Cloud Indicator.
Integrated indicators are:
Ichimoku Cloud and signals
Parabolic SAR and signal
ATR stop
Bollinger Bands
EMA / SMA and background color as signal
Williams Fractals and signal
Puell Multiple signal

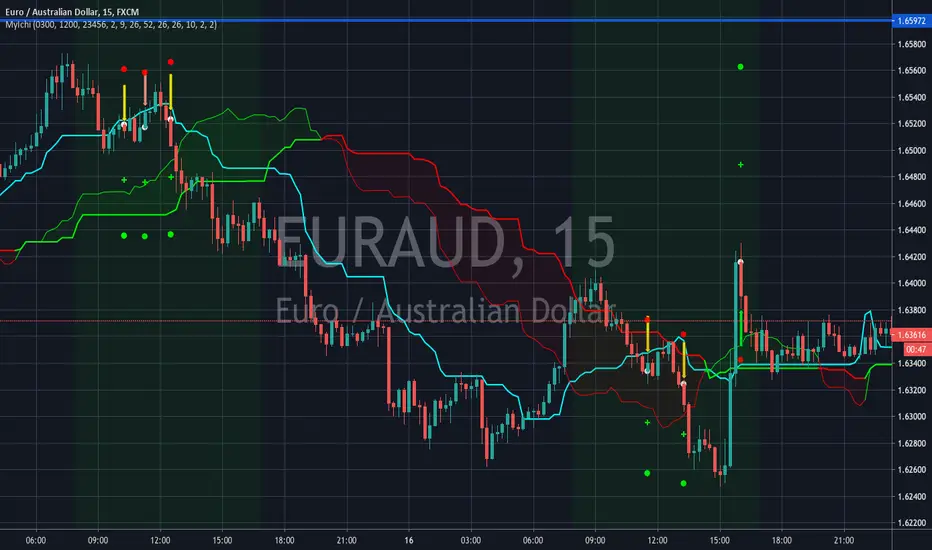
Ichimoku Signal GeneratorThis indicator uses the standard concepts of the Ichimoku Cloud. The indicator features a fully customisable set of Ichimoku lines: Tenkan Sen, Kijun Sen, Senkou Span A & B, Kumo, Chikou Span. Besides this the Indicator also features the ability to show and hide entry signals for various entry criteria for the Ichimoku indicator:
Signal 1 - Chikou crossing Kijun - The indicator will place an arrow in the direction of the trade that is suggested by this signal.
Signal 2 - Heikin Ashi Candle closing above the Kumo - This seems to filter out a lot of bad signal versus basing the signal on price closing above the Kumo alone.
Signal 3 - Price crossing the Kijun Sen in relation to the Kumo - This signal has received the most work - It generates a signal in the suggested direction of the particular condition being met i.e. price crosses below the Kijun indicates a sell and vice versa, but it also factors in where the cross happens in relation to the Kumo cloud. These signals can be switched on or off based on weak(longs below the cloud or shorts above the cloud), neutral (long or short when inside the cloud) or strong (long above the cloud or short below the cloud).
Examples of each of the different Signal 3 indicators can be seen in the screenshot. Pale/white signals are weak, yellow are neutral & green/red are strong.
Further features (only available on Signal 3 at present: entry, stop loss and take profit levels. These are determined based on the ATR periods setting and ATR Multiplier for Stop Loss - specifying an ATR period of 10 and multiplier of 2 will result in stop loss signal being shown as 2xATR(10) above or below the entry based on whether you are shown a long or short signal. For Take Profits you can specify a Risk:Reward multiplier. By default this is set to 2:1 (or 2). This takes the distance from the stop market to the entry and multiplies it by the multiplier and then indicates a signal where you "could" exit. For the risk averse trader that want some instant gratification when they hit 1:1, the indicator will show you exactly where 1:1 is. You can then follow whatever risk management strategy you wish to - personally I find this a point at which I breakeven my stop and take half the profits (now I can't lose!) :)
The indicator follows some basic Ichimoku trading rules - not all signals will result in a winning trade (this is NOT the holy grail and doesn't claim to be) - you should always follow you own risk management strategy. You should also couple this with additional analysis to try to qualify the entry signal i.e. "does this signal and direction correlate with what the higher timeframes are telling me?".
One last feature I added - mores for psychological reasons was to only show signals for the time window I would actually be trading. I hate seeing that I missed a signal when I wasn't online - and this doesn't set me up mentally for trading well. So if there was an opportunity when I would not be trading - it is matter under the bridge! It is gone and I don't want to see it as I would not have been there to take it. This trading window can be specified using the start and end times - the setting mentions EST - however you should relate them to the exchange time for the provider of the price feed - some providers may use a different timezone to others i.e. UTC vs EST.
Wish you the best of luck!
Please provide any constructive feedback as I would love to feature further enhancements to this indicator if it helps users.
Intraday BUY/SELLBUY & SELL Scalp Signals for Crude Oil Future Contracts (Or it can be used with any scrip with good amount of Volume) based on Sma & RSI overbought/oversold alert (!) for possible reversal indication.
Take Buy position only if candle breaks the high of alert candle & for Sell positions, take position if candle breaks low of the alert candle.
Best to perform with 3 min timeframe on Crude Oil Futures

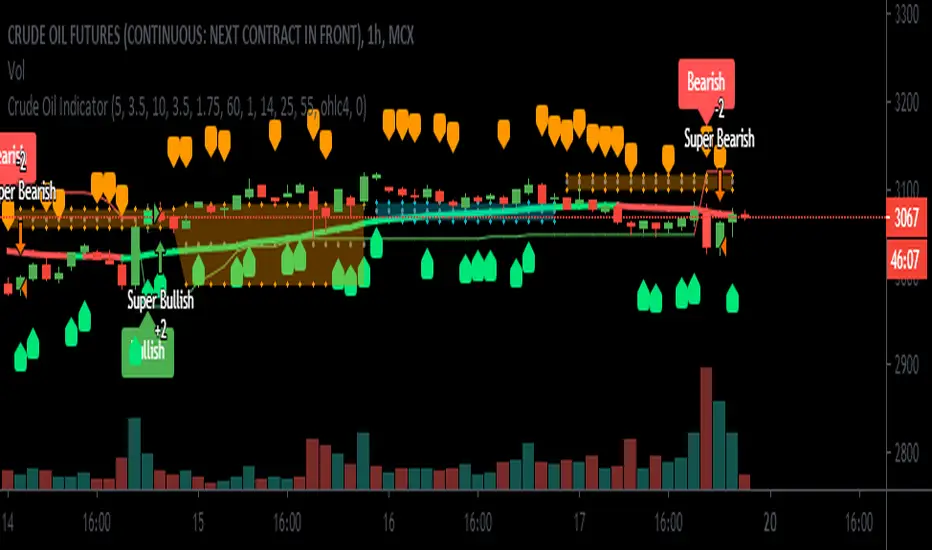
Crude Oil Indicator [SIDD]Crude Oil Indicator is giving two signal Bullish and Bearish . Bullish signal is used to take long trade and Bearish signal is used to close existing long trade and take new short trade and so on.
To get More signal of Bullish and Bearish user must enable More Signals check box that will check crossover and cross down of price close with Gaps.
I am using 2 ATR and one ADX and Gaps and VWMA to make signal profitable with 15 minutes 1 hr ,2hr,3hr,4hr chart time frame.
I have checked last few years data for back testing. Based on past performance it doesn't work well in 30 minute and 1 day chart time frame as results are not good in back testing. I have designed this indicator for Indian crude oil context though it can be used with other market as well.
1st ATR used to find trend with price crossover.
2nd ATR ADX is used to find the trend change details only. I have taken VWMA and ATR both to consider trend change.
Highlight Gap Up and Gap Down is used to know daily market opening gap up and gap down area. Gaps act as support and resistance .
VWMA Plotted as Blue line. Rising VWMA considered as uptrend and falling VWMA considered as downtrend.
Flat VWMA considered as no trend zone. In no trend zone every second third candles cross VWMA .
User must keep the default setting for getting better results as results are back tested. If setting changed then result may vary.
I have added here back tested performance user can see those results. I have added commission and slippage as well. Past year performance not guarantee for future years result so before taking any trade trader must take conscious decision.
This indicator is available on Subscription.
PM/ DM for more information about the script access.
Use the link below to obtain access to this indicator.
TradeChartist PowerTracer Pro Backtester™TradeChartist PowerTracer Pro Backtester is the strategy script for backtesting ™TradeChartist PowerTracer Pro for best performance settings which can then be used with ™TradeChartist PowerTrader Pro to plot Trades emulating the backtester and use Alerts (once per bar) on real time price chart.
PowerTracer Backtester includes the following options in the settings.
PowerTracer setting - Power Plot Type - (PowerTracer, Bar-wise Power Holder)
PowerTracer setting - Timeframe Multiplier
PowerTracer setting - Smoothing Factor
Backtester setting - Trade Direction - (Both Longs and Shorts, Only Longs, Only Shorts)
Backtester setting - SL Type (Fixed Stop Loss, Trailing Stop Loss)
Backtester setting - Reference for Trailing SL (Close, High/Low)
Backtester setting - Stop Loss %
Backtester setting - Take Profit %
Backtester setting - Quantity to trade at TP %
Using combinations of the settings, the user can find optimal settings for the asset to deliver lucrative entry and exit signals with high ROI and minimal Drawdown which can then be used on PowerTracer Pro and PowerTrader Pro to plot signals and create alerts to start trading in real-time.
Example charts:
GBP-USD 1hr chart - (2,1,Trailing SL, close, 1,1,25)
BTC-USDT 15m chart - (4,5, Trailing SL, high/low, 3.9,1.2,15)
SPX 1hr chart - (1,3, Trailing SL, high/low, 3, 2, 50)
This backtester needs the following scripts to generate signals and plots on main price chart and for real-time alerts
™TradeChartist PowerTracer Pro
™TradeChartist PowerTrader Pro
===================================================================================================================
This is not a free to use indicator. Get in touch with me (PM me directly if you would like trial access to test the indicator)
Premium Scripts - Trial access and Information
Trial access offered on all Premium scripts.
PM me directly to request trial access to the scripts or for more information.
===================================================================================================================
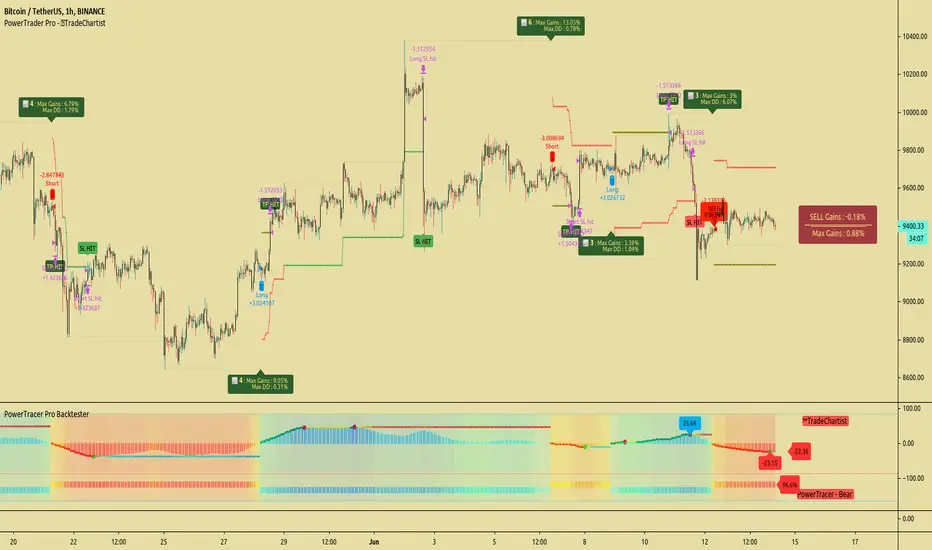
TradeChartist PowerTrader ProTradeChartist PowerTrader Pro is a versatile Signal generator and Signal plotter on the main price chart based on signals from other compatible scripts like TradeChartist PowerTracer Pro . This elegantly designed script plots the following based on user preference.
BUY and SELL signals based on external compatible signal source
Automatic Targets if opted from settings
Trailing or Fixed Stop Loss based on user input
Take Profit % and Quantity to trade based on user input
PowerTrader Dashboard displaying 14 period RSI, Stoch and 20 EMA
Real-Time Gains Tracker displaying Max Gains and open PnL
Past Performance labels displaying Max Gains and Max Drawdown for each trade
Higher Highs since BUY and Lower Lows since SELL
Once the external Signal is connected to the script, the results based on signal backtester ( TradeChartist PowerTracer Pro Backtester ) can be used to optimise the settings to generate plots and also to set Alerts for the following.
Long and Short Signals
Long and Short Stop Loss Hit
Long and Short TP Hit
Move up/down Trailing SL
To create alerts, the user must choose PowerTrader Pro from the alert condition drop-down and choose the required alert. Since the signals are generated only after confirmation, "Once per bar" must be used for Alerts.
===================================================================================================================
This is not a free to use indicator. Get in touch with me (PM me directly if you would like trial access to test the indicator)
Premium Scripts - Trial access and Information
Trial access offered on all Premium scripts.
PM me directly to request trial access to the scripts or for more information.
===================================================================================================================
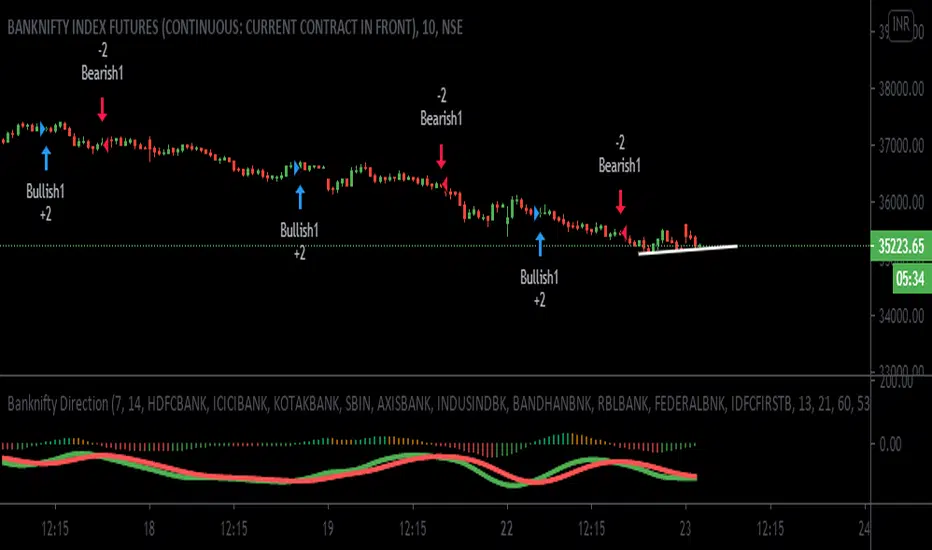
Banknifty-Direction-Bank-StocksBanknifty Direction Bank Stocks is indicator to give Banknifty future direction.
This Indicator is giving signal by taking 11 Major Indian Bank trend into consideration.
This indicator is giving two signal Bullish and Bearish .
Bullish signal can be used for long Banknifty and Bearish signal can be used to close existing Banknifty position and make new short side position and again when Bullish signal come then close existing short position and take new long position and so on.
There is zone area green zone and red zone and central line. Green zone is Bullish area and Red zone is Bearish area.
When ever green line cross over red line then Bullish signal generated and when ever green line cross under red line Bearish Signal generated.
Strong Bullish when Crossover is happening above central line and Strong Bearish when Cross under is happening below central line.
Many Thanks to LazyBear main author, I have used his wave trend function and modified that as per Banknifty index so that we can get better result.
User must keep the default setting for getting better results as results are back tested. If setting changed then result may vary.
I have added here back tested performance user can see those results. I have added commission and slippage as well.
This indicator is available on Subscription.
PM/DM for more information about the script access.
Use the link below to obtain access to this indicator
RSI with BGThis is a standard RSI indicator with Background colour and the option to draw the Background colour of the next higher timeframe.
Unfortunately, the 3D timeframe is not working properly (weekly background is not displayed). This is the same problem as with the MACD BG study.

MACD with BGThis is a standard MACD indicator with Background colour and the option to draw the Background colour of the next higher timeframe.
Trend Following IndicatorTrend Following Indicator is for following trend and being in trend till trend is not changed.
Each Bullish and Bearish signal you can add one more future or option lot and be in trade till bearish signal is not coming.
You can close Long trade i.e. Bullish pyramiding trade when you see there is small red arrows are there
and similarly when you are in Short trade you can pyramid with each Bearish signal and you can close the trade when small green arrow start coming.
Pros: This signal system is working in stocks and Index and Commodity and Currency.
Cons: Choppy market results are not good on that time you have to believe on small arrows for signals.
This signal is available on subscription. contact me or ping me for more details.

[HTI2] Hiubris Trend Indicator 2This is the Study version of the Hiubris Trend Indicator 2 (Used for Alerts)
After testing several strategies for months and comparing them to the standard 'Buy and Hold' method, we've found the best performing strategy for BTCUSDT
We simplified it to make it more user-friendly (We've only added 1 optional exit: a % SL) and left all the inputs adjustable, so it can be optimized for ANY pair!
This is a Trend Indicator! This means that the '% Profitable Trades' is not the main focus, but catching every trend swing. When trying to catch every trend swing, naturally alot of the them might be unprofitable, especially in sideways markets. The idea behind this strategy is to catch all the significant trend movements, which are alot more profitable than all the 'sideway market' losses
This indicator is fully adjustable and matches exactly the published strategy!
The user has the option to setup alerts for all chart signals (Entries, Re-Entries, Stop-Loss)

Buy/Sell IndicatorBased on logic from many top contributors here, the script utilizes LazyBear's WaveTrend Oscillator Indicator along with custom code to plot a few key components for daily trading;
Boundaries for entry and exit points which are based on a 6-day trend in OPEN/HIGH and OPEN/LOW prices.
Daily HIGH and LOW points to establish a good view of stock's movements
Entry and exit points with confidence levels. These can be treated as entry points for short to medium term investments
Entry points come in the colours of White and Lime, where white is slightly confident and lime is extremely confident
Exit points come in the colours of Maroon, and Red, where maroon is slightly confident and red is extremely confident
Each Entry and Exit point also comes without text, or with a M or H above it, where M indicates medium confidence on the point and an O indicates overconfidence.
Use Case:
The best possible use case is to enter a trade on a LIME point with O text, this means that is an overconfident entry point.
The trade should be exited on a RED point with O text, this means that is an overconfident exit point.
But you can do with the indicators as you please.
In addition to LazyBear's code, the following existing models and indicators are taken into account:
RSI of closing price over a period of 25
EMA of RSI

Tradespot Quant Tradespot - Quant is an extensive trading algorithm, signal generator and technicals screener packed into one beautifully designed, functional indicator. The script is very customisable to not limit the trader using it but does have some very respectable settings for BTCUSD & ETHUSD on the 4H and 45M charts that we run in an automated fashion here a tradespot round the clock on Binance Futures.
What does Tradespot Quant do?
Trade following signals generated via our bespoke algorithm
Full customisation to allow a deeper use of the indicator across different assets
Beautifully illustrated 'Take Profit' and 'Stop Loss' levels that are configurable to easily see how successful the model can run
Presets for BTCUSD & ETHUSD on the 4H/45M timeframes avaliable instantly for your use.
Innovative trade panel that illustrates key information such as what trade the algorithm is looking for next? is altcoin trading deemed safe or risky right now? How are the technicals looking regarding the overal market trend?
More features being added all the time, we have great ideas and our only limitation is how fast we can program it!
Do you do a free trial?
Yes! Get in touch for a complimentary 48 hour free trial to the indicator, no strings attached.
Who are you?
Tradespot has been creating scripts for years on TradingView that we use to leverage our social trading and signal group offerings. We currently have over $200K in assets trading with our strategies across over 300 users.
You can learn more about us on our website. Please reach out to me or see the link on our profile.

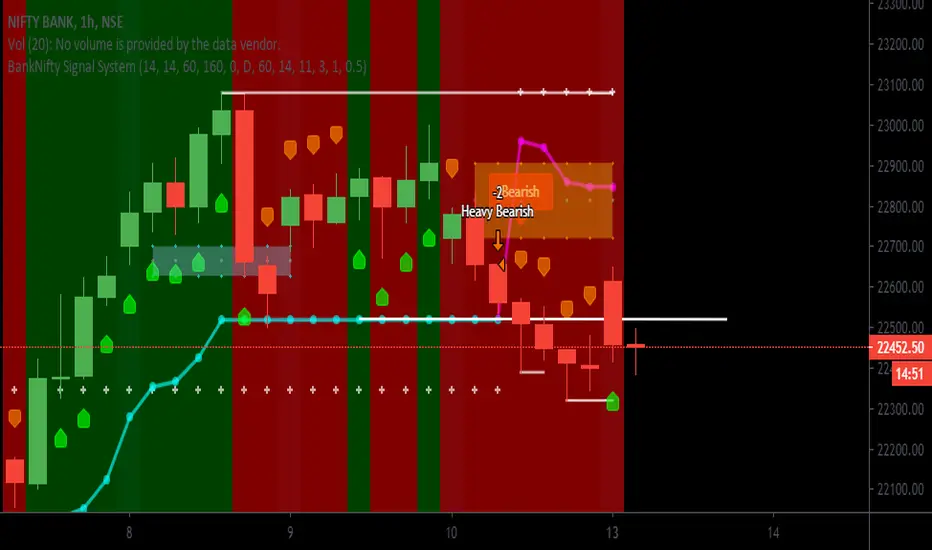
BANKNIFTY Signal SystemThis tool is made for BANKNIFTY Index of India. This system paints background for evident and clear signals based on technical analysis.
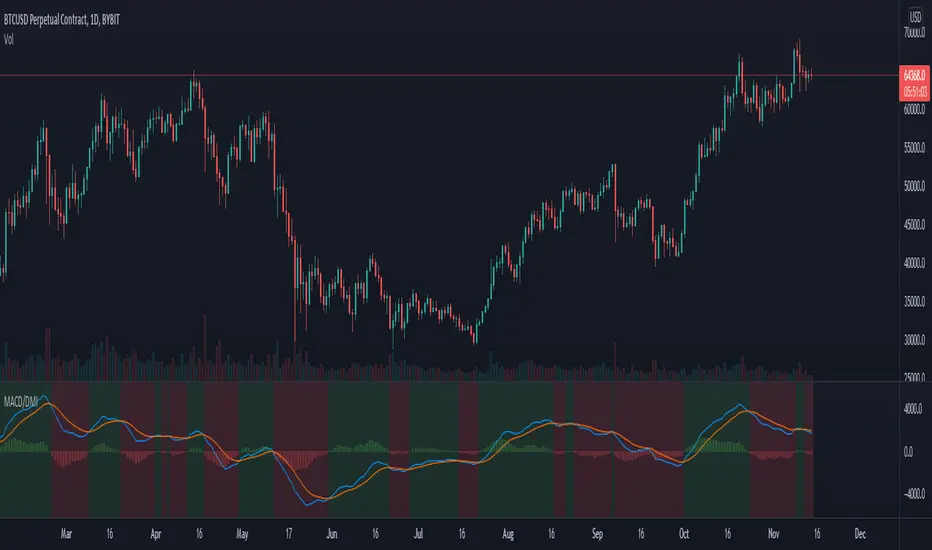
Bitcoin Dominance MomentumThis is a simple study of Bitcoin Dominance vs Altcoin Performance.
The general idea, is that as Bitcoin Dominance falls, Altcoins rise, and vice versa.
So, I decided to plot a MACD indicator of CRYPTOCAP:BTC.D to judge macro turning points in the cryptocurrency markets.

Black-Scholes Model and Greeks for European OptionsThe Black-Scholes model is a mathematical model used for pricing options. From this model you can derive the theoretical fair value of a European option (an option where you have to wait until expiry to exercise). Additionally, you can derive various risk parameters called Greeks. This indicator includes three types of data: Theoretical Option Price (blue), the Greeks (green), and implied volatility (red); their values are presented in that order.
1) Theoretical Option Price:
This first value gives only the theoretical fair value of an option with a given strike based on the Black-Scholes framework. Remember this is a model and does not reflect actual option prices, just the theoretical price based on the Black-Scholes model and its parameters and assumptions.
2)Greeks (all of the Greeks included in this indicator are listed below):
a)Delta is the rate of change of the theoretical option price with respect to the change in the underlying's price. This can also be used to approximate the probability of your option expiring in the money. For example, if you have an option with a delta of 0.62, then it has about a 62% chance of expiring in-the-money. This number runs from 0 to 1 for Calls, and 0 to -1 for Puts.
b)Gamma is the rate of change of delta with respect to the change in the underlying's price.
c)Theta, aka "time decay", is the rate of change in the theoretical option price with respect to the change in time. Theta tells you how much an option will lose its value day by day.
d)Vega is the rate of change in the theoretical option price with respect to change in implied volatility.
e)Rho is the rate of change in the theoretical option price with respect to change in the risk-free rate. Rho is rarely used because it is the parameter that options are least effected by, it is more useful for longer term options, like LEAPs.
f)Vanna is the sensitivity of delta to changes in implied volatility. Vanna is useful for checking the effectiveness of delta-hedged and vega-hedged portfolios.
g)Charm, aka "delta decay", is the instantaneous rate of change of delta over time. Charm is useful for monitoring delta-hedged positions.
h)Vomma measures the sensitivity of vega to changes in implied volatility.
i)Veta measures the rate of change in vega with respect to time.
j)Vera measures the rate of change of rho with respect to implied volatility.
k)Speed measures the rate of change in gamma with respect to changes in the underlying's price. Speed can be used when evaluating delta-hedged and gamma hedged portfolios.
l)Zomma measures the rate of change in gamma with respect to changes in implied volatility. Zomma can be used to evaluate the effectiveness of a gamma-hedged portfolio.
m)Color, aka "gamma decay", measures the rate of change of gamma over time. This can also be used to evaluate the effectiveness of a gamma-hedged portfolio.
n)Ultima measures the rate of change in vomma with respect to implied volatility.
o)Probability of Touch, is not a Greek, but a metric that I included, which tells you the probability of price touching your strike price before expiry.
3) Implied Volatility:
This is the market's forecast of future volatility. Implied volatility is directionless, it cannot be used to forecast future direction. All it tells you is the forecast for future volatility.
How to use this indicator:
1st. Input the strike price of your option. If you input a strike that is more than 3 standard deviations away from the current price, the model will return a value of n/a.
2nd. Input the current risk-free rate.(Including this is optional, because the risk-free rate is so small, you can just leave this number at zero.)
3rd. Input the time until expiry. You can enter this in terms of days, hours, and minutes.
4th.Input the chart time frame you are using in terms of minutes. For example if you're using the 1min time frame input 1, 4 hr time frame input 480, daily time frame input 1440, etc.
5th. Pick what type of option you want data for, Long Call or Long Put.
6th. Finally, pick which Greek you want displayed from the drop-down list.
*Remember the Option price presented, and the Greeks presented, are theoretical in nature, and not based upon actual option prices. Also, remember the Black-Scholes model is just a model based upon various parameters, it is not an actual representation of reality, only a theoretical one.

Twin Range Filter Algo@Colinmck used two different ranges to generate signals. Read his release notes to find out what the original script does.
I added one condition which seems to increase performance on 15m BTCUSD as well as 1h BTCUSD and that is ATR with 32 periods being smaller than ATR with 64 periods. I used my script Volatility Optimiser to discover this tendency.
Both buying and selling conditions are same as in @Colinmck's script plus one condition of my own. You can disable my condition.
Target and stop-loss are manually set values in ticks.
Time stop-loss is manually set value in a number of candles. After this number of candles, a position always exits (or should 😇). You can disable it by inserting a very long period. I do not recommend it, because a value of indicator should not be measured in luck and if market starts moving in the direction after 40 periods, the predictive capability of an indicator is questionable.
I used 300/150/17 for 15m BTCUSD chart and 900/30/17 for 1h BTCUSD. I didn't try to optimize any other parameters for these periods.
Since this script relies mostly on volatility for its prediction, I wouldn't recommend using it on its own. Individual approach to the market is recommended. Also, it didn't work on EURUSD when using the same default values and different order management (tp, sl, time sl), so it is probably not as versatile.
Let me know what do you think of this strategy. If you have some ideas about how to make it more reliable, share it in the comments, I might put it to the test. Good luck 🍀

Williams + BB Buy Sell signal
Williams %R with Bollinger Bands
This script can help traders to determine if there is a buy or sell signal.
It indicates when the Williams %R crosses the Bollingers bands levels at the overbought and oversold areas.
Red cross: when the Williams crosses the upper level of BB in the overbought area, that can be considered as a double confirmation to sold.
Green cross: when the Williams crosses the lower level of BB in the oversold area, that can be considered as a double confirmation to buy.
Configuration:
This indicator gives accurate signals with this configuration:
Williams %R: period length 12
MA period: period length 8
Bollinger bands: period length 6

Excessive Munehisa Signals 2This script builds an EMA (Exponential Moving Average) on special price conditions using the following:
Averaged price if the current bar (c.=1/4(o.+c.+l.+c.)
Midpoint of the previous bar (o.=1/2(o. of prev. bar+ c. of prev. bar)
and
h.=max(h.,o.,c.)
l.=min(l.,o.,c.)
It gives alerts on price crossing the EMA (breakout/breakdown) and plots OUT and IN when the event occurs and the trigger is activated. Script works in real time.
It is used only in trending markets like bullish trends and/or bearish trends and never in flat. It can get very bad results so pay attention!
Feel free to test it and add comments.
I am open to answer any questions.
I would like to know what you think and how can we improve this study.
Thank you & enjoy!

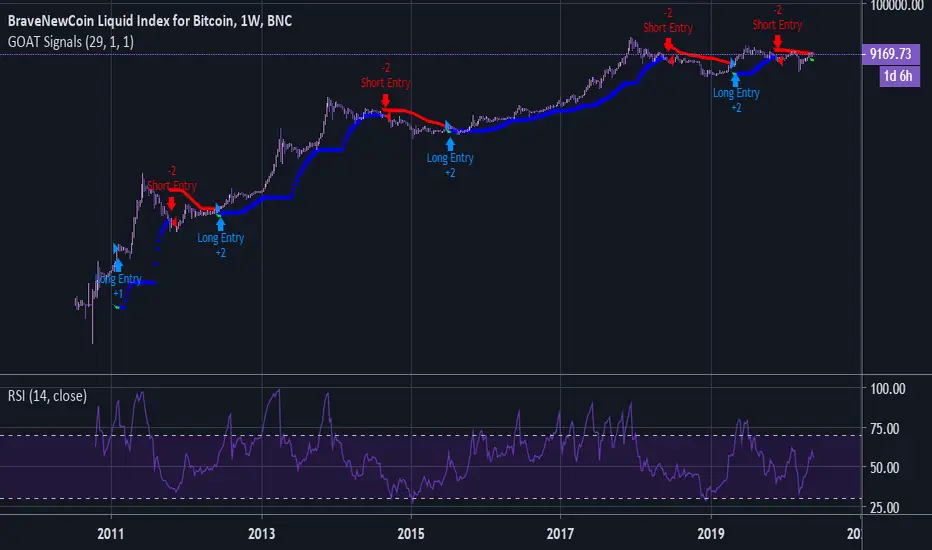
GOAT Signals Custom No Repaint Buy Sell Arrow Strategy Tester
WELCOME to GOAT Signals Custom No Repaint Buy Sell Moving Average (MA) Strategy Tester!
This indicator can quickly and easily identify the past trading success of signals based on moving averages.
What is a Moving Average?
According to investopedia.com a moving average (MA) is a widely used indicator in technical analysis that helps smooth out price action by filtering out the “noise” from random short-term price fluctuations.
Keeping this in mind let me give an example how this indicator could be useful in identifying trends.
Many Bitcoin traders use the 21 moving average on the weekly chart to make trading decisions.
Some of this has to do with 21 being a Fibonacci sequence number, and also because of how Bitcoin price action has reacted to it's trend line in the past.
When applying this script to the Bitcoin(BLX) weekly chart with a 21 moving average the strategy tester gives us 33.33 % Percent Profitable results with 6.31 % Net Profit.
If we test another moving average, let's try 29, and change our step input to 1, we get 85.71 % Percent Profitable with 9.22 % Net Profit.
With a bit of tweaking we may be able to find charts and settings with even better performance.
Keep in mind the strategy tester does not calculate trading fees, therefore in most cases will work better on longer time frames.
The Step input gives price action some breathing space if desired. Steps can be added or subtracted.
Personally, I use the Daily and Weekly charts except during high volatility, and use a one or two bar trail depending on price action.
Past performance does NOT guarantee future gains but keep in mind Bitcoin, Litecoin and a few others are on deflationary cycles.
For full invite only access please contact DogeyBlaze.
Alert Script And Limited Time Free Trial Available.
Not Certified Financial Advice.
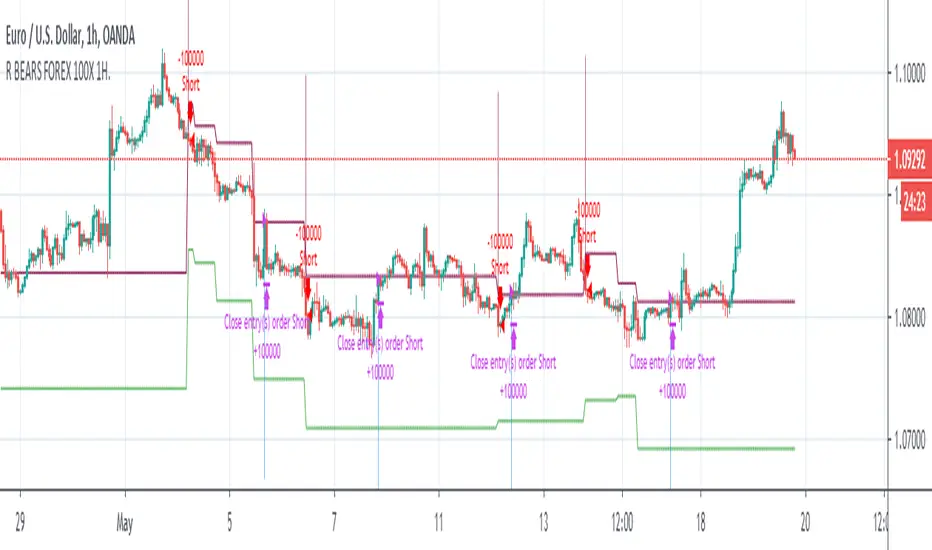
Relativity BEARS FOREX 100X 1H AlgorithmHi,
This system is prepared only for leveraged markets and only for Forex.
System parameters:
Timeframe = 1H (1 Hours)
Leverage = 100X
Position Size = %1 (0.01) Each Trade
System features :
- It targets the Risk /Reward Ratio of 1/3 and above. (Risk/Reward Ratio >= 3 )
- If a Take Profit Point has come in a successful trade but the parameter conformity has not deteriorated, system continues the trade.
- In this way, you can catch strong short trends several times a year.
But it is strict as stop-loss and avoids large declines,whipsaws whenever possible.
- The system tries to avoid unnecessary processes as much as possible.
This means less commission and less sideways market.
- Since it takes advantage of the reverse market, it is suitable not only for long and short but only for short position, ie "bears".
But this neutralizes unnecessary processes.
- Stop-Loss points and Take Profit (TP) points are shown in red and green.
-However, if there is a small amount of follow-up available at the computer, it is recommended to put stop-loss only.
Because the system revises both stop-loss and take profit points according to the conditions formed.
Doing this in the right major long trend here allows you to be in trades.
-The system takes into account the risk and only opens transactions where the value corresponding to 100 leverage ratio is greater than the risk.
This provides as much protection from risk as possible.
-Alerts added.
***Since it is located in the most risky market, the forex market, a balanced algorithm has been optimized, considering that it has a very unstable structure similar to dilithrium crystals (same logic as investment bank trader test).
So if this algorithm was a person, it would be an incredibly disciplined but equally skeptical person =)
Also, like other systems, this system also uses ANN (Artificial Neural Networks).
About Backtest :
Since this system is for leveraged market, backtest results are not healthy.
But since it targets the 1/3 Risk Reward Rate (3.00),
we must look Ratio Avg Win/Loss and it must be over 0.5 because :
This ratio means: When we reach 33% of our correct trades in all our trades, we are at breakeven.
This is 100 - 33 = 66
33/66 = 0.5
So whenever this rate is over 0.5, we make a profit.
*** The fact that this ratio must over 0.75 (worst scenario) in terms of securing ourselves because there will be extra comission fees for worst scenario.
Above this ratios ,we can do successful snowball trades.
And we achieve success cumulatively.
Important Note : This system is prepared only for these parameters.
NOTE :
The system has been prepared as a strategy to present success in a transparent manner.
Please check "Ratio Avg . Win / Avg Loss" rates in backtests.
Important Note 2 -
Although the system revises the stop and take profit points in the required parameters, the most accurate place is when the signal comes.
It should be entered when the signal comes as much as possible and if this did not happen,
trade must be opened in the nearest bars after the signal comes.
Best regards.
EDIT : Comission added. (%0.1)