MA+ADX+DMICOINBASE:BTCUSD
BINANCE:BTCUSDT
Use long and short moving average to look for a potential price in/out. (default as 14 and 7, bases on the history experience)
ADX and DMI to prevent the small volatility and tangling MA.
Test it in 4HR, "BINANCE:BTCUSDT"
From 12/1/2017- 11/1/2020 (Mixed Bull/Bear market)
Overall Profit: 560.89%
From 1/1/2018 - 1/1/2019 (Bear market)
Overall Profit: -2.19%
From 4/1/2020 - 11/1/2020 (Bull Market)
Overall Profit: 274.74%
Any suggestion is welcome to discuss.
簡單移動平均線(SMA)

Array SMACalcuating SMA on an Array
In this script i show you how to calculate SMA on an array.
Several values are plotted just for illustration.
Steps to follow:
- make sure you have an array with values (source array)
- create a blank array (pref. with the same size)
- call the function array_sma
This function fills the empty array with the SMA values of the source array.

Easy Loot Golden CrossGolden/Death Cross Moving Average Indicator
30, 100 & 200 period Simple Moving Average (SMA).
30 = Yellow
100 = Green
200 = Black
Black crosses mark the 'golden crosses' as well as the 'death crosses'. These black crosses appear when the 30 crosses the 100 & when the 100 crosses the 200. These black crosses don't tell you when to buy/sell, but simply indicate interest in the market.
This code is open-source so feel free to add this indicator to your chart and play around with the different moving average timeframes & color schemes.
Golden Cross
The golden cross occurs when a short-term moving average crosses over a major long-term moving average to the upside and is interpreted by analysts and traders as signaling a definitive upward turn in a market. Basically, the short-term average trends up faster than the long-term average, until they cross.
There are three stages to a golden cross:
A downtrend that eventually ends as selling is depleted
A second stage where the shorter moving average crosses up through the longer moving average
Finally, the continuing uptrend, hopefully leading to higher prices
Death Cross
Conversely, a similar downside moving average crossover constitutes the death cross and is understood to signal a decisive downturn in a market. The death cross occurs when the short term average trends down and crosses the long-term average, basically going in the opposite direction of the golden cross.
The death cross preceded the economic downturns in 1929, 1938, 1974, and 2008.

Public & Pro ActionBased on Larry Williams Pro-Go logic for public and pro actions. This indicator works on all timeframes.
The public action is previous close to today's open.
The pro action is today's close to today's open.
The series is smoothened with a simple moving average.
It works best after the candle is formed.

Bollinger Band+ Multi EMA, SMAHello Everyone.
I make Bollinger band , 3 ema and 3 sma combined.
I think this indicator can use all timeframe.
--------------------------------------------------------------
Indicator will show you
1. Trend follow
2. Pullback catch
2. Market bounce.
1. Trend Follow
- Trend Follow for I used 3 terms. They are short, Mid and Long Trend.
2. Pullback Catch
- EMA for Save, take care, alert Zones.
- Mid Term Trend can be catch also.
3. Market Bounce
- Bollinger Band will show you market re-bounce point.
Final Notes
Indicator will show Trend, Pullback, Market bounce and some support and resistant level.

Fib Cross Moving AveragesThe white line is the main 200-candle MA. The fibonacci ratio MAs are relative to that 200-day MA. Some lines change color based on the trend shown by this indicator.
So 61.8% for example, the orange/red line golden ratio MA is a 124 candle MA (~68% of 200). There is also a weighted 124 candle MA that works along-side the 100 candle MA.

Pisani BandsThis indicator is based on Historical Volatility.
It's plot the simple moving average with a upper and a lower band.
The bands are calculated like this:
UpperBand = 20 Simple moving average + 20% * Historical volatility
LowerBand = 20 Simple moving average - 20% * Historical volatility
But, you can change the paramters. I use the 200SMA with 100% of Historical Volatility either.
How to use:
If the price are negociating out of the bands, it's dangerous to trade this stock.
Hope you like it.

Improved On balance volume with BB channel and double MAThis is an improved version of the on balance volume indicator.
I made it inside a bollinger band channel, so we can define better the zones. At the same time I applied 2 moving averages on OBV, to get a better idea of the trend and at same time that change direction of the trend.
Green - > uptrend - > we look for buy positions
Red - > downtrend -> we look for sell positions.
At the same time we have to be aware of crosses on bollinger bands, which can indicate a change in the trend .

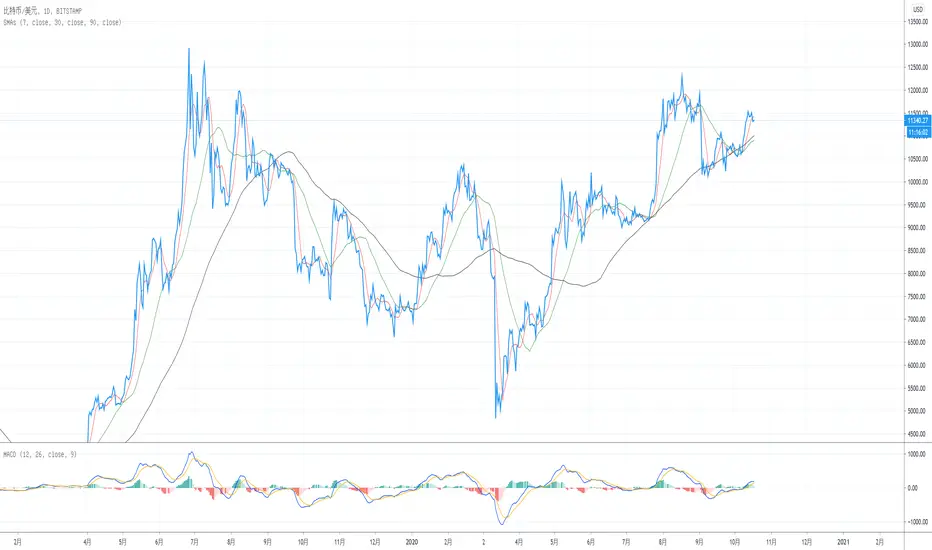
Displaced Moving Average Channel (DMA)What is This?
The Displaced Moving Average Channel (DMA) indicator is a combination of two moving averages calculated on the high and low of a set time period back which are displaced forward or backward with the center highlighted as a central channel.
What Information Can I Get Out of It?
This indicator can be used as a support or resistance as some moving averages are typically used as well as a tiny measure of recent volatility by looking at the spread between the top and bottom moving averages.
Where Did This Idea Come From?
I did not come up with the concept of this indicator since I was inspired to use this as a setup/trigger indicator in a potential trading strategy as seen in this whitepaper .

Golden & Death CrossThis indicator allows you to see Golden Cross and Death Cross.
Each Sma line can be hidden.
It is for educational purposes only.
Enjoy it.
Best Regards,
Bilgin , Kaptanin Seyir Defteri

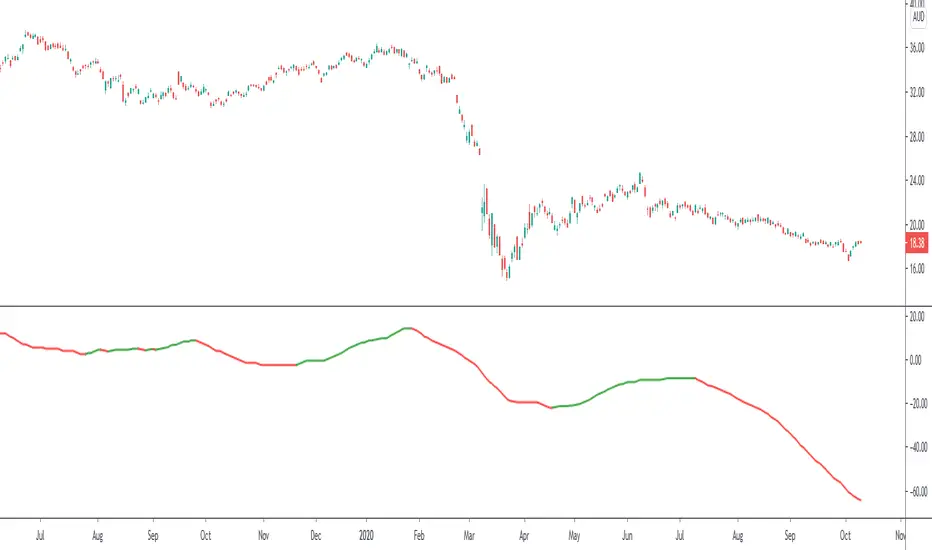
Ratio Between Two SymbolsThis scripts displays the ratio of any two symbols. The ratio is shown on a second chart.
A multiplier may be added to the ratio, and moving average is calculated.

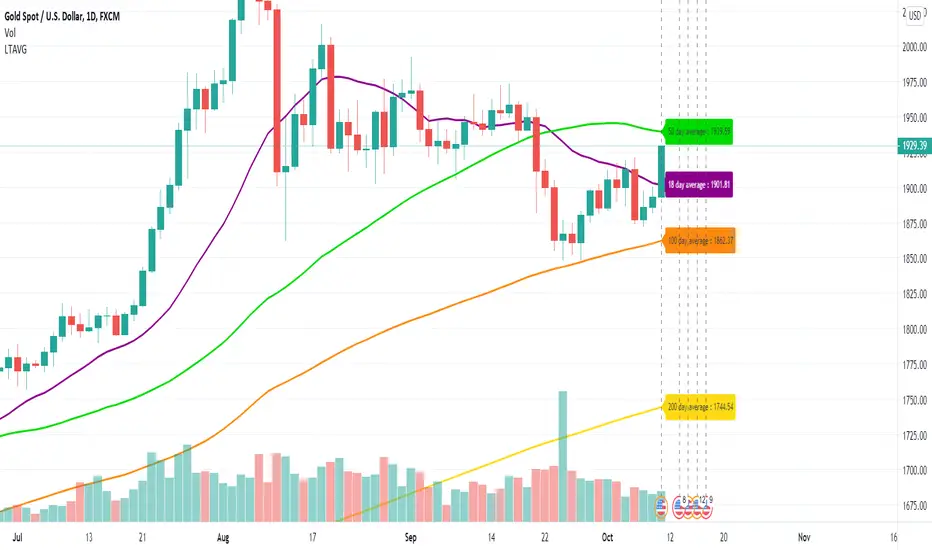
Long Term Moving AverageThis scripts plots the long term moving average calculated daily for 4 sets.
The default averages are:
18 day
50 day
100 day
200 day
The settings can be used to flexibly change this and to hide / show labels
Aligned Moving Average IndexMoving averages are considered as aligned when either all faster moving averages are placed above their next slower moving averages or all faster moving averages are placed below their next slower moving averages. In this script, we are considering moving averages of 5, 10, 20, 30, 50, 100 and 200. User can select different moving average types from input : sma, ema, hma, rma, vwma, wma.
Moving average is considered as positively aligned when close > ma5 > ma10 > ma20 > ma30 > ma50 > ma100 > ma200
Moving average is considered as negatively aligned when close < ma5 < ma10 < ma20 < ma30 < ma50 < ma100 < ma200
Whenever there is positively aligned moving average, alignment value is considered as +1 and whenever there is negatively aligned moving average, alignment value is considered as -1. Aligned moving average index is sum of n periods of alignment value.
We can optionally apply another moving average on this index to see the overall direction.
All LinesThe objective of this script is to try to display as many overlay indicators as possible simultaneously while keeping the clutter to a minimum.
--Included are Indicators are--
sma 20 50 100 200
ema 20 50 100 200
High/Low
Bollinger bands upper/lower
Pivot points PP R1 R2 R3 S1 S2 S3
-- For Time periods --
Hour,Day,Week
--- How To Use --
Switch it on when looking for likely support or resistance areas to plot your trade.
The more lines that overlay each other indicate even greater support/resistance at that point
meaning if the price is going down it may bounce up at this area or if the price is going up it may bounce down.
Also the more visible the line the more strength it has to effect the price. This value can be edited in settings by adjusting the power value for each indicator as it can often depend on what you are trading.
--Tips--
If you want to know what the line represents hover your cursor over the dot at the end of the line and a tool tip will appear.
If there are to many circles zoom in the price more to separate them and try to hover again.

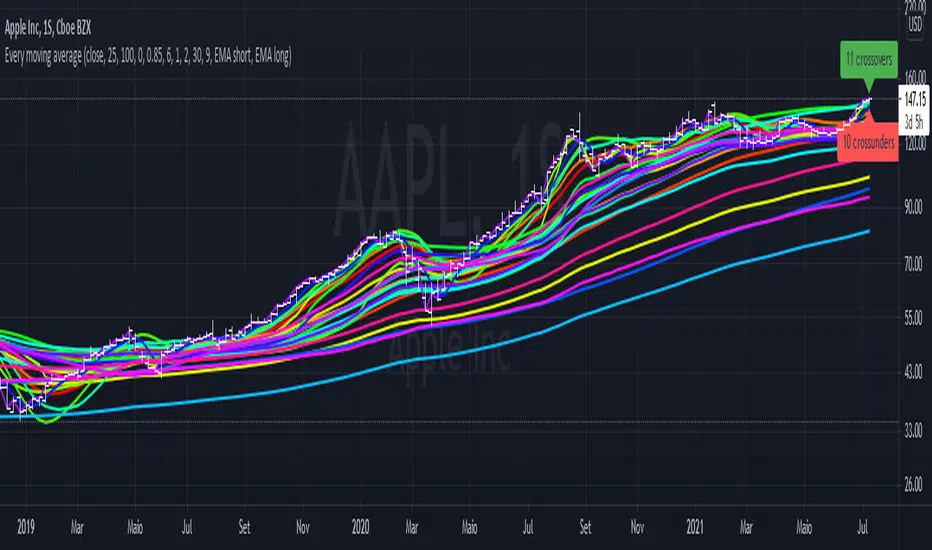
Every single moving average (ALMA, EMA, HMA, KAMA, RMA, SMA...)So you may be looking at the graph and thinking "this is a mess", and I agree.
The purpose of this script is to plot in the same graph every single type of moving average that I could think of, so you can find the ones that are better for your timeframe and for your asset. Once you add it, disable those types that doesn't seem to serve your purpose, until you can select one you like.
The average types are: ALMA, EMA, HMA, KAMA, RMA, SMA, SWMA, VIDYA, VWAP, VWMA, and WMA. Each one is ploted two times (except SWMA and VWAP), one with a short period, and another with a long, both of which you can configure.
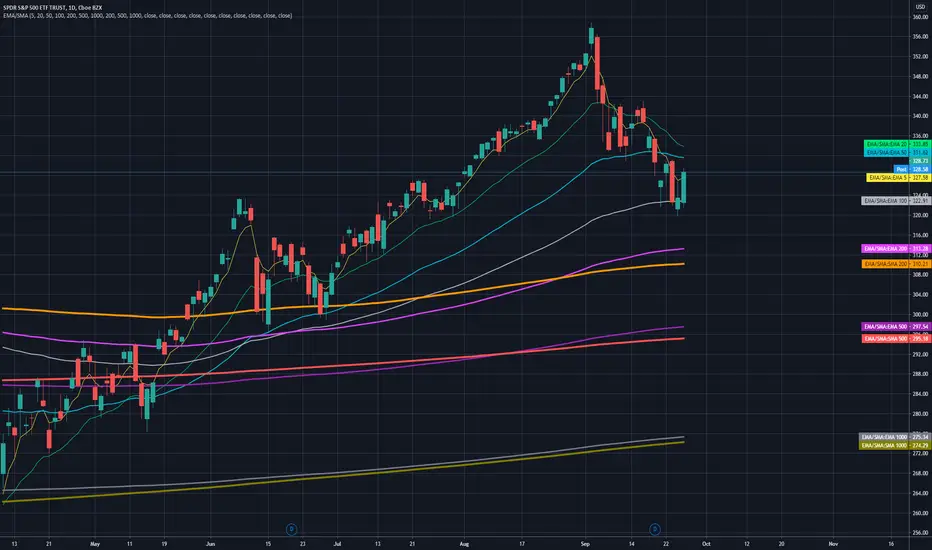
7 EMA 3 SMA with nameplatesScript provides 7 EMA (5 20 50 100 200 500 1000), 3 SMA (200 500 1000) with built-in nameplates for easier navigation. Different colors and widths from the start just to make your initial tuning a bit easier.
Based on Bubsan and Silkheat multicombo, heavily modified, but still huge kudos to guys for the base code.
Modifications: lengths adjusted, on-chart nameplates added, 2 EMA's added, SMA's reduced, static SMA's deleted.
DCA LinesThis is an indicator which shows your position's average price of you started dollar cost averaging 30, 60, 90, 120, 150 and 180 bars ago.
Dollar Cost Averaging (DCA) means buying into a position by investing a fixed sum every bar (for example every day or every week). This way, when the coin of stock goes down, you buy more of the stock.
Some exchanges such as Coinbase, Revolut or River Financial offer this option of entering a position using automatic DCA. It's a kind of "set it and forget it" investment (but you still have to be careful to sell your position into profit).
There are people who DCA into an ETF every week for many years, and so build a position at a very advantageous average price.

CC - Array-meta Consolidated Interval Display (ACID)This script extends my other two Array examples (which I've also provided to you open source):
The Ticker-centric 5m,15m,45m,1h,4h,1d resolution labels using arrays:
And the more Macro VIX,GLD,TLT,QQQ,SPY,IWM 1d resolution labels using arrays:
This script aims to show how to use min/max/avg with Arrays easily. My next example after this will be exploring the usage of variance versus covariance ratios over different periodic interval resolutions. Currently, this is using the following intervals: 5m,15m,45m,1h,4h,1d. It takes these intervals, calculates the values at those resolutions and puts the absolute min and max from the 5 minute to the 1 day resolutions.
It's more of an example of the power that arrays can hold, as all this truly is right now is a min/max bound calculator. The real gem lies in the avg calculators for multiple resoltuions tied into a single label with readable data. Check out the code and let me know what you think. If you need more examples, the other two scripts I mentioned before are also open source.
Using this on intervals of less than 1D sometimes times out, the way I wrote it is memory intensive, may not work for non-pro users.
Thanks!
NONE OF THIS IS FOREWARD LOOKING STATEMENTS, THIS IS NOT A PREDECTIVE ANALYSIS TOOL. THIS IS A RESEARCH ATTEMPT AT A NOVEL INDICATOR. I am not responsible for outcomes using it.
Please use and give criticisms freely. I am experimenting with combining resolutions and comparing covariance values at different levels right now, so let me know your thoughts! The last indicator will likely not be open source, but may be depending on how complex I get.

Multi timeframes 4 SMA'sThis script gives you the possibility to fastly plot 4 SMA's (défault 20, 50, 100 and 200 periods) in the actual TimeFrame and for 4 others timeframes.
In fact, when you're in lower timeframes, you may want to see where highers TF SMA's are without always changing the TF of the chart. This script was created for that.
It's really simply to use, by default only 4 SMA's of the present timeframe are ploted. If you want to check the higher TF SMA's, just tick the lines in the script parameters.
No strategy here, only trying to faster the use of indicators by changing parameters on multiple MA in the same time.
Don't hesitate to leave a comment if you have ideas to improve the script.
Enjoy !

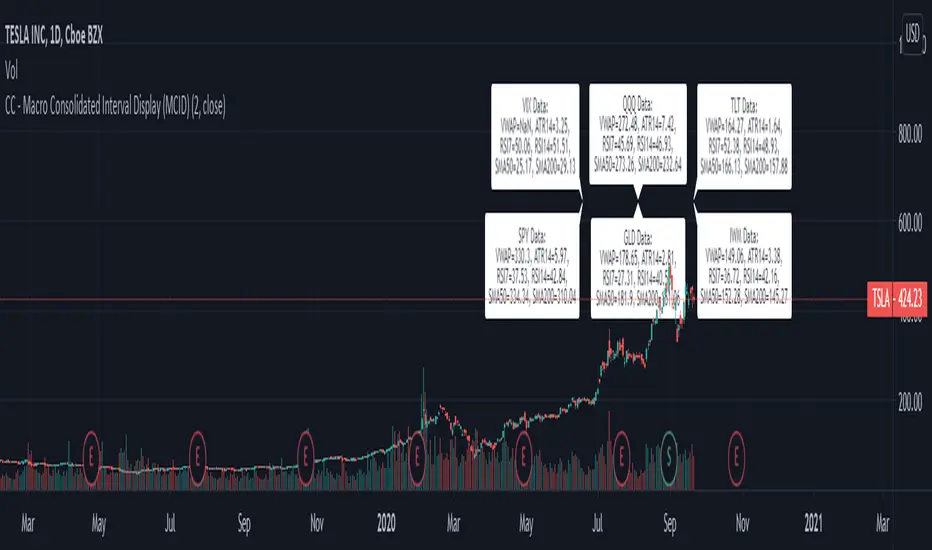
CC - Macro Consolidated Interval Display (MCID)Ever wish you didn't have to rapidly flip between 6 different tickers to get the full picture?
Yeah, me too. Do you also wish that you kind of understood how the shift / unshift function works for arrays?
Yeah, I did too. Both of those birds are taken care of with one stone!
The Macro Consolidated Interval Display uses the new Array structure and security to display data for VIX, GLD, TLT, QQQ, SPY and IWM (at a 1D interval) SIMUTANEOUSLY! Regardless of which ticker you're looking at you can get the full picture of macro futures data without flipping around to get it.
This is my first script trying to use arrays. It basically shows the following a 1d interval:
ATR14, RSI7, RSI14, SMA50, SMA200 and VWAP for VIX.
ATR14, RSI7, RSI14, SMA50, SMA200 and VWAP for GLD.
ATR14, RSI7, RSI14, SMA50, SMA200 and VWAP for TLT.
ATR14, RSI7, RSI14, SMA50, SMA200 and VWAP for QQQ.
ATR14, RSI7, RSI14, SMA50, SMA200 and VWAP for SPY.
ATR14, RSI7, RSI14, SMA50, SMA200 and VWAP for IWM
To make it more or less busy, I've allowed you to toggle off any of the levels you wish. I've also chosen to leave this as open source, as it's nothing too experimental, and I hope that it can gain some traction as an Array example that the public can use! If you don't like the different values that are shown, use this source code example as a spring-board to put values that you do care about onto the labels.
If this code has helped you at all please drop me a like or some constructive criticism if you do not think it's worth a like.
Good luck and happy trading friends. This should be compatible with my CID as well:
If this gets traction, I will post something similar for a dynamic combination of tickers and intervals that you can set yourself.
JBravo SwingThis follows Johnny Bravo Dominate Stocks strategy. When full price bar closes above SMA 9, this indicates a buy. When price bar closes below EMA20, this indicates a sell. If the MAs are all sloping up and aligned in order 9,20,180, then this indicates a Strong Buy. If the MAs are all sloping down and aligned in order 180,20,9, then this indicates a Strong Sell.

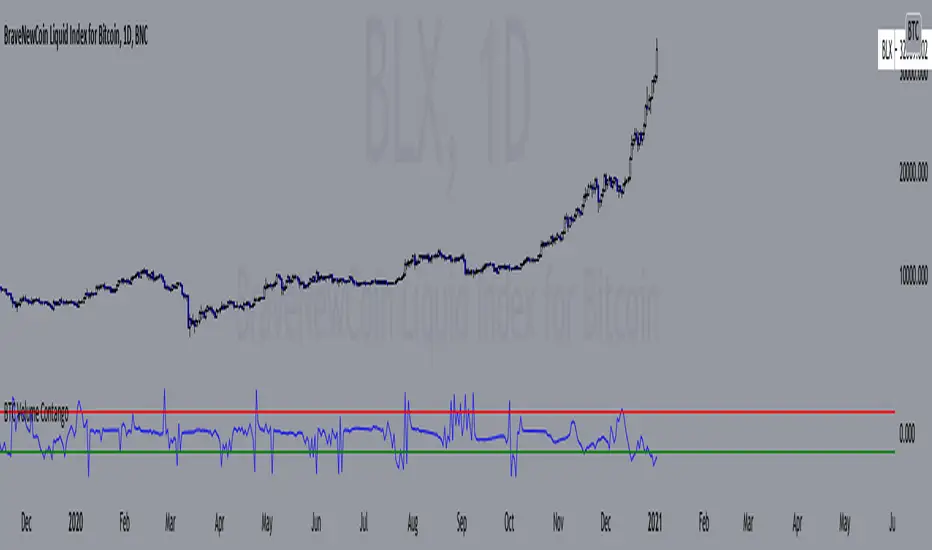
BTC Volume Contango IndexBased on my previous script "BTC Contango Index" which was inspired by a Twitter post by Byzantine General:
This is a script that shows the contango between spot and futures volumes of Bitcoin to identify overbought and oversold conditions. When a market is in contango, the volume of a futures contract is higher than the spot volume. Conversely, when a market is in backwardation, the volume of the futures contract is lower than the spot volume.
The aggregate daily volumes on top exchanges are taken to obtain Total Spot Volume and Total Futures Volume. The script then plots (Total Futures Volume/Total Spot Volume) - 1 to illustrate the percent difference (contango) between spot and futures volumes of Bitcoin. This data by itself is useful, but because aggregate futures volumes are so much larger than spot volumes, no negative values are produced. To correct for this, the Z-score of contango is taken. The Z-score (z) of a data item x measures the distance (in standard deviations StdDev) and direction of the item from its mean (U):
Z-score = (x - U) / StDev
A value of zero indicates that the data item x is equal to the mean U, while positive or negative values show that the data item is above or below the mean (x Values of +2 and -2 show that the data item is two standard deviations above or below the chosen mean, respectively, and over 95.5% of all data items are contained within these two horizontal references). We substitute x with volume contango C, the mean U with simple moving average ( SMA ) of n periods (50), and StdDev with the standard deviation of closing contango for n periods (50), so the above formula becomes: Z-score = (C - SMA (50)) / StdDev(C,50).
When in contango, Bitcoin may be overbought.
When in backwardation, Bitcoin may be oversold.
The current bar calculation will always look incorrect due to TV plotting the Z-score before the bar closes.