Power Of 3 ICT 01 [TradingFinder] AMD ICT & SMC Accumulations🔵 Introduction
The ICT Power of 3 (PO3) strategy, developed by Michael J. Huddleston, known as the Inner Circle Trader, is a structured approach to analyzing daily market activity. This strategy divides the trading day into three distinct phases: Accumulation, Manipulation, and Distribution.
Each phase represents a unique market behavior influenced by institutional traders, offering a clear framework for retail traders to align their strategies with market movements.
Accumulation (19:00 - 01:00 EST) takes place during low-volatility hours, as institutional traders accumulate orders. Manipulation (01:00 - 07:00 EST) involves false breakouts and liquidity traps designed to mislead retail traders. Finally, Distribution (07:00 - 13:00 EST) represents the active phase where significant market movements occur as institutions distribute their positions in line with the broader trend.
This indicator is built upon the Power of 3 principles to provide traders with a practical and visual tool for identifying these key phases. By using clear color coding and precise time zones, the indicator highlights critical price levels, such as highs and lows, helping traders to better understand market dynamics and make more informed trading decisions.
Incorporating the ICT AMD setup into daily analysis enables traders to anticipate market behavior, spot high-probability trade setups, and gain deeper insights into institutional trading strategies. With its focus on time-based price action, this indicator simplifies complex market structures, offering an effective tool for traders of all levels.
🔵 How to Use
The ICT Power of 3 (PO3) indicator is designed to help traders analyze daily market movements by visually identifying the three key phases: Accumulation, Manipulation, and Distribution.
Here's how traders can effectively use the indicator :
🟣 Accumulation Phase (19:00 - 01:00 EST)
Purpose : Identify the range-bound activity where institutional players accumulate orders.
Trading Insight : Avoid placing trades during this phase, as price movements are typically limited. Instead, use this time to prepare for the potential direction of the market in the next phases.
🟣 Manipulation Phase (01:00 - 07:00 EST)
Purpose : Spot false breakouts and liquidity traps that mislead retail traders.
Trading Insight : Observe the market for price spikes beyond key support or resistance levels. These moves often reverse quickly, offering high-probability entry points in the opposite direction of the initial breakout.
🟣 Distribution Phase (07:00 - 13:00 EST)
Purpose : Detect the main price movement of the day, driven by institutional distribution.
Trading Insight : Enter trades in the direction of the trend established during this phase. Look for confirmations such as breakouts or strong directional moves that align with broader market sentiment
🔵 Settings
Show or Hide Phases :mDecide whether to display Accumulation, Manipulation, or Distribution.
Adjust the session times for each phase :
Accumulation: 1900-0100 EST
Manipulation: 0100-0700 EST
Distribution: 0700-1300 EST
Modify Visualization : Customize how the indicator looks by changing settings like colors and transparency.
🔵 Conclusion
The ICT Power of 3 (PO3) indicator is a powerful tool for traders seeking to understand and leverage market structure based on time and price dynamics. By visually highlighting the three key phases—Accumulation, Manipulation, and Distribution—this indicator simplifies the complex movements of institutional trading strategies.
With its customizable settings and clear representation of market behavior, the indicator is suitable for traders at all levels, helping them anticipate market trends and make more informed decisions.
Whether you're identifying entry points in the Accumulation phase, navigating false moves during Manipulation, or capitalizing on trends in the Distribution phase, this tool provides valuable insights to enhance your trading performance.
By integrating this indicator into your analysis, you can better align your strategies with institutional movements and improve your overall trading outcomes.
Smctrading

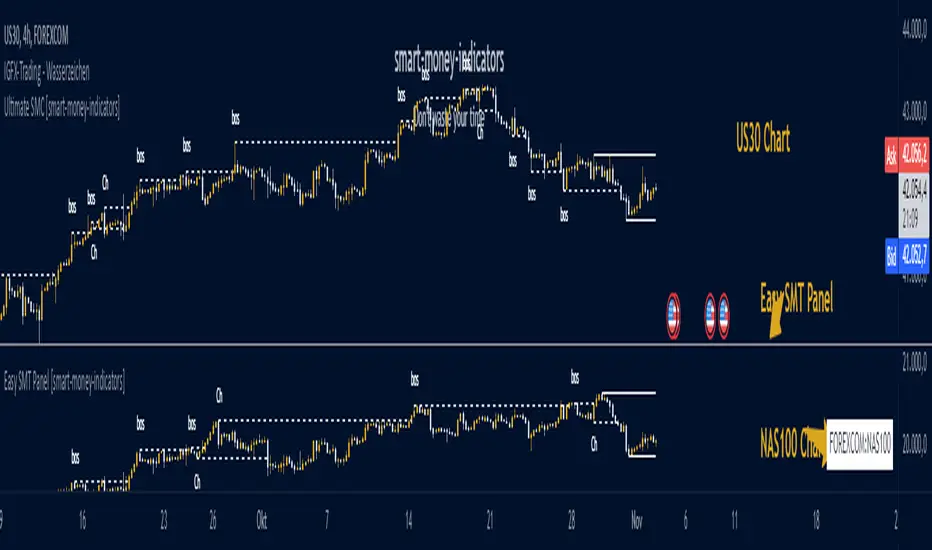
Easy SMT Panel [smart-money-indicators]This indicator is the ultimate tool for identifying divergences between two instruments.
This indicator does not provide entry or exit signals.
This indicator is a tool to mark key price areas.
This indicator is a tool to mark key time areas.
This indicator is particularly distinguished by its high customizability of tools,
setting it apart from the indicators currently available on the TradingView platform.
No more annoying switching between instruments across two layout windows! Depending on the instrument in the main window, specify which instrument should be displayed in the panel!
It's up to you to decide the criteria for determining divergences, as this indicator highlights the following key areas using lines and boxes:
Structure Breaks:
- Bearish Change of Character
- Bearish Break of Structure
- Bullish Change of Character
- Bullish Break of Structure
Premium / Discount Area:
- Premium / Discount area of the current range, since the last Change of Character or Break of Structure
Liquidity Areas:
- Asia Session (during or after the session)
- London Session (during or after the session)
- New York Session (during or after the session)
- London Close Session (during or after the session)
- Session Quarters
- Central Banks Dealer Range
How can I use or interpret these areas?
Structure Breaks:
- Has Instrument 1 experienced a structure break at a high/low, but Instrument 2 has not? This could indicate a divergence!
Liquidity Areas:
- Has Instrument 1 already broken a session high/low, but Instrument 2 has not? This could indicate a divergence!
Ultimate SMC [smart-money-indicators] This indicator is a tool to support the "SMC" strategy.
This indicator does not provide entry or exit signals.
This indicator is a tool to mark key price areas.
This indicator is a tool to mark key time areas.
This indicator is particularly distinguished by its high customizability of tools,
setting it apart from the indicators currently available on the TradingView platform.
Moreover, unlike other "SMC indicators," this one does NOT use pivot points to identify Change of Character (ChoCh) or Break of Structure (BoS).
The following key areas are marked with lines or boxes:
Structure Breaks:
- Bearish Change of Character
- Bearish Break of Structure
- Bullish Change of Character
- Bullish Break of Structure
Premium/Discount Zone:
- Premium/Discount area of the current range, since the last ChoCh or BoS
Potential Buy/Sell Zones (including historical or mitigated):
- Bullish orderblocks
- Bearish orderblocks
Momentum Indicators:
- Bullish Fair Value Gaps
- Bearish Fair Value Gaps
How can I use or interpret these areas?
Structure Breaks:
- If the indicator shows bullish structure breaks in the form of ChoCh or BoS, it indicates a bullish trend.
- If the indicator shows bearish structure breaks in the form of ChoCh or BoS, it indicates a bearish trend.
Premium/Discount Zone:
- If the price is in the premium zone, it indicates that the current price is "expensive," and you should look for sell signals.
- If the price is in the discount zone, it indicates that the current price is "cheap," and you should look for buy signals.
Order Blocks:
- Bearish order blocks indicate strong selling pressure in that area, and you can look for sell signals.
- Bullish order blocks indicate strong buying pressure in that area, and you can look for buy signals.
Momentum Indicators:
- Bullish Fair Value Gaps that form after the creation of an order block may indicate strong buying pressure and confirm a bullish trend.
- Bearish Fair Value Gaps that form after the creation of an order block may indicate strong selling pressure and confirm a bearish trend.

RunRox - Advanced SMC⭐️ Introducing Our Advanced SMC Indicator: Elevate Your Smart Money Concept Trading
We are excited to present our innovative indicator, specifically designed for the Smart Money Concept (SMC). Our approach goes beyond the traditional SMC strategy by offering significant enhancements that can help you achieve stronger trading performance.
We employ a more sophisticated SMC structure, incorporating improved IDM (Inducement) logic, both internal and external structures, and four types of order blocks. This allows for deeper insights into market trends and a clearer understanding of how major market participants may be manipulating price action.
🟠 Indicator Features:
Structure
HTF Structure – Choose any timeframe and display its structure on your current chart.
CHoCH | BOS | IDM – Display any components from this structure.
Market Minor Structure – Swing and Minor structure.
BOS/CHoCH Breaking by (Body | Wick) – Choose the principle for building the structure, either by the candle body or by their wicks.
BOS/CHoCH Move if Swept – When liquidity is taken, decide whether to move the structure line higher or consider it a structural break.
Move CHoCH/BOS – Relocate key points on the chart if the structure becomes too large.
FVG Concept
HTF FVG – Choose any timeframe from which you want to display FVG on your current chart
Three Types of FVG – Classic FVG, Double FVG, Implied Imbalance
Reaction to FVG – Show the market’s reaction to FVG on the chart
Mitigation Method – Select the fill method that suits your approach (Touch/Midline/Complete)
Remove Filled FVG – Remove FVGs from the chart once they have been filled
Combine FVG – Merge several consecutive FVGs into one
Length FVG – Adjust the number of candles that define the FVG
OrderBlock Concept
HTF OrderBlock – Choose any timeframe from which you want to display orderblocks on your current chart
Swing and Minor Orderblocks – Display only the orderblocks you need, whether from the Swing or Minor structure
Four Types of Order Blocks – Advanced OB, Classic OB, BTS/STB zones, Extremum Candle
Block Based on – Decide whether to base the orderblock on candle highs/lows or candle open/close
Mitigation Method – Define when an orderblock is considered filled (Touch/Midline/Complete)
Remove Blocks Older – Remove older orderblocks from the chart
Hide Overlap – Disable overlapping orderblocks when they appear in the same area
Eat Young Blocks – Reduce the size of an orderblock until it fully forms
Hide Distant Blocks – Remove orderblocks that are too far from the current price
Previous Highs & Lows
Four Level Types – Day, Week, Month, Quarter
Style Customization – Choose line color, line style, and transparency
Fibonacci Retracements
10 Template Options – Ten different bases on which you can build your Fibonacci grid
Up to 7 Levels – Add up to seven Fibonacci levels for your convenience
Fibo Inversion – Option to invert the Fibonacci grid
Style Customization – Choose line colors, line styles, and transparency
Additional Functions
Premium & Discount Zones – A popular concept we’ve incorporated to help identify potential trading areas within premium or discount prices
Equal Highs & Lows – High-liquidity levels where market makers may seek liquidity
Color Candles – Automatically colors candles based on the current trend
Market Structure ZigZag – Offers a clear visual of the zigzag pattern on which the structure is built
Key Point Labels – Displays important swing high/low points directly on the chart
General Styling – Customize any chart element, including size, style, color, and transparency
Alert Customization – Over 16 types of alerts, easily configured in a few clicks. Receive only the notifications you need. Custom alerts are also available for developers.
Next, we will provide a detailed overview of all the indicator’s features, accompanied by chart examples.
📈 Structure
What Is IDM?
IDM, or the Institutional Distribution Model, is an advanced concept within SMC that focuses on how institutional players distribute their positions in the market. By analyzing IDM, traders can better anticipate price movements and potential turning points, thereby gaining a meaningful edge in their trading.
In our structure concept, IDM can form under specific conditions. The market does not always provide a high-liquidity point to work with, so we’ve adopted a flexible approach. We generate IDM when a certain type of liquidity appears during the impulse and BOS break, allowing for a potential future liquidity sweep.
Below, I will provide an example that illustrates when IDM forms as a liquidity magnet within the structure - and when it does not.
As shown in the example above, we focus on the initial impulse after the BOS. If liquidity forms during this impulse - liquidity that needs to be taken out during the structural move - we mark an IDM level as a price magnet. However, if this liquidity does not appear, we do not create an IDM. In that case, the same point might serve as an FVG or play a different role, depending on your trading approach.
This concept makes the structure more flexible and better able to respond immediately to market movements and key structural points.
Above is an example on the chart illustrating what the structure looks like both with and without IDM. As you can see, when the structural move includes pullbacks and consolidation, there is an opportunity to form an IDM as a price magnet. However, if the impulses are strong and lack pullbacks, FVG becomes the only magnet in that move. Depending on the chart, our indicator adapts to the current market conditions and highlights potential liquidity collection points.
📊 Swing and Minor Structure
In the new version of the indicator, the minor structure and the swing structure differ from each other.
Swing structure - In this structure, as mentioned earlier, the IDM concept remains a price magnet and is formed at certain points on the chart if the conditions allow. If these points do not appear, IDM might not form at all.
Minor structure - Here, we have completely removed IDM and only kept BOS and CHoCH for structure formation. We found that for a minor structure, this approach allows faster reactions to trend changes, depending on market movements.
By making these adjustments, we have resolved the main issue of the advanced structure, which was the large distance between BOS and CHoCH that sometimes resulted in a month-long consolidation between these levels. In this version, those problems no longer occur.
If, for some reason, your settings result in a larger swing structure, you can still work with the minor structure using the same POI as in the swing structure. OrderBlock and FVG remain the primary drivers of order flow.
Shown above is a screenshot of the main structure settings you can adjust. These settings are highly flexible and can be tailored to fit a wide range of trading preferences.
⚖️ FVG Concept
A new feature of our indicator is the FVG concept. We automatically detect three types of FVG at the moment, which will be explained below.
FVG - the standard Fair Value Gap
Double FVG - a double FVG, also referred to as BPR (Balanced Price Range)
Implied Imbalance - a type of imbalance that arises from buyer or seller demand
Below, we will look at examples of the FVG types we currently identify.
All price inefficiencies work in real time, immediately appearing on the chart and allowing traders to quickly respond to FVG reactions.
We have also enhanced this concept by displaying FVG reactions on the chart. If an FVG triggers a reaction and the price responds to that range, we highlight it on the chart, so you can recognize the reaction and make timely trading decisions. A screenshot below shows how this looks in practice.
Below is a screenshot illustrating the main settings of this concept, along with detailed descriptions.
📦 OrderBlock Concept
OrderBlocks provide an effective way to identify areas of interest and make informed decisions. We have dedicated significant effort to refining this section’s functionality and have achieved strong results in doing so.
Order Block Types
Advanced OrderBlock – A specialized type of order block generated by our internal algorithm. This can help traders aim for tighter entries and potentially more favorable risk-reward ratios within a narrow price range.
OrderBlock – The classic type, formed at the highs or lows of a structure when a BOS or CHoCH occurs. It can still be an effective entry method but typically spans a wider price range.
Extremum Candle – Based on liquidity grabs. The candle creating this order block must collect liquidity before making an impulsive move that breaks the BOS or CHoCH.
BTS / STB (Buy To Sell / Sell To Buy) – This concept may appear when market makers manipulate price to buy or sell an asset. It often covers a larger price range because it relies on a brief impulsive move to form.
Each type of order block has its own strengths and weaknesses. We provide traders with the flexibility to choose which types suit their trading style and preferences.
Above is an example of how you can apply OrderFlow alongside our structure and orderblocks, which can produce solid results when combined with the Smart Money concept.
In this demonstration, we have highlighted the Advanced Orderblock as an illustration.
Above is a screenshot of all the settings related to this section. They can be customized to suit your specific needs, ensuring you only see what is genuinely relevant on your chart.
📏 Previous Highs and Lows
You can select four levels to display on the chart as some of the most liquid zones:
Daily Highs and Lows
Weekly Highs and Lows
Monthly Highs and Lows
Quarterly Highs and Lows
This feature helps you identify important levels on lower timeframes and focus on these zones for potential trading opportunities. Below is an example of how it appears on the chart.
Below, you can see the settings available in this section.
📐 Fibonacci Levels
Likewise, a new section in our indicator is Fibonacci Levels, a well-known tool recognized as a reliable source of important levels on the chart. We have added this functionality with the option to choose how you want to generate these levels and which specific levels you want to display.
You can plot Fibonacci levels based on the Swing structure, Minor structure, previous or current day, month, and more. In total, there are 10 different options for constructing the Fibonacci grid.
Above, you can see an example of how it appears on the chart, and below you will find the settings available in this section.
🈹 Premium and Discount
Another useful feature for all traders is the Premium and Discount zones based on structure. This makes it easy to identify areas of interest—whether in a discount or premium zone, or in an equilibrium area.
Below, you can also see the settings available in this section.
✅ Additional Function
We have also separated a few functions into their own section:
Color Candles – Colors the candles according to the current trend.
Market Structure ZigZag – Visually highlights the zigzag used to form the structure.
Key Point Labels – Displays the points on the chart from which the structure is built.
Equal Highs & Lows – Identifies equal highs and lows as areas of potential liquidity for larger market players, as price often aims to sweep these zones.
Below are a few screenshots showing how these features appear on the chart.
Color Candles
Market Structure ZigZag and Key Point Labels
Equal Highs & Lows
Below, you can see a screenshot displaying all the settings available in this section.
🎨 General Styling
We have devoted considerable effort to providing flexible customization for each element on the chart, so you can design the exact look you want. That’s why we created an additional section where you can adjust any element’s size, style, and more.
Combined with extensive color and transparency options, this feature provides a flexible appearance for the indicator on any chart.
Below, you can see the settings available in this section
🔔 Alert Customization
You can configure over 16 types of reactions to various events on the chart. Additionally, you can set up alerts to trigger at specific fill levels and explore numerous other alert options, as shown in the screenshot below.
🟠 Usage Examples
We have also prepared several examples of how to use the indicator. These are standard entry models taken from the classic Smart Money concept.
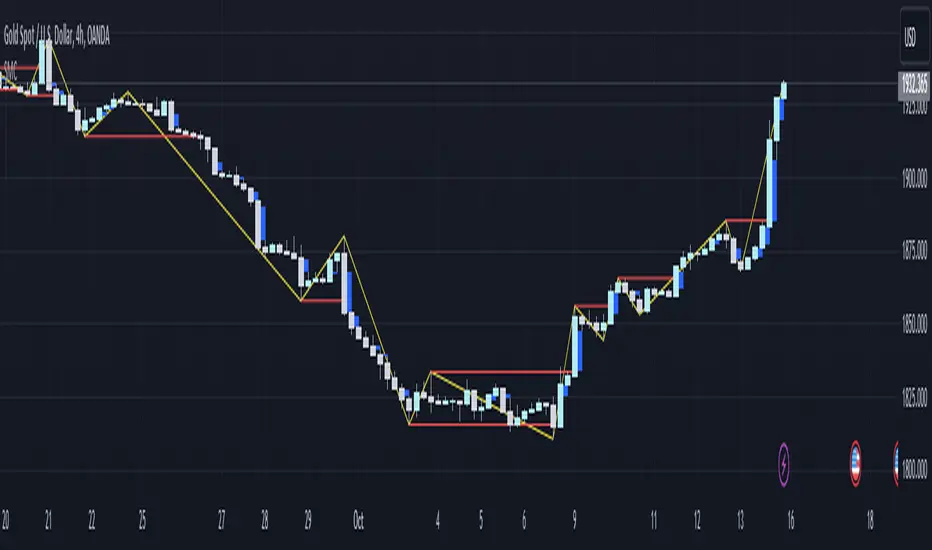
First Example
In the screenshot above, the market displays a downward structure until a manipulation occurs, followed by a CHoCH break. This is a standard entry model featuring an entry at the nearest FVG, a stop-loss placed beyond the manipulation, and a target at the nearest liquidity zone—whether session-based or, as in our case, a gap (one of the FVG types) that price commonly revisits.
This is considered a more aggressive entry because we only waited for a single confirmation of the trend change—the CHoCH break—and then entered immediately afterward. While the WinRate might be lower in such trades, the Risk-Reward ratio is typically very high if you correctly identify the manipulation.
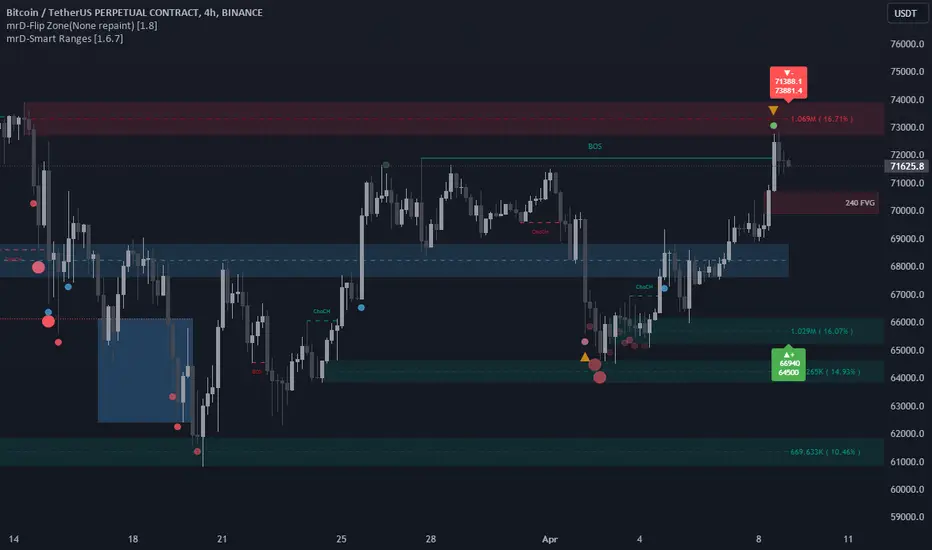
Second Example
This approach is more conservative and less risky, typically offering a higher WinRate but with a lower Risk-Reward ratio.
Here, we use the 4H FVG as our decision point (POI). With the indicator, we plot the 4-hour FVG on our current chart without needing to switch back and forth between timeframes.
Once price reaches our POI, we look for an entry model that includes three confirmations:
First Confirmation – A CHoCH break.
Second Confirmation – A manipulation.
Third Confirmation – A second BOS break.
We wait for all these confirmations before entering the trade, ensuring our stop-loss is well-protected since the remaining liquidity has been swept and the 4-hour FVG has been fully filled.
Our target is the full fill of a higher timeframe FVG or other high-liquidity levels below.
In a conservative setup, it is crucial to allow a complete OrderFlow to develop, including manipulations and clear breaks of lower levels. This approach helps protect the trade and often results in a higher WinRate.
🟠 Disclaimer
Past performance is not indicative of future results. To trade successfully, it is crucial to have a thorough understanding of the market context and the specific situation at hand. Always conduct your own research and analysis before making any trading decisions.
To gain access to the indicator, please review the author's instructions below this post

Smart Money Concept [TradingFinder] Major OB + FVG + Liquidity🔵 Introduction
"Smart Money" refers to funds under the control of institutional investors, central banks, funds, market makers, and other financial entities. Ordinary people recognize investments made by those who have a deep understanding of market performance and possess information typically inaccessible to regular investors as "Smart Money".
Consequently, when market movements often diverge from expectations, traders identify the footprints of smart money. For example, when a classic pattern forms in the market, traders take short positions. However, the market might move upward instead. They attribute this contradiction to smart money and seek to capitalize on such inconsistencies in their trades.
The "Smart Money Concept" (SMC) is one of the primary styles of technical analysis that falls under the subset of "Price Action". Price action encompasses various subcategories, with one of the most significant being "Supply and Demand", in which SMC is categorized.
The SMC method aims to identify trading opportunities by emphasizing the impact of large traders (Smart Money) on the market, offering specific patterns, techniques, and trading strategies.
🟣 Key Terms of Smart Money Concept (SMC)
• Market Structure (Trend)
• Change of Character (ChoCh)
• Break of Structure (BoS)
• Order Blocks (Supply and Demand)
• Imbalance (IMB)
• Inefficiency (IFC)
• Fair Value Gap (FVG)
• Liquidity
• Premium and Discount
🔵 How Does the "Smart Money Concept Indicator" Work?
🟣 Market Structure
a. Accumulation
b. Market-Up
c. Distribution
d. Market-Down
a) Accumulation Phase : During the accumulation period, typically following a downtrend, smart money enters the market without significantly affecting the pricing trend.
b) Market-Up Phase : In this phase, the price of an asset moves upward from the accumulation range and begins to rise. Usually, the buying by retail investors is the main driver of this trend, and due to positive market sentiment, it continues.
c) Distribution Phase : The distribution phase, unlike the accumulation stage, occurs after an uptrend. In this phase, smart money attempts to exit the market without causing significant price fluctuations.
d) Market-Down Phase : In this stage, the price of an asset moves downward from the distribution phase, initiating a prolonged downtrend. Smart money liquidates all its positions by creating selling pressure, trapping latecomer investors.
The result of these four phases in the market becomes the market trend.
Types of Trends in Financial Markets :
a. Up-Trend
b. Down Trend
c. Range (No Trend)
a) Up-Trend : The market breaks consecutive highs.
b) Down Trend : The market breaks consecutive lows.
c) No Trend or Range : The market oscillates within a range without breaking either highs or lows.
🟣 Change of Character (ChoCh)
The "ChoCh" or "Change of Character" pattern indicates an initial change in order flow in financial markets. This structural change occurs when a major pivot in the opposite direction of the market trend fails. It signals a potential change in the market trend and can serve as a signal for short-term or long-term trend changes in a trading symbol.
🟣 Break of Structure (BoS)
The "BoS" or "Break of Structure" pattern indicates the continuation of the trend in financial markets. This structure forms when, in an uptrend, the price breaks its ceiling or, in a downtrend, the price breaks its floor.
🟣 Order Blocks (Supply and Demand)
Order blocks consist of supply and demand areas where the likelihood of price reversal is higher. There are six order blocks in this indicator, categorized based on their origin and formation reasons.
a. Demand Main Zone, "ChoCh" Origin.
b. Demand Sub Zone, "ChoCh" Origin.
c. Demand All Zone, "BoS" Origin.
d. Supply Main Zone, "ChoCh" Origin.
e. Supply Sub Zone, "ChoCh" Origin.
f. Supply All Zone, "BoS" Origin.
🟣 FVG | Inefficiency | Imbalance
These three terms are almost synonymous. They describe the presence of gaps between consecutive candle shadows. This inefficiency occurs when the market moves rapidly. Primarily, imbalances and these rapid movements stem from the entry of smart money and the imbalance between buyer and seller power. Therefore, identifying these movements is crucial for traders.
These areas are significant because prices often return to fill these gaps or even before they occur to fill price gaps.
🟣 Liquidity
Liquidity zones are areas where there is a likelihood of congestion of stop-loss orders. Liquidity is considered the driving force of the entire market, and market makers may manipulate the market using these zones. However, in many cases, this does not happen because there is insufficient liquidity in some areas.
Types of Liquidity in Financial Markets :
a. Trend Lines
b. Double Tops | Double Bottoms
c. Triple Tops | Triple Bottoms
d. Support Lines | Resistance Lines
All four types of liquidity in this indicator are automatically identified.
🟣 Premium and Discount
Premium and discount zones can assist traders in making better decisions. For instance, they may sell positions in expensive ranges and buy in cheaper ranges. The closer the price is to the major resistance, the more expensive it is, and the closer it is to the major support, the cheaper it is.
🔵 How to Use
🟣 Change of Character (ChoCh) and Break of Structure (BoS)
This indicator detects "ChoCh" and "BoS" in both Minor and Major states. You can turn on the display of these lines by referring to the last part of the settings.
🟣 Order Blocks (Supply and Demand)
Order blocks are Zones where the probability of price reversal is higher. In demand Zones you can buy opportunities and in supply Zones you can check sell opportunities.
The "Refinement" feature allows you to adjust the width of the order block according to your strategy. There are two modes, "Aggressive" and "Defensive," in the "Order Block Refine". The difference between "Aggressive" and "Defensive" lies in the width of the order block.
For risk-averse traders, the "Defensive" mode is suitable as it provides a lower loss limit and a greater reward-to-risk ratio. For risk-taking traders, the "Aggressive" mode is more appropriate. These traders prefer to enter trades at higher prices, and this mode, which has a wider order block width, is more suitable for this group of individuals.
🟣 Fair Value Gap (FVG) | Imbalance (IMB) | Inefficiency (IFC)
In order to identify the "fair value gap" on the chart, it must be analyzed candle by candle. In this process, it is important to pay attention to candles with a large size, and a candle and a candle should be examined before that.
Candles before and after this central candle should have long shadows and their bodies should not overlap with the central candle body. The distance between the shadows of the first and third candles is known as the FVG range.
These areas work in two ways :
• Supply and demand area : In this case, the price reacts to these areas and the trend is reversed.
• Liquidity zone : In this scenario, the price "fills" the zone and then reaches the order block.
Important note : In most cases, the FVG zone of very small width acts as a supply and demand zone, while the zone of significant width acts as a liquidity zone and absorbs price.
When the FVG filter is activated, the FVG regions are filtered based on the specified algorithm.
FVG filter types include the following :
1. Very Aggressive Mode : In addition to the initial condition, an additional condition is considered. For bullish FVG, the maximum price of the last candle must be greater than the maximum price of the middle candle.
Similarly, for a bearish FVG, the minimum price of the last candle must be lower than the minimum price of the middle candle. This mode removes the minimum number of FVGs.
2. Aggressive : In addition to the very aggressive condition, the size of the middle candle is also considered. The size of the center candle should not be small and therefore more FVGs are removed in this case.
3. Defensive : In addition to the conditions of the very aggressive mode, this mode also considers the size of the middle pile, which should be relatively large and make up the majority of the body.
Also, to identify bullish FVGs, the second and third candles must be positive, while for bearish FVGs, the second and third candles must be negative. This mode filters out a significant number of FVGs and keeps only those of good quality.
4. Very Defensive : In addition to the conditions of the defensive mode, in this mode the first and third candles should not be very small-bodied doji candles. This mode filters out most FVGs and only the best quality ones remain.
🟣 Liquidity
These levels are where traders intend to exit their trades. "Market makers" or smart money usually accumulate or distribute their trading positions near these levels, where many retail traders have placed their "stop loss" orders. When liquidity is collected from these losses, the price often reverses.
A "Stop hunt" is a move designed to offset liquidity generated by established stop losses. Banks often use major news events to trigger stop hunts and capture liquidity released into the market. For example, if they intend to execute heavy buy orders, they encourage others to sell through stop-hots.
Consequently, if there is liquidity in the market before reaching the order block area, the validity of that order block is higher. Conversely, if the liquidity is close to the order block, that is, the price reaches the order block before reaching the liquidity limit, the validity of that order block is lower.
🟣 Alert
With the new alert functionality in this indicator, you won't miss any important trading signals. Alerts are activated when the price hits the last order block.
1. It is possible to set alerts for each "symbol" and "time frame". The system will automatically detect both and include them in the warning message.
2. Each alert provides the exact date and time it was triggered. This helps you measure the timeliness of the signal and evaluate its relevance.
3. Alerts include target order block price ranges. The "Proximal" level represents the initial price level strike, while the "Distal" level represents the maximum price gap in the block. These details are included in the warning message.
4. You can customize the alert name through the "Alert Name" entry.
5. Create custom messages for "long" and "short" alerts to be sent with notifications.
🔵 Setting
a. Pivot Period of Order Blocks Detector :
Using this parameter, you can set the zigzag period that is formed based on the pivots.
b. Order Blocks Validity Period (Bar) :
You can set the validity period of each Order Block based on the number of candles that have passed since the origin of the Order Block.
c. Demand Main Zone, "ChoCh" Origin :
You can control the display or not display as well as the color of Demand Main Zone, "ChoCh" Origin.
d. Demand Sub Zone, "ChoCh" Origin :
You can control the display or not display as well as the color of Demand Sub Zone, "ChoCh" Origin.
e. Demand All Zone, "BoS" Origin :
You can control the display or not display as well as the color of Demand All Zone, "BoS" Origin.
f. Supply Main Zone, "ChoCh" Origin :
You can control the display or not display as well as the color of Supply Main Zone, "ChoCh" Origin.
g. Supply Sub Zone, "ChoCh" Origin :
You can control the display or not display as well as the color of Supply Sub Zone, "ChoCh" Origin.
h. Supply All Zone, "BoS" Origin :
You can control the display or not display as well as the color of Supply All Zone, "BoS" Origin.
i. Refine Demand Main : You can choose to be refined or not and also the type of refining.
j. Refine Demand Sub : You can choose to be refined or not and also the type of refining.
k. Refine Demand BoS : You can choose to be refined or not and also the type of refining.
l. Refine Supply Main : You can choose to be refined or not and also the type of refining.
m. Refine Supply Sub : You can choose to be refined or not and also the type of refining.
n. Refine Supply BoS : You can choose to be refined or not and also the type of refining.
o. Show Demand FVG : You can choose to show or not show Demand FVG.
p. Show Supply FVG : You can choose to show or not show Supply FVG
q. FVG Filter : You can choose whether FVG is filtered or not. Also specify the type of filter you want to use.
r. Show Statics High Liquidity Line : Show or not show Statics High Liquidity Line.
s. Show Statics Low Liquidity Line : Show or not show Statics Low Liquidity Line.
t. Show Dynamics High Liquidity Line : Show or not show Dynamics High Liquidity Line.
u. Show Dynamics Low Liquidity Line : Show or not show Dynamics Low Liquidity Line.
v. Statics Period Pivot :
Using this parameter, you can set the Swing period that is formed based on Static Liquidity Lines.
w. Dynamics Period Pivot :
Using this parameter, you can set the Swing period that is formed based Dynamics Liquidity Lines.
x. Statics Liquidity Line Sensitivity :
is a number between 0 and 0.4. Increasing this number decreases the sensitivity of the "Statics Liquidity Line Detection" function and increases the number of lines identified. The default value is 0.3.
y. Dynamics Liquidity Line Sensitivity :
is a number between 0.4 and 1.95. Increasing this number increases the sensitivity of the "Dynamics Liquidity Line Detection" function and decreases the number of lines identified. The default value is 1.
z. Alerts Name : You can customize the alert name using this input and set it to your desired name.
aa. Alert Demand Main Mitigation :
If you want to receive the alert about Demand Main 's mitigation after setting the alerts, leave this tick on. Otherwise, turn it off.
bb. Alert Demand Sub Mitigation :
If you want to receive the alert about Demand Sub's mitigation after setting the alerts, leave this tick on. Otherwise, turn it off.
cc. Alert Demand BoS Mitigation :
If you want to receive the alert about Demand BoS's mitigation after setting the alerts, leave this tick on. Otherwise, turn it off.
dd. Alert Supply Main Mitigation :
If you want to receive the alert about Supply Main's mitigation after setting the alerts, leave this tick on. Otherwise, turn it off.
ee. Alert Supply Sub Mitigation :
If you want to receive the alert about Supply Sub's mitigation after setting the alerts, leave this tick on. Otherwise, turn it off.
ff. Alert Supply BoS Mitigation :
If you want to receive the alert about Supply BoS's mitigation after setting the alerts, leave this tick on. Otherwise, turn it off.
gg. Message Frequency :
This parameter, represented as a string, determines the frequency of announcements. Options include: 'All' (triggers the alert every time the function is called), 'Once Per Bar' (triggers the alert only on the first call within the bar), and 'Once Per Bar Close' (activates the alert only during the final script execution of the real-time bar upon closure). The default setting is 'Once per Bar'.
hh. Show Alert time by Time Zone :
The date, hour, and minute displayed in alert messages can be configured to reflect any chosen time zone. For instance, if you prefer London time, you should input 'UTC+1'. By default, this input is configured to the 'UTC' time zone.
ii. Display More Info : The 'Display More Info' option provides details regarding the price range of the order blocks (Zone Price), along with the date, hour, and minute. If you prefer not to include this information in the alert message, you should set it to 'Off'.
You also have access to display or not to display, choose the Style and Color of all the lines below :
a. Major Bullish "BoS" Lines
b. Major Bearish "BoS" Lines
c. Minor Bullish "BoS" Lines
d. Minor Bearish "BoS" Lines
e. Major Bullish "ChoCh" Lines
f. Major Bearish "ChoCh" Lines
g. Minor Bullish "ChoCh" Lines
h. Minor Bearish "ChoCh" Lines
i. Last Major Support Line
j. Last Major Resistance Line
k. Last Minor Support Line
l. Last Minor Resistance Line

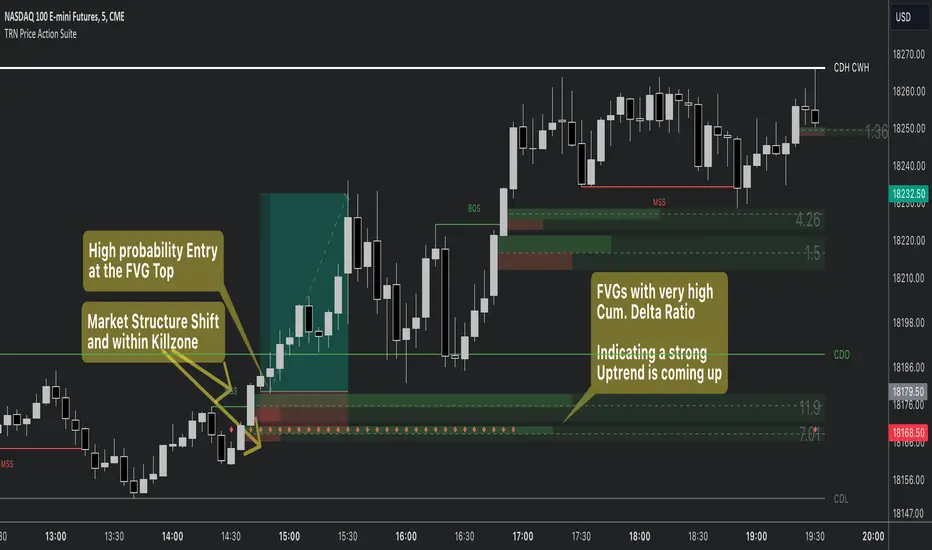
Price Action SuiteThe TRN Price Action Suite incorporates a treasure trove of time and price action concepts. It includes a set of trading tools that, when combined, allow for a more accurate view of the market. This enables traders to find high probability entry points before the market moves to the next liquidation level.
Features of the TRN Price Action Suite:
(Inverse) Fair Value Gaps (FVG)
Order Blocks (OB)
FVG and OB with Cumulative Volume Delta
Volume Imbalances
Market Structure
Liquidity levels
Sessions
Kill zones/Opening Range
The indicator helps traders to easily identify favorable market conditions and high probability trade setups. It automatically finds time and price action concepts and displays them in an intuitive way on the chart. One of the highlights is the detection of Fair Value Gaps and Order Blocks in connection with Cumulative Volume Delta (approx.). You will not find this connection anywhere else.
Fair Value Gaps (FVGs)
A fair value gap occurs when there are inefficiencies in the market or imbalanced buying and selling pressures. Fair value gaps can become a magnet for the price before continuing in the same direction. Special attention should be paid to FVGs that are supported by support and resistance levels, as these offer a higher probability of success for trades. Additionally, the indicator plots inverse FVG (iFVG). These are FVG that are “closed” by a FVG in the other direction. IFVGs are a strong sign of the market to continue in the direction of the iFVG.
In addition to the FVGs you see on the chart, you can add also FVGs from a higher timeframe including the cumulative buy/sell volume. For this you can set “Timeframe 1” and “Timeframe 2” in the settings to your preferred timeframes. E.g. you trade on a 5-minute chart, and you want to see FVGs from 4 hours and a daily chart, then you set Timeframe 1 to 4 h and to Timeframe 2 to 1 D.
Order Blocks and Volume Imbalances can also be shown from higher timeframes.
Order Blocks (OBs)
Order blocks are areas on the chart where a high concentration of limit orders was found in the past. They can serve as potential support or resistance areas. These represent areas in the market where there is an oversupply (supply) or an excess demand (demand). They are often key zones for potential turning points or continuations of the current trend. A bullish OB, for example, is the last bearish candle before a significant uptrend.
FVGs and OBs with Cumulative Volume Delta
The TRN Price Action Suite can show FVGs and OBs with the corresponding Cumulative Volume Delta (CVD). It is a metric to analyze market dynamics by tracking the net difference between buying and selling volumes over a specific timeframe. It is used to determine the strength of the FVG/OB. The FVG/OB includes two bars on the left side, indicating the cumulative buy volume in green as well es the cumulative sell volume in red. At the right side of the FVG/OB box the ratio of the cumulative buy/sell volume is displayed. A high ratio over 1, for example 1.5, indicates a lot of buying pressure. On the hand, a ratio far below 1, for example 0.66, indicates a lot of selling pressure.
Volume Imbalances (VIBs)
Volume Imbalances indicate a price gap from the previous close, but unlike gaps, there is no absence of trading activity within a specific price range. Bullish VIs have opening and closing prices above the previous close, with overlap between the current low and previous high. Bearish VIs are vice versa.
Market Structure
The market structure represents the dominant trend in the market. It is based on swing highs and lows. For instance, if the price makes higher highs (HH) and higher lows (HL) the market structure represents an uptrend. Vice versa if price makes lower lows (LL) and lower highs (LH) the market trend is down.
If the market structure is up, traders can enter positions in a pullback. For this, a trader could use a FVG or an OB as an entry condition.
Market Structure Shift (MSS) (Change of Character (ChoCh))
A market structure shift occurs when the market transitions from one dominant trend to a different one, often signaling a potential change in the underlying market dynamics. A MSS signals the start of a new trend. It signals the change from an uptrend to a down trend and vice versa. Therefore, it is sometimes called change of character (ChoCh). A valid MSS should ideally occur in a strong supply or demand zone. This indicates that the market may be approaching a trend reversal or consolidation.
Break of Structure (BOS)
A break of structure happens when the market breaks out of its established trading range or pattern. The market continues its dominant trend, indicated by the last MSS.
In an uptrend, for example, each time the price breaks through a new high, a "bullish BOS" is formed. This indicates that the market can overcome previous resistance levels and continue to rise.
Levels
One core concept in trading is that price flows to areas of liquidity. Natural liquidity areas are the current day open, high, low (CDO, CDH, CDL) or the previous day high, low, close (PDH, PDL, PDC). The same is true for the current week (CWO, CWH, CWL) and the previous week (PWH, PWL, PWC).
Pay special attention in case some of these levels are close together. Then these levels serve like a magnet for the price. The TRN Price Action Suite indicator can cluster these levels fully automatically together to give the trader the flexibility to focus solely on the trading part.
Sessions
Sessions are the trading hours during which the banks are actively trading. The three main trading sessions:
Asia: Most of the volume from the Asian players are handled within this session.
London: This is where the European players are most active.
New York: In the New York session all the USA players are active as well as all the other American players. Furthermore, a lot of global players are active in this session as well.
Killzones
A kill zone in trading refers to a specific time period during the trading day when the market experiences increased volatility and liquidity. It is an opportunity for traders to capitalize on potential price movements and generate profits. There are several different killzones during the day.
There are three different types of killzones:
Indices/Futures: This one is suitable if you trade products like the ES, NQ, FDAX, CL or Stocks, Options.
Forex: If you trade Forex this setting will mark the most liquid periods of the day.
Opening Range: In case you trade the opening range of the sessions, use this setting.
Trading Example
Breaker Blocks Screener | Flux Charts💎 GENERAL OVERVIEW
Introducing our new Breaker Blocks Screener! This screener can provide information about the latest breaker blocks in up to 5 tickers. You can also customize the algorithm that finds the breaker blocks and the styling of the screener.
Features of the new Breaker Blocks Screener :
Find Latest Breaker Blocks Accross 5 Tickers
Latest Status, Restests & Volume
Customizable Algoritm / Styling
📌 HOW DOES IT WORK ?
Breaker blocks form when an order block fails, or "breaks". It is often associated with market going in the opposite direction of the broken order block, and they can be spotted by following order blocks and finding the point they get broken, ie. price goes below a bullish order block.
The volume of a breaker block is simply the total volume of the bar that the original order block is broken. Often the higher the breaking bar's volume, the stronger the breaker block is.
This screener then finds breaker blocks accross 5 different tickers, and shows the latest information about them.
Status ->
Far -> The current price is far away from the breaker block.
Approaching ⬆️/⬇️ -> The current price is approaching the breaker block, and the direction it's approaching from.
Inside -> The price is currently inside the breaker block.
Retests -> Retest means the price to invalidate the breaker block, but failed to do so. Here you can see how many times the price retested the breaker block.
For the volume, check the top of the "How Does It Work" section.
🚩UNIQUENESS
This screener can detect latest breaker blocks and give information about them for up to 5 tickers. This saves the user time by showing them all in a dashboard at the same time. The screener shows the number of the retests of the breaker block as an unique trait. Another unique ability of the screener is that it shows the latest valid breaker block's volume in the dashboard.
⚙️SETTINGS
1. Tickers
You can set up to 5 tickers for the screener to scan breaker blocks here. You can also enable / disable them and set their individual timeframes.
2. General Configuration
Zone Invalidations -> Select between Wick & Close price for Order & Breaker Block Invalidation.
Swing Length -> Swing length is used when finding order block formations. Smaller values will result in finding smaller order blocks.

Liquidity Grab Screener | Flux Charts💎 GENERAL OVERVIEW
Introducing our new Liquidity Grab Screener! This screener can provide information about the latest liquidity grabs in up to 5 tickers. You can also customize the algorithm that finds the liquidity grabs and the styling of the screener.
Features of the new Liquidity Grab Screener :
Find Latest Liquidity Grabs Accross 5 Tickers
Price, Size, Status Information
Customizable Algoritm / Styling
📌 HOW DOES IT WORK ?
Liquidity grabs occur when one of the latest pivots has a false breakout. Then, if the wick to body ratio of the bar is higher than 0.5 (can be changed from the settings) a bubble is plotted.
The bubble size is determined by the wick to body ratio of the candle.
This screener then finds liquidity grabs accross 5 different tickers, and shows the latest information about them.
Price -> The price when the liquidity grab happened.
Size -> Size of the liquidity grab, determined by the wick-body ratio.
Status -> Shows the elapsed time of the liquidity grab.
🚩UNIQUENESS
Liquidity grabs can be useful when determining candles that have executed a lot of market orders, and planning your trades accordingly. This screener will find liquidity grabs from up to 5 tickers and give information about their price, size and status. The screener also lets you customize the pivot length and the wick-body ratio for liquidity grabs.
⚙️SETTINGS
1. Tickers
You can set up to 5 tickers for the screener to scan order blocks here. You can also enable / disable them and set their individual timeframes.
2. General Configuration
Pivot Length -> This setting determines the range of the pivots. This means a candle has to have the highest / lowest wick of the previous X bars and the next X bars to become a high / low pivot.
Wick-Body Ratio -> After a pivot has a false breakout, the wick-body ratio of the latest candle is tested. The resulting ratio must be higher than this setting for it to be considered as a liquidity grab.

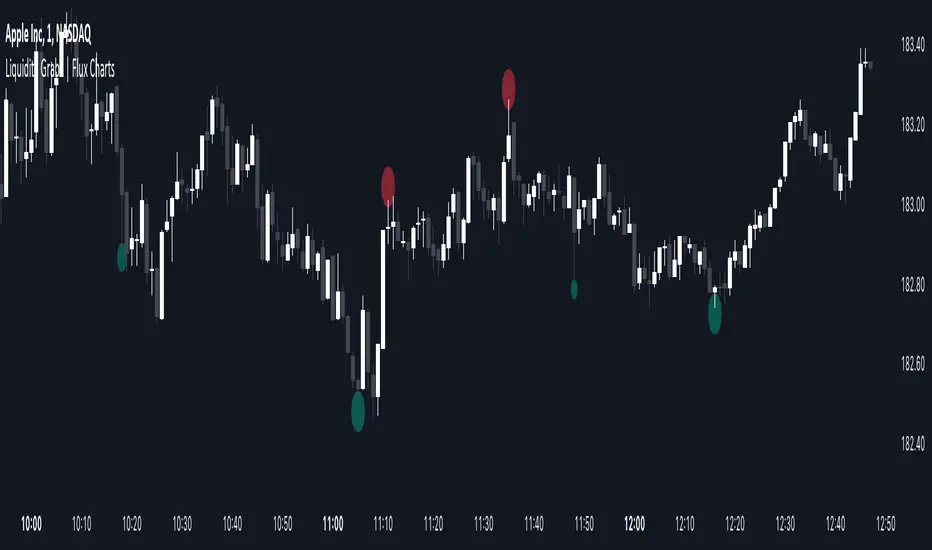
Liquidity Grabs | Flux Charts💎 GENERAL OVERVIEW
Introducing our new Liquidity Grabs indicator! This indicator can renders bubbles with different sizes at candles that have liquidity grabs, which happen when a liquidity areas (buyside / sellside liquidity) is swept. These candles often fill a lot of market orders that were sitting on the liquidity zone. You can check "How Does It Work" section for more information.
Features of the new Liquidity Grabs Indicator :
Renders Liquidity Grabs
Customizable Algorithm
Customizable Styles
Alerts
🚩UNIQUENESS
Liquidity grabs can be useful when determining candles that have executed a lot of market orders, and planning your trades accordingly. This indicator renders liquidity grabs in an unique bubble style, the size of the bubble is calculated by the size of the wick that caused the liquidity grab. The indicator also lets you customize the pivot length and the wick-body ratio for liquidity grabs.
📌 HOW DOES IT WORK ?
Liquidity grabs occur when one of the latest pivots has a false breakout. Then, if the wick to body ratio of the bar is higher than 0.5 (can be changed from the settings) a bubble is plotted. Using the wick length as a metric to measure liquidity is good because long wicks can translate to a large amount of buyers / sellers entering the market.
The bubble size is determined by the wick to body ratio of the candle.
⚙️SETTINGS
1. General Configuration
Pivot Length -> This setting determines the range of the pivots. This means a candle has to have the highest / lowest wick of the previous X bars and the next X bars to become a high / low pivot.
Wick-Body Ratio -> After a pivot has a false breakout, the wick-body ratio of the latest candle is tested. The resulting ratio must be higher than this setting for it to be considered as a liquidity grab.
Market Structure [Truth Indie]Market Structure
Market structure is a crucial component of various trading methodologies. If you can accurately map the market structure, tailored to the volatility or assets you are trading, it helps you identify trends clearly and enhances the accuracy of your trading strategies.
This indicator facilitates easy and swift mapping of market structure for traders. The market structure in this indicator consists of 3 types:
1.Fractal structure
2.Internal structure
3.External structure
FRACTAL STRUCTURE MAPPING
-Wick breaks are sufficient for a Fractal break of structure.
-The precise moment when the price breaks a Fractal high or low confirms the break.
BULLISH & BEARISH FRACTAL STRUCTURE
Bullish Fractal Structure:
-A Fractal high is validated when the subsequent candle fails to surpass its high (fractal pullback).
-A Fractal higher low is validated once the price breaches the Fractal high (always identify the NEAREST Fractal low). This will be the most recent candle that was unable to exceed the high of the previous candle.
Bearish Fractal Structure:
-A Fractal low is validated when the following candle fails to break its low (fractal pullback).
-A Fractal lower high is validated once the price breaks the Fractal low (always identify the NEAREST Fractal high). This will be the most recent candle that was unable to surpass the low of the previous candle.
Settings
-Show or hide text and lines, including adjusting the color of text and lines.
-Adjust the size of text, and change the type of lines, including modifying text when there is a BoS and CHoCH.
-Mark swing when there is a valid pullback, adjust the size and color.
INTERNAL STRUCTURE MAPPING
Body breaks confirm an internal structure break.
BULLISH & BEARISH INTERNAL STRUCTURE
Bullish Internal Structure:
-An internal high is validated with 4 optional criteria.
-An internal higher low is validated when the internal high structure is broken. A higher low refers to the lowest price.
Bearish Internal Structure:
-An internal low is validated with 4 optional criteria.
-An internal lower high is validated when the internal high structure is broken. A lower high refers to the highest price.
Settings
-Show or hide text and lines, including adjusting the color of text and lines.
-Adjust the size of text, and change the type of lines, including modifying text when there is a BoS and CHoCH.
-Mark swing when there is a valid pullback, adjust the size and color.
Validation of pullback has 4 options for exploration, with the default value set to Fractal CHoCH 1 time:
1.Fractal CHoCH 1 time.
2.Fractal CHoCH and wait for Fractal BoS/Fractal CHoCH 3 times in a row.
3.PIP Rule, using PIP to determine the distance of a valid pullback.
-Show or hide lines and values. This option will only display results when you activate the PIP Rule. Change the style of lines and change the color of lines.
-In the PIP field, enter the PIP value you want to explore. In the 1 PIP Size field, enter the decimal places in the asset you are trading. For example, for the EUR/USD pair with decimals at position 4.
4.ATR Rule, utilizing ATR multiples to establish the range of a valid pullback.
-Show or hide lines and values. This option will only display results when you activate the ATR Rule. Change the style of lines and change the color of lines.
-ATR type allows you to choose from 5 ma types. ATR Period adjusts the backward-looking average value you want to explore. Multiple: Enter a multiplier value for ATR to match the volatility or asset you are trading.
If you choose only ATR Rule, the result is the validation of the pullback with ATR Rule only. If you choose more than 1 option, whichever condition is true, the validation pullback occurs immediately. If you don't choose anything, the default value is Internal CHoCH 1 time.
Swing internal structure
-Show or hide text and lines, including adjusting the color of text and lines.
-Adjust the size of text, and change the type of lines, including modifying text.
Equilibrium internal
-Show or hide text and lines, including adjusting the color of text and lines.
-Adjust the size of text, and change the type of lines, including modifying text.
-Adjust the percentage of Equilibrium.
EXTERNAL STRUCTURE MAPPING
Body breaks confirm an internal structure break.
BULLISH & BEARISH EXTERNAL STRUCTURE
Bullish external Structure:
-An external high is validated with 4 optional criteria.
-An external higher low is validated when the external high structure is broken. A higher low refers to the lowest price.
Bearish external Structure:
-An external low is validated with 4 optional criteria.
-An external lower high is validated when the external high structure is broken. A lower high refers to the highest price.
Settings
-Show or hide text and lines, including adjusting the color of text and lines.
-Adjust the size of text, and change the type of lines, including modifying text when there is a BoS and CHoCH.
-Mark swing when there is a valid pullback, adjust the size and color.
Validation of pullback has 4 options for exploration, with the default value set to Internal CHoCH 1 time:
1.Internal CHoCH 1 time.
2.Internal CHoCH and wait for Internal BoS/Internal CHoCH 3 times in a row.
3.PIP Rule, using PIP to determine the distance of a valid pullback.
-Show or hide lines and values. This option will only display results when you activate the PIP Rule. Change the style of lines and change the color of lines.
-In the PIP field, enter the PIP value you want to explore. In the 1 PIP Size field, enter the decimal places in the asset you are trading. For example, for the EUR/USD pair with decimals at position 4.
4.ATR Rule, utilizing ATR multiples to establish the range of a valid pullback.
-Show or hide lines and values. This option will only display results when you activate the ATR Rule. Change the style of lines and change the color of lines.
-ATR type allows you to choose from 5 ma types. ATR Period adjusts the backward-looking average value you want to explore. Multiple: Enter a multiplier value for ATR to match the volatility or asset you are trading.
If you choose only ATR Rule, the result is the validation of the pullback with ATR Rule only. If you choose more than 1 option, whichever condition is true, the validation pullback occurs immediately. If you don't choose anything, the default value is Internal CHoCH 1 time.
Swing external structure
-Show or hide text and lines, including adjusting the color of text and lines.
-Adjust the size of text, and change the type of lines, including modifying text.
Equilibrium external
-Show or hide text and lines, including adjusting the color of text and lines.
-Adjust the size of text, and change the type of lines, including modifying text.
-Adjust the percentage of Equilibrium.
The values of these 4 options are: 1. PIP Rule in the internal structure 2. ATR Rule in the internal structure 3. PIP Rule in the external structure 4. ATR Rule in the external structure
These 4 options will be displayed only when the rule is selected along with choosing to display the value.
DISCLAIMER
All investments involve risks. Profit or loss depends on your knowledge, understanding, and decisions.
My scripts/indicators/strategies are created for researching past price behavior only. They are not investment advice, and future results are not guaranteed.

Smart money conceptThe indicator tracks the smallest movements of price action. It can monitor and analyze market context, attempting to identify trends within each time frame.
If a candle has its entire body above the previous swing high, it indicates a strong upward momentum. The market is leaning towards an upward direction. If the candle remains within the range of the previous swing high, it signifies weak upward momentum. The market is reluctant to move higher.
If a candle has its entire body below the previous swing low, it reflects a strong downward momentum. The market is leaning towards a downward direction. If the candle remains within the range of the previous swing low, it indicates weak downward momentum. The market is reluctant to move lower.
Previous Days High & Low With AlertsAlerts: The updated script includes alerts for when the current price touches either the previous day's high (PDH) or low (PDL). This allows traders to receive notifications when these levels are breached.
Observing PDH/PDL: The script will display a single horizontal line representing both the Previous Day High (PDH) and Previous Day Low (PDL) from yesterday on the chart.
Alert Notifications: If you enabled alerts (by setting the "Enable Alerts" input to "true"), the script will trigger alerts when the current price action touches either the PDH or PDL.

Model Indicator |ASE|The purpose of this indicator is to allow the user to build their own model. Each feature works cohesively together and depending on the filters you enable, the model gives less and more specific entries. This benefits the trader because they have complete control over the kinds of trades they want to take, while maintaining its automatic form.
We want to be as customizable as possible while still meeting our users’ needs. We started this indicator to propel us into our ultimate project, the ASE Algo.
Features:
SMC Display
Current Structure:
Liquidity Levels:
Daily Premium Discount Array
SMT Divergence
Displacement Candles:
Entry Factors
FVG
Continuation FVGs
MTF FVGs
Order Blocks
MTF Order Blocks
Confluence Filters
MS Reversal
Liquidity Level Raid
Inducement
Daily Prem/Disc Array
Target Factors
Liquidity Level Targets
Current Structure Targets
Trade Management
Trade Overlay
Risk:Reward Target
Benefits & Examples:
In the image below the indicator signaled multiple entries based on two simple confluence filters, a MS reversal (CHoCH/MSS) and a Liquidity Raid. Going from left to right we can see a short entry at the highs with a supporting Order Block. Liquidity levels are taken before we see a double IDM right below the respected OB that leads to the next signaled entry. In the middle of the chart we see a long entry that leads right into a short entry showing the effectiveness of such a simple model.
In this supporting image we are showcasing the first implementation of the Trade Overlay feature. This feature displays the Entry and Stop Loss to make it more visible and adds a risk to reward target. Additionally displayed is the SMC Toolkit indicator showing us additional confirmation with our signaled entries playing right out of a higher timeframe FVG.
An additional entry feature is the MTF zone. Setups can form on all timeframes and subjecting yourself to only one may lead you to miss out on some perfect setups or a larger move. In the image below we are on the 1 minute timeframe. We can see the Initial Reversal Entry which played out beautifully and filled a higher timeframe SFVG. With the MTF zone we can see a 3 minute and 5 minute Zone which produces the rest of the trend reaching another higher timeframe SFVG after filling the previous one. Once again showing the benefit of the Toolkit indicator but the plotted entries from such a simple model.
In addition to the model indicators filtered out entry zone, we can use additional confluences to confirm these entries. In the image below we can see a short entry printed after a move out of the Std. Dev. vwap wave which shows over extension. Taking the entry we can have a tight stop loss at the vwap wave or the recent high where we have a liquidity level, targeting a lower liquidity level or higher timeframe FVG.
For this example we are only filtering based on MS Reversals (CHoCH/MSS) to get our entries. Because of this we need additional confirmation to be confident in taking the plotted entry. In the image below you can see a long signal printed, confirmation being the previous Failed Reversal.

mrD-Smart RangesmrD-Smart Ranges aims to offer a complete strategy based on Order Blocks. Ranges signals based on order volume are highlighted, from which smart ranges are suggested to provide potential entries.
This script also includes warnings for each signal marked.
🔶 SETTINGS
Pair Strategy: Select the desired from the list. Change the chart to the one specified in the Strategy.
Current TF Order Blocks: Allows the user to select how many most recent Internal Order Blocks appear in the current time frame on the chart.
Order Block Filter: Allows the user to select how the script mitigates an Order Block.
Hide Overlap: Allows the user to display overlapping Order Blocks.
Show Metrics: Allows the user to display volume % metrics within the Order Blocks.
Show Volume Box: Allows the user to display buy/sell activity within Order Blocks.
High Timeframe: Allows the user to choose a higher or lower timeframe to find the Signals.
Show Failed Buy Sell: Allows the user to display the Signals.
Show HTF Box: Allows the user to display a higher or lower timeframe Order Blocks.
🔶 DETAILS
Order blocks are formed after a slight bearish order block, these can provide an opportunity to change polarity, thus acting as a potential support/resistance level.
A retest/retrace on the order block, combined with order volume between the current timeframe and from the higher timeframe will establish the conditions for smart ranges are suggested to provide potential entries.
🔶 USAGE
mrD-Smart Ranges aims to provide users with a minimalistic screen next to the optimal ranges to keep in mind to find trading setups as shown below.
Here we can see a suggested Sell range and display a label to confirm this range
Signal(s) that can be used for potential entries only during range retest are order blocks.
Users can search for more potential entry ranges based on larger timeframes in the settings: High Timeframe
In the image above, we can see that the price has generated potential orange and bearish entry signals. A confirmation signal with a red label is displayed on the chart when the price retests the Sell range.
Note: While range retests can still work well if they occur later in price action, it's best to look for signals only when price retests the range at the outset rather than retesting it. second price.
The logic of generating signal ranges using different rules is described below:
- Define order blocks in the current timeframe.
- Define the order blocks with the largest volume in the current timeframe.
- Define order blocks in larger timeframes in High Timeframe settings
- Define order blocks with the largest volume in larger timeframes in High Timeframe settings
Entry Range: The combination of the highest volume order blocks in the current timeframe and the highest volume order blocks in the larger timeframe.
🔶General disclaimer:
Trading stocks, futures, forex, options, ETFs, cryptocurrency, or any other financial instrument has huge potential rewards and risks.
You must be aware of the risks and willing to accept them to invest in stocks, futures, forex, options, ETFs, or cryptocurrencies.
Don't trade with money you can't afford to lose.
This is not an offer or an offer to Buy/Sell stocks, futures, Forex, options, ETFs, cryptocurrencies, or any other financial instrument.
Do not represent that any account will or is likely to achieve profit or loss of any kind.
The past performance of any trading system or method is not necessarily indicative of future results.
My Scripts/Indicators/Ideas/Algos/Systems are only for educational purposes!
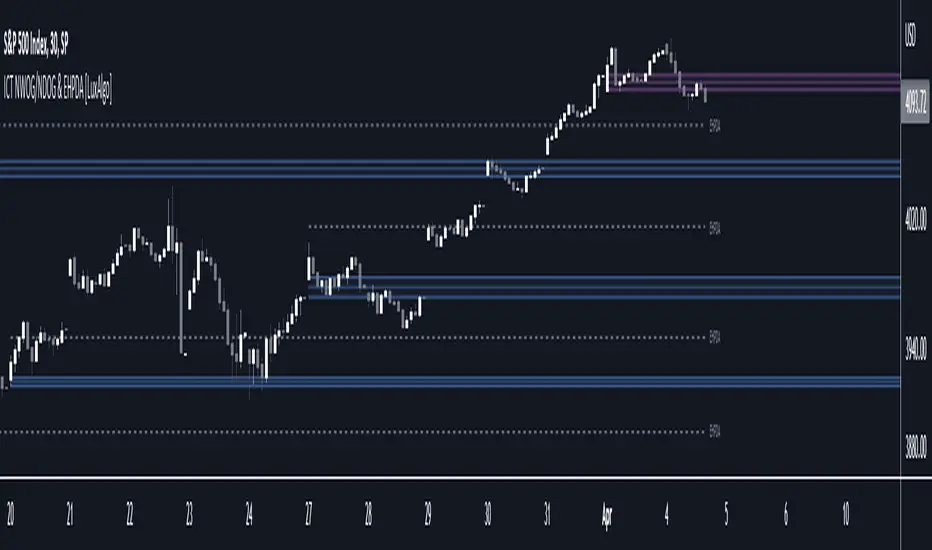
ICT NWOG/NDOG & EHPDA [LuxAlgo]This indicator displays New Week/Day Opening Gaps alongside Event Horizon PD Arrays which were conceptualized by a trader, ICT.
🔶 SETTINGS
Show: Determines if new week opening gaps (NWOG) or new day opening gaps (NDOG) are shown.
Amount: Controls the amount of most recent NWOGs/NDOGs to display on the chart.
Show EHPDA: Displays Event Horizons PD arrays.
🔶 USAGE
New Week/Day Opening Gaps are generally used as potential support or resistance areas.
Trader ICT describes that under consolidating market conditions, price tends to revert towards the opening gap area. This is consistent with other analysis suggesting that price has a tendency to come back toward gaps, ultimately looking to fill them.
ICT also introduces a novel concept, the "Event Horizon PD Array" (EHPDA) which are intermediary levels constructed from the average between the neighboring NWOGs or NDOGs.
EHPDA's are described by ICT as levels that "will not allow price to escape to the NWOG that will create a surge towards the NWOG it got too "close" to but has not yet reached."
Smart Money Concepts Probability (Expo)█ Overview
The Smart Money Concept Probability (Expo) is an indicator developed to track the actions of institutional investors, commonly known as "smart money." This tool calculates the likelihood of smart money being actively engaged in buying or selling within the market, referred to as the "smart money order flow."
The indicator measures the probability of three key events: Change of Character ( CHoCH ), Shift in Market Structure ( SMS ), and Break of Structure ( BMS ). These probabilities are displayed as percentages alongside their respective levels, providing a straightforward and immediate understanding of the likelihood of smart money order flow.
Finally, the backtested results are shown in a table, which gives traders an understanding of the historical performance of the current order flow direction.
█ Calculations
The algorithm individually computes the likelihood of the events ( CHoCH , SMS , and BMS ). A positive score is assigned for events where the price successfully breaks through the level with the highest probability, and a negative score when the price fails to do so. By doing so, the algorithm determines the probability of each event occurring and calculates the total profitability derived from all the events.
█ Example
In this case, we have an 85% probability that the price will break above the upper range and make a new Break Of Structure and only a 16.36% probability that the price will break below the lower range and make a Change Of Character.
█ Settings
The Structure Period sets the pivot period to use when calculating the market structure.
The Structure Response sets how responsive the market structure should be. A low value returns a more responsive structure. A high value returns a less responsive structure.
█ How to use
This indicator is a perfect tool for anyone that wants to understand the probability of a Change of Character ( CHoCH ), Shift in Market Structure ( SMS ), and Break of Structure ( BMS )
The insights provided by this tool help traders gain an understanding of the smart money order flow direction, which can be used to determine the market trend.
█ Any Alert function call
An alert is sent when the price breaks the upper or lower range, and you can select what should be included in the alert. You can enable the following options:
Ticker ID
Timeframe
Probability percentage
-----------------
Disclaimer
The information contained in my Scripts/Indicators/Ideas/Algos/Systems does not constitute financial advice or a solicitation to buy or sell any securities of any type. I will not accept liability for any loss or damage, including without limitation any loss of profit, which may arise directly or indirectly from the use of or reliance on such information.
All investments involve risk, and the past performance of a security, industry, sector, market, financial product, trading strategy, backtest, or individual's trading does not guarantee future results or returns. Investors are fully responsible for any investment decisions they make. Such decisions should be based solely on an evaluation of their financial circumstances, investment objectives, risk tolerance, and liquidity needs.
My Scripts/Indicators/Ideas/Algos/Systems are only for educational purposes!

Order Blocks GenieThe purpose of this Genie Algorithm Indicator is to identify Zones of institutional interest , including Order Blocks , while marking the Full Range Zones as well, with powerful smart tracking algorithm to mark and remove the appropriate levels to take for entries.
Order Blocks can be observed at the beginning of a strong, aggressive move, leaving behind a zone to be revisited later for "balance" the market. Therefore, these are interesting levels to place Limit/Market orders (Sell the Peaks or Buy the Valleys).
A Bullish Order Block is the last Bearish candle of a downtrend before a sequence of Bullish candles (thus forming a "Valley"). While a Bearish Order Block is the last Bullish candle of an uptrend before a sequence of Bearish candles (thus forming a "Peak").
Prices of the levels could be printed on the Price Scale, as well as many detailed configurations of what activates these Peak/Valleys (Zones) such as a Breakout, Close, Hard Close or Full Close. See the Tooltips in the Settings for all details of each option.
The strategy is to take the Untested Levels as long as the chart is maintaining the trend (ladder), preferably going with the trend for a higher win rate (or against it for a quick scalp). Be mindful of the breaking of a ladder or building of a new one. A ladder breaks with a hard close of a candle across the closest two levels; a ladder builds by not breaking back down across the levels it has tested. Strong ladders will have a few untested levels and come back to wick them but still retain the structure of the laddering direction (trending with Lower Lows + Lower High or Higher Lows + Higher Highs).
------------
Definitions:
1st Zone: The zone between the start of the initial candle of the Full Range (backside edge) to the 50% of Full Range Line (Average, aka. Equilibrium).
2nd Zone: The zone between 50% of Full Range Line (Average, aka. Equilibrium) to the 50% of Order Block (final candle left behind in the range before the aggressive move out).
Full Zone: 1st + 2nd Zones together.
Line: placed first at 50% of Full Range, and in specific cases gets moved to the 50% of Order Block.
Rules (in order):
- Wick Line: Mark Line Tested (light color)
- Close Beyond the Zone: Invalidate Full Zone (Remove Full Zone + Remove Line)
- Hard Close anywhere inside the Zone: Invalidate Full Zone (Remove Full Zone + Remove Line)
- Close inside 2nd Zone: Invalidate Full Zone (Remove Full Zone + Remove Line)
- Close inside 1st Zone: Shrink 1st Zone + Keep 2nd Zone + Move Line to 50% of Order Block
- Wick inside (or beyond) 2nd Zone before shrinking: Shrink 1st Zone + Keep 2nd Zone + Move Line to 50% of Order Block

Trade Entry Check list - Smart Money ConceptThe indicator you see is written to evaluate the input parameters for a trade. Since my own style is smart money, and I always used to write on paper or mentally calculate the necessary inputs for a trade, I wrote this indicator to prevent mental or paper calculations.
This indicator is made up of different sections that you can see in the table and make the necessary changes in the Options section.
The first section is your instrument, which is automatically displayed on every chart.
The next section is the current market, which is written based on smart money and divided into Asia Time, Frankfurt Time, London Time, Lunch Time, and New York Time sections. Depending on our style, we usually do not trade during the Frankfurt Time and Lunch Time sections.
The next section is about the ascending or descending structure of the 4-hour and 15-minute timeframes, which of course, you can change this structure to your desired one.
These two sections have both manual and automatic modes. I went through a lot of trouble for the automatic section, so don't easily skip it and be sure to test it.
The following sections relate to other reasons for entering a trade, which are divided into several sections. The first section is the entry reasons related to my personal strategy, which is completely defined and shows the input calculation in the Calculation section. The second section is your inputs without calculation in the Counter section, and the third section is your personal inputs including the Counter. You have deep access to customizing this table.

FXC Order Block Finder █ OVERVIEW
The FXC Order Bock Finder finds and draws institutional order blocks according to the Smart Money Concept. Order blocks are zones where institutions have most likely left some orders that need to be filled at a later point in time. In These order blocks or POIs can be used to either place limit orders or to look for instant entries as price comes to retest the zone. It works on all time frames but higher time frames tend to be more precise.
█ HOW DOES IT WORK?
The indicator waits for a break of structure (BOS) and then prints a zone if there's an engulfing pattern and an open imbalance. Basically it draws zones where a fake move followed by aggressive buying or selling happened and Imbalances were left open.
█ WHAT MAKES IT UNIQUE?
Apart from the fact that I haven’t found any indicator that is able to properly draw order blocks most indicators do re-paint which doesn’t make any sense in the case of the Smart Money Concept.
Furthermore does this indicator have settings that let’s you adjust how the order blocks are drawn. From wick to end of the imbalance or candle close to imbalance. Also you can set how many candles it takes into consideration for the imbalance in case the imbalance starts after the engulfing pattern has formed. And you can set how many candles have to checked to determine a BOS or an internal BOS by using fractal breaks.
█ HOW TO USE IT?
Either place sell limits at the lower end of the order block with SL slightly above the OB and buy limits at the upper end of the OB with SL slightly below the OB. Target a fixed Risk Reward Ratio or trade it to the next order block. By using multi time frame analysis you can determine the overall direction of the market and prevent low probability trades. Also worth mentioning is that order blocks that have been created during high volume sessions tend to result in way better trades than with order blocks that have been printed during the Asia session.
█ ADDITIONAL INFO
As soon as price retested an order block the order block is mitigated and therefore not valid anymore. Also order blocks that are too far back in time are less probable to deliver good trades. In general the win rate tends not to be too high using this method but more often than not there's a reaction as price taps into an order block and trades with high RRR are quite often. As always in trading, proper money management and risk management is key.
█ DISCLAIMER
This is not financial advice. The Indicator spots these zones according to the smart money concept . However there's absolutely no guarantee that a nice order blocks results in a good trade.
█ Examples

SMC RulesThis script allowes you to have a plan always shown on the chart.
You know how it is, sometimes you miss things and if you dont see your plan then you miss maybe an important part... so for this i wrote that simple script here.
So far it has 5 Sections you can edit in the settings to your liking.
On top you can also edit the swing structure you are seeing, so you dont have to always swap timeframes.
Also implemented are the Session times for Frankfurt, London, New York and Asia.
Its not enabled on default, but i find it quiet handy to have..
(including alerts)
I will update it from time to time, if you wish for something just let me know.
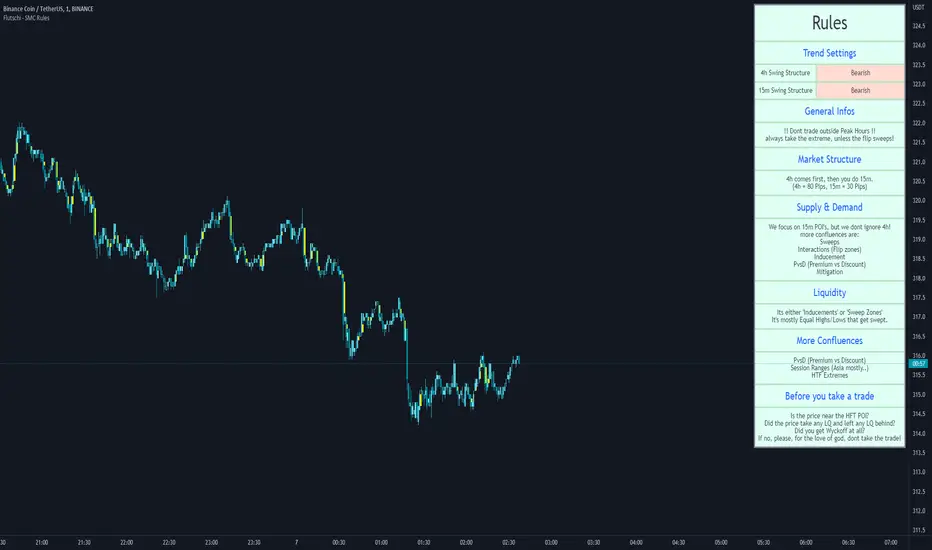
Institutional FVG & Liquidity Range Candle (Expo)█ Institutional FVG with predicted SR levels & Liquidity Range Candle is an indicator that uses Smart Money Concepts to give you the insights needed to make informed decisions based on the theory in SMC. This premium toolkit work in any market and timeframe.
█ Institutional Fair Value Gap , also known as imbalance, inefficiencies, and Liquidity void, identifies the most significant FVG within the lookback period. This is often referred to as Institutional Fair Value Gap since only big players can cause these liquidity voids.
Fair Value Gap, Liquidity voids are sudden price changes without enough liquidity at a stable price, and the price jumps from the originating price level to the final price level, creating an imbalance in price.
The price tends to fill or retest the FVG area, and traders understand at which price level institutional players have been active. FVG is a valuable concept in trading, as they provide insights about where many orders were injected, creating this inefficiency in the market. The price tends to restore the balance.
This indicator highlights the most significant Fair Value Gap on the chart and plots predicted future support and resistance levels based on the price action created at the FVG. A super simple and yet effective way to get solid market levels that acts as a magnet for the price.
█ Liquidity Range Candle is another trading concept used by large market players where they manipulate the price to stay inside a specific market area, creating a tight consolidation zone. Once the price breaks the liquidity range, liquidity flows into the market. It's an easy way to grab liquidity from retail traders. Stop losses are triggers, breakout traders jump into the market, and institutional traders absorb the liquidity.
If you don't see the liquidity, you become the liquidity!
A break of a liquidity range is a sign of a breakout, potential continuation, retracement, or reversal. Use it together with an overall market analysis. It's common that traders also mark the previous 1-3 liquidity ranges and plot them into the future. These zones can act as a future magnet for the price, and we can get a retest of the zones, or if we break above/below a previous range can be a sign of a trend change. We also know that these liquidity ranges have been important levels for institutional players, who may be willing to accumulate or distribute more orders at these levels.
█ HOW TO USE
Use the indicator to identify several important and commonly used trading concepts taught within the SMC.
Find Significant FVG
Find Significant liquidity ranges
-----------------
Disclaimer
Copyright by Zeiierman.
The information contained in my Scripts/Indicators/Ideas/Algos/Systems does not constitute financial advice or a solicitation to buy or sell any securities of any type. I will not accept liability for any loss or damage, including without limitation any loss of profit, which may arise directly or indirectly from the use of or reliance on such information.
All investments involve risk, and the past performance of a security, industry, sector, market, financial product, trading strategy, backtest, or individual’s trading does not guarantee future results or returns. Investors are fully responsible for any investment decisions they make. Such decisions should be based solely on an evaluation of their financial circumstances, investment objectives, risk tolerance, and liquidity needs.
My Scripts/Indicators/Ideas/Algos/Systems are only for educational purposes!
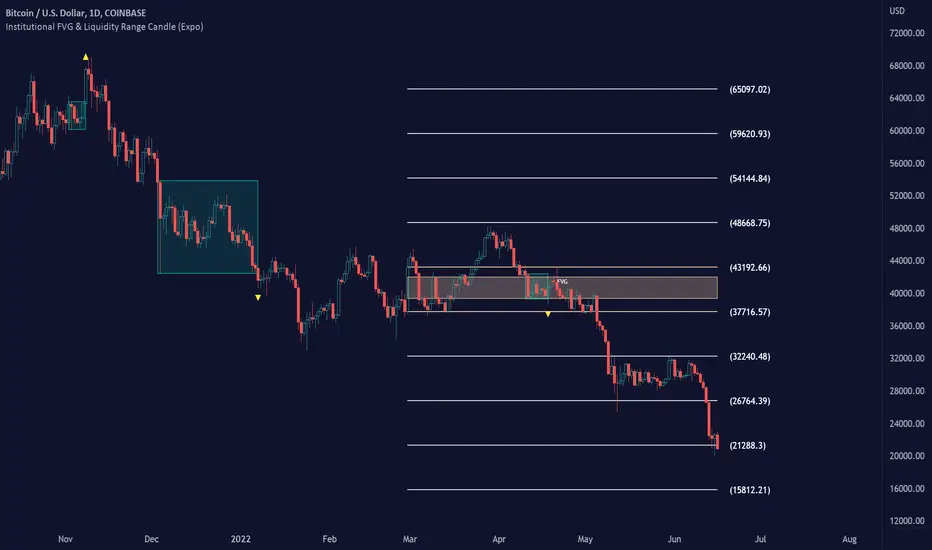
Sonarlab - Smart Money ConceptsSupply and Demand is one of the core strategies used in trading. It focuses on the ancient laws of supply and demand and how price moves in a free-flowing market. Supply and demand zones are a popular analysis technique used in all kinds of trading styles. The zones are the periods of sideways price action that come before explosive price moves, and are typically marked out using a box. We wanted to make these squares drawn automatically for you - so it will save you time spotting the zones.
Green Box
The green box defines demand - in these areas you will look for long opportunities. You can also use these zones for take profit levels when you are in a sell trade.
Blue Box
The blue box defines supply - in these areas you will look for short opportunities. You can also use these zones for take profit levels when you are in a buy trade.
Break of structure
For markets to move up and down a break in market structure must occur. A break in market structure occurs when the market begins to shift direction and break the previous HH and HL or HL and LL of the market. We also integrated the feature that you can see the BOS lines. In the indicator settings you can adjust the values:
1) Sensitivity
2) Min. candles in structure
3) BOS type: close or wick
Warning Never blindly take a position on each box - wait for a proper signal to occur before considering a position.
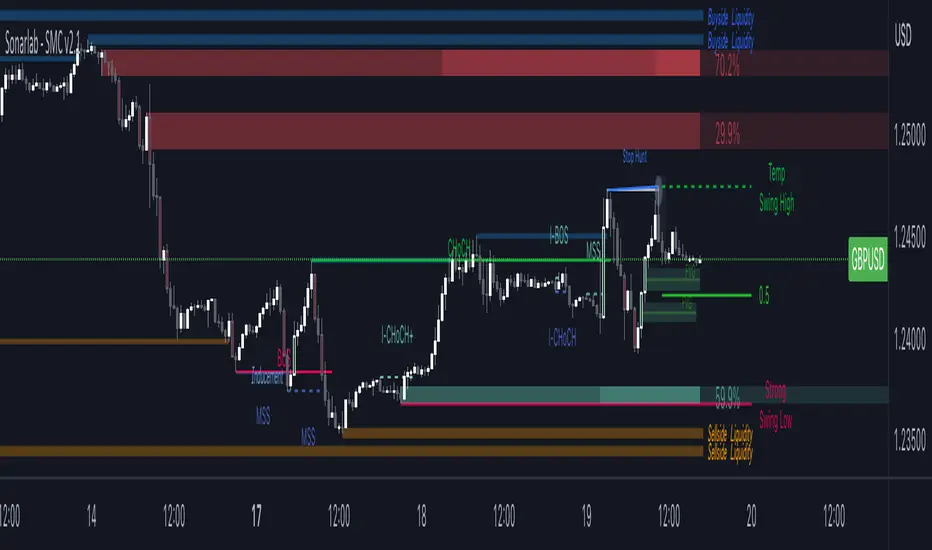
AMD-ImbalanceThis script looks at three consecutive candles and if there is an area between the wicks of the first and third candle, it will paint a box to mark the area.
The marked area is considered an imbalance or inefficiency in the market. Price usually finds its way back to that area of imbalance to clear it.
As price clears part of the area of imbalance, the box turns from a solid border to a dashed border.