SuperTrend + Relative Volume (Kernel Optimized)Introducing our new KDE Optimized Supertrend + Relative Volume Indicator!
This innovative indicator combines the power of the Supertrend indicator along with Relative Volume. It utilizes the Kernel Density Estimation (KDE) to estimate the probability of a candlestick marking a significant trend break or reversal.
❓How to Interpret the KDE %:
The KDE % is a crucial metric that reflects the likelihood that the current candlestick represents a true break in the SuperTrend line, supported by an increase in relative volume. It estimates the probability of a trend shift or continuation based on historical SuperTrend breaks and volume patterns:
Low KDE %: A lower probability that the current break is significant. Price action is less likely to reverse, and the trend may continue.
Moderate KDE - High KDE %: An increased possibility that a trend reversal or consolidation could occur. Traders should start watching for confirmation signals.
📌How Does It Work?
The SuperTrend indicator uses the Average True Range (ATR) to determine the direction of the trend and identifies when the price crosses the SuperTrend line, signaling a potential trend reversal. Here's how the KDE Optimized SuperTrend Indicator works:
SuperTrend Calculation: The SuperTrend indicator is calculated, and when the price breaks above (bullish) or below (bearish) the SuperTrend line, it is logged as a significant event.
Relative Volume: For each break in the SuperTrend line, we calculate the relative volume (current volume vs. the average volume over a defined period). High relative volume can suggest stronger confirmation of the trend break.
KDE Array Calculation: KDE is applied to the break points and relative volume data:
Define the KDE options: Bandwidth, Number of Steps, and Array Range (Array Max - Array Min).
Create a density range array using the defined number of steps, corresponding to potential break points.
Apply a Gaussian kernel function to the break points and volume data to estimate the likelihood of the trend break being significant.
KDE Value and Signal Generation: The KDE array is updated as each break occurs. The KDE % is calculated for the breakout candlestick, representing the likelihood of the trend break being significant. If the KDE value exceeds the defined activation threshold, a darker bullish or bearish arrow is plotted after bar confirmation. If the KDE value falls below the threshold, a more transparent arrow is drawn, indicating a possible but lower probability break.
⚙️Settings:
SuperTrend Settings:
ATR Length: The period over which the Average True Range (ATR) is calculated.
Multiplier: The multiplier applied to the ATR to determine the SuperTrend threshold.
KDE Settings:
Bandwidth: Determines the smoothness of the KDE function and the width of the influence of each break point.
Number of Bins (Steps): Defines the precision of the KDE algorithm, with higher values offering more detailed calculations.
KDE Threshold %: The level at which relative volume is considered significant for confirming a break.
Relative Volume Length: The number of historic candles used in calculating KDE %
Statistics

DCStatCalcs_v0.1DCStatCalcs_v0.1 - Session-Based Statistical Projections
This Pine Script indicator overlays customizable horizontal lines on your chart to visualize a session's opening price and its statistical projections based on historical standard deviation (SD). Designed for traders who want to analyze price behavior within defined time sessions, it calculates and plots the session open price along with optional projection lines at 0.5, 1.0, 1.5, 2.0, and 2.5 standard deviations above and below the open, derived from past session data.
Key Features:
Customizable Sessions: Define your session time (e.g., 0600-1500) and timezone (e.g., America/New_York).
Historical Analysis: Uses a user-specified number of past sessions (default: 20) to compute the standard deviation of price movements relative to the session open.
Projection Lines: Displays toggleable lines at multiple SD levels with adjustable styles, colors, and widths for easy visualization.
Flexible Display: Extend lines beyond the current bar with an offset setting, and adjust label sizes for clarity.
Real-Time Updates: Lines dynamically extend as the session progresses, keeping projections relevant to the current bar.
How It Works:
At the start of each user-defined session, the indicator records the opening price and calculates the SD based on price deviations from the open across historical sessions. It then plots the open price line and, if enabled, projection lines at the specified SD intervals. These lines help traders identify potential support, resistance, or volatility zones based on statistical norms.
Use Case:
Ideal for day traders or analysts working with intraday charts to gauge price ranges and volatility within specific trading sessions, such as market opens or key economic hours.
Published under the Mozilla Public License 2.0. Created by dc_77.

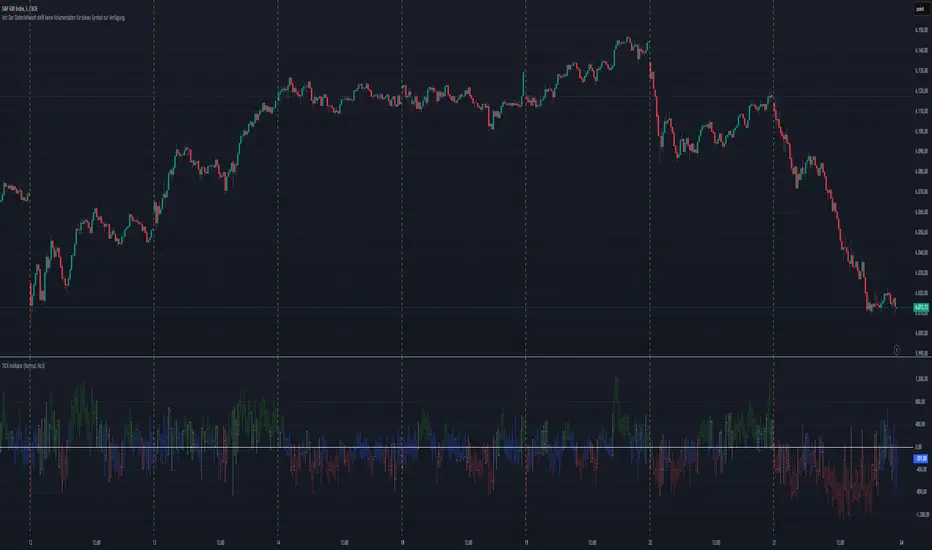
TICK Indikator
English:
The TICK Indicator measures in real time the number of up ticking stocks minus the number of down ticking stocks on the New York Stock Exchange (NYSE). It can display either the current TICK value ("Normal" mode) or the cumulative TICK values over the trading day ("Cumulative" mode). Positive values indicate market strength, while negative values signal weakness. Colored bars visualize momentum: green shades for rising, red for falling values. The zero line acts as a reference between buying and selling pressure.
Interpretation:
> +1000 and/or continuos lows above 0 → strong buying pressure
< -1000 and/or continuos highs below 0 → strong selling pressure
Around 0 → balanced market
Deutsch:
Der TICK Indikator misst in Echtzeit die Anzahl der Aktien, die an der New York Stock Exchange (NYSE) steigen, minus der Anzahl der fallenden Aktien. Der Indikator kann im "Normal"-Modus den aktuellen TICK-Wert anzeigen oder im "Cumulative"-Modus die kumulierten TICK-Werte über den Tag hinweg summieren. Positive Werte deuten auf eine allgemeine Markstärke hin, während negative Werte Schwäche signalisieren. Farbige Balken visualisieren die Dynamik: grüne Töne bei steigenden, rote bei fallenden Werten. Die Nullinie dient als Referenzpunkt zwischen Kauf- und Verkaufsdruck.
Interpretation:
> +1000 und/oder mehrere aufeinander folgende Tiefs über 0 → starker Kaufdruck
< -1000 und/oder mehrere aufeinander folgende Hochs unter 0 → starker Verkaufsdruck
Nahe 0 → ausgeglichener Markt
Price Change IndicatorPrice Change Indicator (PCI)
Version: 1.0
Author: LazyTrader 🚀
🔍 Overview
The Price Change Indicator (PCI) helps traders visualize and compare price changes between the current bar and the previous bar. It provides a customizable display of price changes in two formats:
Percentage (%) Change – Relative price movement.
Natural Change – Absolute difference in price units.
⚙️ Key Features
✅ Customizable Calculation Method: Choose how the price change is calculated:
Opening Price
Closing Price
High
Low
✅ Flexible Display Format:
Show Percentage (%) Change.
Show Natural (Absolute) Change in price.
✅ Adjustable Sensitivity with Multiplier:
100 (Standard Change)
1000 (Small Change)
10000 (Tiny Change)
✅ Intuitive Labeling:
Green label (above bar) for increase.
Red label (below bar) for decrease.
No label if no change.
Large, easy-to-read labels for better visibility.
✅ Perfect for Any Market:
Stocks 📈
Forex 💱
Crypto 🚀
Commodities 🛢️
📊 How It Works
The indicator calculates the difference between the current and previous bar’s price based on your chosen method.
The result is displayed as either a percentage (%) or a natural price change.
If the price has increased, a green label is displayed above the bar.
If the price has decreased, a red label is displayed below the bar.
⚡ How to Use
Add the indicator to your chart.
Go to settings and customize:
Select calculation method (Open, Close, High, Low).
Choose display format (% or Natural Change).
Adjust multiplier for more sensitivity.
Analyze the labels to see price movements easily!
🔧 Settings Explained
Setting Description
Price Calculation Method: Choose Open, Close, High, or Low price for comparison.
Display Format: Show either % Change or Natural Change.
Multiplier: Apply 100, 1000, or 10000 to scale small price changes.
Show Labels: Toggle labels on/off.
🎯 Best Use Cases
🔹 Identifying strong price movements
🔹 Spotting trends and momentum shifts
🔹 Comparing price movement intensity
🔹 Works for scalping, swing trading, and long-term analysis

Uptrick: Alpha TrendIntroduction
Uptrick: Alpha Trend is a comprehensive technical analysis indicator designed to provide traders with detailed insights into market trends, momentum, and risk metrics. It adapts to various trading styles—from quick scalps to longer-term positions—by dynamically adjusting its calculations and visual elements. By combining multiple smoothing techniques, advanced color schemes, and customizable data tables, the indicator offers a holistic view of market behavior.
Originality
The Alpha Trend indicator distinguishes itself by blending established technical concepts with innovative adaptations. It employs three different smoothing techniques tailored to specific trading modes (Scalp, Swing, and Position), and it dynamically adjusts its parameters to match the chosen mode. The indicator also offers a wide range of color palettes and multiple on-screen tables that display key metrics. This unique combination of features, along with its ability to adapt in real time, sets it apart as a versatile tool for both novice and experienced traders.
Features
1. Multi-Mode Trend Line
The indicator automatically selects a smoothing method based on the trading mode:
- Scalp Mode uses the Hull Moving Average (HMA) for rapid responsiveness.
- Swing Mode employs the Exponential Moving Average (EMA) for balanced reactivity.
- Position Mode applies the Weighted Moving Average (WMA) for smoother, long-term trends.
Each method is chosen to best capture the price action dynamics appropriate to the trader’s timeframe.
2. Adaptive Momentum Thresholds
It tracks bullish and bearish momentum with counters that increment as the trend confirms directional movement. When these counters exceed a user-defined threshold, the indicator generates optional buy or sell signals. This approach helps filter out minor fluctuations and highlights significant market moves.
3. Gradient Fills
Two types of fills enhance visual clarity:
- Standard Gradient Fill displays ATR-based zones above and below the trend line, indicating potential bullish and bearish areas.
- Fading Gradient Fill creates a smooth transition between the trend line and the price, visually emphasizing the distance between them.
4. Bar Coloring and Signal Markers
The indicator can color-code bars based on market conditions—bullish, bearish, or neutral—allowing for immediate visual assessment. Additionally, signal markers such as buy and sell arrows are plotted when momentum thresholds are breached.
5. Comprehensive Data Tables
Uptrick: Alpha Trend offers several optional tables for detailed analysis:
- Insider Info: Displays key metrics like the current trend value, bullish/bearish momentum counts, and ATR.
- Indicator Metrics: Lists input settings such as trend length, damping, signal threshold, and net momentum.
- Market Analysis: Summarizes overall trend direction, trend strength, Sortino ratio, return, and volatility.
- Price & Trend Dynamics: Details price deviation from the trend, trend slope, and ATR ratio.
- Momentum & Volatility Insights: Presents RSI, standard deviation (volatility), and net momentum.
- Performance & Acceleration Metrics: Focuses on the Sortino ratio, trend acceleration, return, and trend strength.
Each table can be positioned flexibly on the chart, allowing traders to customize the layout according to their needs.
Why It Combines Specific Smoothing Techniques
Smoothing techniques are essential for filtering out market noise and revealing underlying trends. The indicator combines three smoothing methods for the following reasons:
- The Hull Moving Average (HMA) in Scalp Mode minimizes lag and responds quickly to price changes, which is critical for short-term trading.
- The Exponential Moving Average (EMA) in Swing Mode gives more weight to recent data, striking a balance between speed and smoothness. This makes it suitable for mid-term trend analysis.
- The Weighted Moving Average (WMA) in Position Mode smooths out short-term fluctuations, offering a clear view of longer-term trends and reducing the impact of transient market volatility.
By using these specific methods in their respective trading modes, the indicator ensures that the trend line is appropriately responsive for the intended time frame, enhancing decision-making while maintaining clarity.
Inputs
1. Trend Length (Default: 30)
Defines the lookback period for the smoothing calculation. A shorter trend length results in a more responsive line, while a longer length produces a smoother, less volatile trend.
2. Trend Damping (Default: 0.75)
Controls the degree of smoothing applied to the trend line. Lower values lead to a smoother curve, whereas higher values increase sensitivity to price fluctuations.
3. Signal Strength Threshold (Default: 5)
Specifies the number of consecutive bullish or bearish bars required to trigger a signal. Higher thresholds reduce the frequency of signals, focusing on stronger moves.
4. Enable Bar Coloring (Default: True)
Toggles whether each price bar is colored to indicate bullish, bearish, or neutral conditions.
5. Enable Signals (Default: True)
When enabled, this option plots buy or sell arrows on the chart once the momentum thresholds are met.
6. Enable Standard Gradient Fill (Default: False)
Activates ATR-based gradient fills around the trend line to visualize potential support and resistance zones.
7. Enable Fading Gradient Fill (Default: True)
Draws a gradual color transition between the trend line and the current price, emphasizing their divergence.
8. Trading Mode (Options: Scalp, Swing, Position)
Determines which smoothing method and ATR period to use, adapting the indicator’s behavior to short-term, medium-term, or long-term trading.
9. Table Position Inputs
Allows users to select from nine possible chart positions (top, middle, bottom; left, center, right) for each data table.
10. Show Table Booleans
Separate toggles control the display of each table (Insider Info, Indicator Metrics, Market Analysis, and the three Deep Tables), enabling a customized view of the data.
Color Schemes
(Default) - The colors in the preview image of the indicator.
(Emerald)
(Sapphire)
(Golden Blaze)
(Mystic)
(Monochrome)
(Pastel)
(Vibrant)
(Earth)
(Neon)
Calculations
1. Trend Line Methods
- Scalp Mode: Utilizes the Hull Moving Average (HMA), which computes two weighted moving averages (one at half the length and one at full length), subtracts them, and then applies a final weighted average based on the square root of the length. This method minimizes lag and increases responsiveness.
- Swing Mode: Uses the Exponential Moving Average (EMA), which assigns greater weight to recent prices, thus balancing quick reaction with smoothness.
- Position Mode: Applies the Weighted Moving Average (WMA) to focus on longer-term trends by emphasizing the entire lookback period and reducing the impact of short-term volatility.
2. Momentum Tracking
The indicator maintains separate counters for bullish and bearish momentum. These counters increase as the trend confirms directional movement and reset when the trend reverses. When a counter exceeds the defined signal strength threshold, a corresponding signal (buy or sell) is triggered.
3. Volatility and ATR Zones
The Average True Range (ATR) is calculated using a period that adapts to the selected trading mode (shorter for Scalp, longer for Position). The ATR value is then used to define upper and lower zones around the trend line, highlighting the current level of market volatility.
4. Return and Trend Acceleration
- Return is calculated as the difference between the current and previous closing prices, providing a simple measure of price change.
- Trend Acceleration is derived from the change in the trend line’s movement (its first derivative) compared to the previous bar. This metric indicates whether the trend is gaining or losing momentum.
5. Sortino Ratio and Standard Deviation
- The Sortino Ratio measures risk-adjusted performance by comparing returns to downside volatility (only considering negative price changes).
- Standard Deviation is computed over the lookback period to assess the extent of price fluctuations, offering insights into market stability.
Usage
This indicator is suitable for various time frames and market instruments. Traders can enable or disable specific visual elements such as gradient fills, bar coloring, and signal markers based on their preference. For a minimalist approach, one might choose to display only the primary trend line. For a deeper analysis, enabling multiple tables can provide extensive data on momentum, volatility, trend dynamics, and risk metrics.
Important Note on Risk
Trading involves inherent risk, and no indicator can eliminate the uncertainty of the markets. Past performance is not indicative of future results. It is essential to use proper risk management, test any new tool thoroughly, and consult multiple sources or professional advice before making trading decisions.
Conclusion
Uptrick: Alpha Trend unifies a diverse set of calculations, adaptive smoothing techniques, and customizable visual elements into one powerful tool. By combining the Hull, Exponential, and Weighted Moving Averages, the indicator is able to provide a trend line that is both responsive and smooth, depending on the trading mode. Its advanced color schemes, gradient fills, and detailed data tables deliver a comprehensive analysis of market trends, momentum, and risk. Whether you are a short-term trader or a long-term investor, this indicator aims to clarify price action and assist you in making more informed trading decisions.

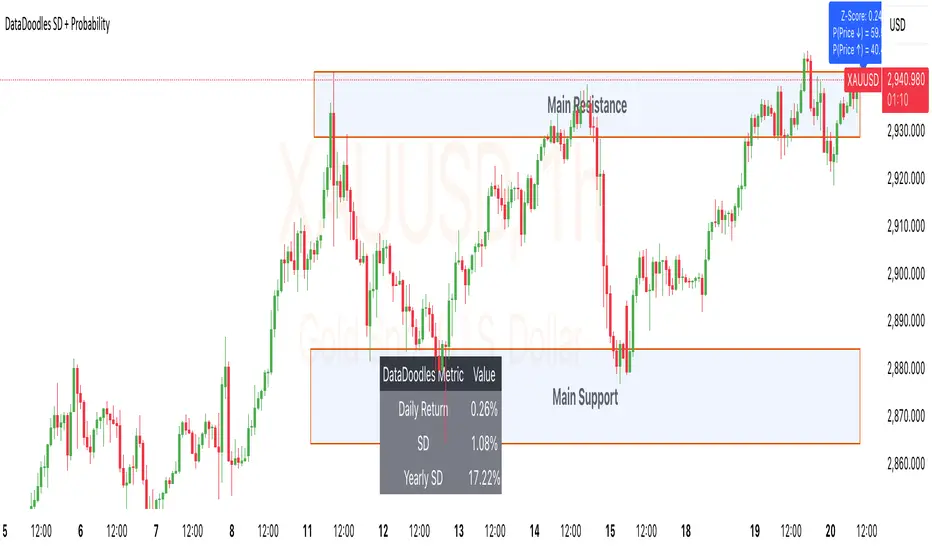
DataDoodles SD + ProbabilityDataDoodles SD + Probability
Overview:
The “DataDoodles SD + Probability” indicator is designed to provide traders with a statistical edge by leveraging standard deviation and probability metrics. This advanced tool calculates the annualized standard deviation, Z-score, and probability of price movements, offering insights into potential market direction with customizable alert thresholds.
Key Features:
1. Annualized Standard Deviation (Volatility) Calculation:
• Uses a user-defined period to compute the rolling standard deviation of daily returns.
• Annualizes the volatility, giving a clear picture of expected price fluctuations.
2. Probability of Price Movement:
• Calculates the probability of price moving up or down using a corrected Z-Score.
• Displays the probability percentage for both upward and downward movements.
3. Dynamic Alerts:
• Configurable alerts for upward and downward price movement probabilities.
• Receive alerts when the probability exceeds user-defined thresholds.
4. Projections and Visuals:
• Plots projected high and low price levels based on annualized volatility.
• Displays Z-Score and probability metrics on the chart for quick reference.
5. Comprehensive Data Table:
• Bottom-center table displays key metrics:
• Daily Return
• Standard Deviation (SD)
• Annualized Standard Deviation (Yearly SD)
User Inputs:
• Annualization Period: Set the time frame for volatility annualization (Default: 252 days).
• SD Period: Define the rolling window for calculating standard deviation (Default: 252 days).
• Alert Probability Up/Down: Customize the probability thresholds for alerts (Default: 90%).
How It Works:
• Data Request and Calculation:
• Uses daily close prices to ensure consistent timeframe calculations.
• Calculates daily returns and annualizes the volatility using the square root of the time frame.
• Probability Computation:
• Employs a normal distribution CDF approximation to compute the probability of upward and downward price movements.
• Adjusts probabilities based on Z-Score to ensure accuracy.
• High and Low Projections:
• Utilizes the annualized volatility to estimate high and low price projections for the year.
• Visual Indicators and Alerts:
• Plots projected high (green) and low (red) levels on the chart.
• Displays Z-Score, probability percentages, and dynamically updates a statistics table.
Use Cases:
• Trend Analysis: Identify high-probability market movements using the probability metrics.
• Volatility Insights: Understand annualized volatility to gauge market risk and potential price ranges.
• Strategic Trading Decisions: Set alerts for high-probability scenarios to optimize entry and exit points.
Why Use “DataDoodles SD + Probability”?
This indicator provides a powerful combination of statistical analysis and visual representation. It empowers traders with:
• Quantitative Edge: By leveraging probability metrics and standard deviation, users can make informed trading decisions.
• Risk Management: Annualized volatility projections help in setting realistic stop-loss and take-profit levels.
• Actionable Alerts: Customizable probability alerts ensure users are notified of potential market moves, allowing proactive trading strategies.
Recommended Settings:
• Annualization Period: 252 (Ideal for daily data representing a trading year)
• SD Period: 252 (One trading year for consistent volatility calculations)
• Alert Probability: Set to 90% for conservative signals or lower for more frequent alerts.
Final Thoughts:
The “DataDoodles SD + Probability” indicator is a robust tool for traders looking to integrate statistical analysis into their trading strategies. It combines volatility measurement, probability calculations, and dynamic alerts to provide a comprehensive market overview.
Whether you’re a day trader or a long-term investor, this indicator can enhance your market insight and improve decision-making accuracy.
Disclaimer:
This indicator is a technical analysis tool designed for educational purposes. Past performance is not indicative of future results. Traders are encouraged to perform their own analysis and manage risk accordingly.
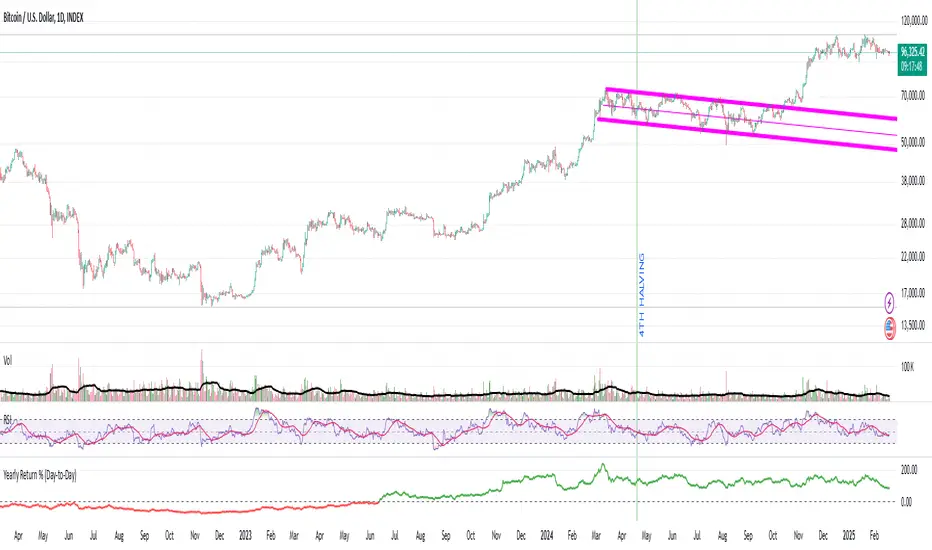
Yearly Return % (Day-to-Day)How It Works:
It fetches the closing price from one year ago (using request.security with a daily lookback).
It calculates the percentage return relative to today’s closing price.
It plots the result in a separate pane.
Features:
Works on any timeframe but is more useful on daily or higher.
Automatically adjusts for different assets.
Zero Line for quick reference.
Clean, simple display without clutter.
TPO IQ [TradingIQ]Hello Traders!
Introducing "TPO IQ"!
TPO IQ offers a Time Price Opportunity profile with several customization options that packs several related features to help traders navigate the generated profiles!
Features
TPO Profiles
Single Print identification
Initial Balance Identification
Can be anchored to timeframe change
Can be anchored to fixed time interval
Last profile detailed visuals
Customizable value area percentage
POC identification
Mid-point identification
TPO Profiles
A TPO profile is a market profile visualization that details how much time was spent at each price level throughout the time interval.
The image above further explains what a TPO Profile is!
Each letter corresponds to a candlestick. With this information, traders are able to visualize how much time was spent at each price area.
With customizable gradient colors, specifically in this example, blocks colored red are the earliest times in the profile, blocks colored green are in the beginning half of the time midpoint of the profile. Blue blocks represent the first half of the end of the time period, and purple blocks correspond to the end of the time period.
Please note that this form of TPO profile generation will only occur when the most recent profile uses less than 500 alphabet characters! If more than 500 characters are preset, TPO IQ will revert to using labels!
Initial Balance
TPO IQ also identifies the initial balance range and all alphabet characters that form within it!
The image above exemplifies this feature. The initial balance range is denoted by a a neon-blue line, with a blue circle showing the opening price. All characters within the initial balance range are highlighted blue, which is a feature that can be disabled with customizable colors.
POC
TPO IQ also identifies the point of control (POC) of the TPO Profile.
The point of control for the profile is labeled yellow by default, and shows where price spent the most time throughout the time period.
The image above shows the POC for the time period being identified by TPO IQ.
Value Area
TPO IQ also identifies the value area of the profile. A customizable percentage that is 70% by default, the value area of a TPO profile shows where price traded the majority of the time.
The image above further explains this feature. For this example, with the value area percentage being set to 70%, the value area high and value area low show the price zone that prices traded at 70% of the time throughout the profile.
TPO Midpoint
In addition to the POC, the TPO profile midpoint is also identified by TPO IQ.
The TPO midpoint simply corresponds to the middle price between the session's high and low!
Fixed Interval Mode
By default, TPO IQ recalculates every day, but this can also be changed to a customizable session time, such as 4 hours. If 4 hours is selected, then a new TPO profile will be generated every 4 hours.
However, in Fixed Interval mode, a TPO profile will be generated through a user-defined time range, such as 1300-1700.
In the image above, Fixed Interval mode is applied with a time range of 1300-1700 and, consequently, TPO IQ generates a new profile throughout every 1300-1700 time range!
This feature allows traders to specify time ranges of interest to generate TPO profiles for!
TPO Overview Label
The TPO overview label shows key statistics for the TPO profile generated throughout the trading session!
The "TPO Count" statistic shows how many alphabetical letters were generated for the profile, which is an adequate method to determine the session's volatility and price range.
The "Tick Levels" statistic shows how many tick levels were used to create the profile - another method to determine the volatility and price range of the session.
The "Top Letter" statistic shows which letter appears most throughout the profile. In this example, the top letter was "f", which means throughout creation of the profile, the letter "f" appeared the most!
And that's all for now!
If you have any feedback or new feature ideas for TPO IQ please feel free to share them with us!
Thank you traders!

Enhanced Interval Candle with Breakout Detection and Detailed InThis indicator visualizes the last candle of a user-defined time interval (e.g., 1 hour, 4 hours, 1 day) on the current chart, providing enhanced details and breakout detection. It fetches the open, high, low, and close prices of the interval candle and draws a stylized representation of it, offset to the right of the current bar. The candle body and wicks are colored according to whether the interval candle closed bullishly (green) or bearishly (red). In addition to the candle itself, the indicator displays horizontal dotted lines representing the high, low, and midpoint of the interval candle, along with labels showing their exact values. These labels are dynamically updated as the interval candle changes. Furthermore, the script detects and visualizes breakouts of the interval candle's high or low. When the current price closes above the interval high, a green dashed line and a "Bullish Breakout" label are displayed. Conversely, when the current price closes below the interval low, a red dashed line and a "Bearish Breakout" label are shown. The breakout lines and labels are also dynamically updated. This indicator helps traders easily track the price action of a higher timeframe candle and spot potential breakouts based on that candle's range. The user can configure the time interval to suit their trading needs.

Footprint IQ Pro [TradingIQ]Hello Traders!
Introducing "Footprint IQ Pro"!
Footprint IQ Pro is an all-in-one Footprint indicator with several unique features.
Features
Calculated delta at tick level
Calculated delta ratio at tick level
Calculated buy volume at tick level
Calculated sell volume at tick level
Imbalance detection
Stacked imbalance detection
Stacked imbalance alerts
Value area and POC detection
Highest +net delta levels detection
Lowest -net delta levels detection
CVD by tick levels
Customizable values area percentage
The image above thoroughly outlines what each metric in the delta boxes shows!
Metrics In Delta Boxes
"δ:", " δ%:", " ⧎: ", " ◭: ", " ⧩: "
δ Delta (Difference between buy and sell volume)
δ% Delta Ratio (Delta as a percentage of total volume)
⧎ Total Volume At Level (Total volume at the price area)
◭ Total Buy Volume At Level (Total buy volume at the price area)
⧩ Total Sell Volume At Level (total sell volume at the price area)
Each metric comes with a corresponding symbol.
That said, until you become comfortable with the symbol, you can also turn on the descriptive labels setting!
The image above exemplifies the feature.
The image above shows Footprint IQ's full power!
Additionally, traders with an upgraded TradingView plan can make use of the "1-Second" feature Footprint IQ offers!
The image above shows each footprint generated using 1-second volume data. 1-second data is highly granular compared to 1-minute data and, consequently, each footprint is exceptionally more accurate!
Imbalance Detection
Footprint IQ pro is capable of detecting user-defined delta imbalances.
The image above further explains how Footprint IQ detects imbalances!
The imbalance percentage is customizable in the settings, and is set to 70% by default.
Therefore,
When net delta is positive, and the positive net delta constitutes >=70% of the total volume, a buying imbalance will be detected (upwards triangle).
When net delta is negative, and the negative net delta constitutes >=70% of the total volume, a buying imbalance will be detected (downwards triangle).
Stacked Imbalance Detection
In addition to imbalance detection, Footprint IQ Pro can also detect stacked imbalances!
The image above shows Footprint IQ Pro detecting stacked imbalances!
Stacked imbalances occur when consecutive imbalances at sequential price areas occur. Stacked imbalances are generally interpreted as significant price moves that are supported by volume, rather than a significant result with disproportionate effort.
The criteria for stacked imbalance detection (how many imbalances must occur at sequential price areas) is customizable in the settings.
The default value is three. Therefore, when three imbalances occur at sequential price areas, golden triangles will begin to print to show a stacked imbalance.
Additionally, traders can set alerts for when stacked imbalances occur!
Highest +Delta and Highest -Delta Levels
In addition to being a fully-fledged Footprint indicator, Footprint IQ Pro goes one step further by detecting price areas where the greater +Delta and -Delta are!
The image above shows price behavior near highest +Delta price areas detected by Footprint IQ!
These +Delta levels are considered important as there has been strong interest from buyers at these price areas when they are traded at.
It's expected that these levels can function as support points that are supported by volume.
The image above shows a similar function for resistance points!
Blue lines = High +Delta Detected Price Areas
Red lines = High -Delta Detected Price Areas
Value Area Detection
Similar to traditional volume profile, Footprint IQ Pro displays the value area per bar.
Green lines next to each footprint show the value area for the bar. The value area % is customizable in the settings.
CVD Levels
Footprint IQ Pro is capable of storing historical volume delta information to provide CVD measurements at each price area!
The image above exemplifies this feature!
When this feature is enabled, you will see the CVD of each price area, rather than the net delta!
And that's it!
Thank you so much to TradingView for offering the greatest charting platform for everyone to create on!
If you have any feature requests you'd like to see for Footprint IQ, please feel free to share them with us!
Thank you!

Candle Partition Statistics with IQV and Chi2NOTE: THE FORMULA IN THE CHART IS NOT PART OF THE CODE
This Pine Script calculates statistical measures for candle partitions based on whether a candle is bullish or bearish and whether the price is above or below an EMA. It evaluates statistical properties such as the Index of Qualitative Variation (IQV) and the Chi-Square (χ²) statistic to assess variations in price action.
Concept of Index of Qualitative Variation (IQV)
IQV is a statistical measure used to quantify the diversity or dispersion of categorical variables. In this script, it is used to measure how evenly the four categories of candles (green above EMA, red above EMA, green below EMA, red below EMA) are distributed.
Purpose of IQV in the Script:
IQV ranges from 0 to 1, where 0 indicates no variation (one category dominates) and 1 indicates maximum variation (categories are equally distributed).
A high IQV suggests balanced distributions of bullish/bearish candles above/below the EMA, indicating market uncertainty or mixed sentiment.
A low IQV suggests dominance of a particular candle type, indicating a strong trend.
Concept of Chi-Square (χ²) Test
Chi-square (χ²) is a statistical test that measures the difference between expected and observed frequencies of categorical data. It assesses whether short-term price behavior significantly deviates from historical trends.
Purpose of Chi-Square in the Script:
A high χ² value means that short-term candle distributions are significantly different from historical patterns, indicating potential trend shifts.
If χ² exceeds a predefined significance threshold (chi_threshold), an alert (Chi² Alert!) is triggered.
It helps traders identify periods where recent price behavior deviates from historical norms, possibly signaling trend reversals or market regime changes.
Key Takeaways:
IQV helps measure the diversity of price action, detecting whether the market is balanced or trending.
Chi-square (χ²) identifies significant deviations in short-term price behavior compared to long-term trends.
Both metrics together provide insights into whether the market is stable, trending, or shifting.
The Nasan C-score enhances trend strength by incorporating volatility. It is calculated as:
enhanced_t_s =(𝑡𝑠 × avg_movement x 100)/SMA(𝑐lose)
Key Components:
𝑡𝑠 : Measures trend strength based on price movements relative to EMA.
ts=green_EMAup_a+0.5×red_EMAup_a−(0.5×green_EMAdown_a+red_EMAdown_a)
avg_movement: The SMA of absolute close-open differences, capturing volatility.
Normalization: The division by SMA(close) adjusts the score relative to price levels.
Purpose of the Nasan C-score
Enhanced Trend Strength
It amplifies the trend strength value by factoring in volatility (price movement).
If price volatility is high, trend strength variations have a greater impact.
Volatility-Adjusted Momentum
By scaling 𝑡𝑠 with average movement, the score adjusts to changing price dynamics.
Higher price fluctuations lead to a higher score, making trend shifts more prominent.
How It Can Be Used in Trading
Higher values of Nasan C-score indicate strong bullish or bearish trends.
Comparing it with past values helps determine whether momentum is increasing or fading.
Thresholds can be set to identify significant trend shifts based on historical highs and lows.

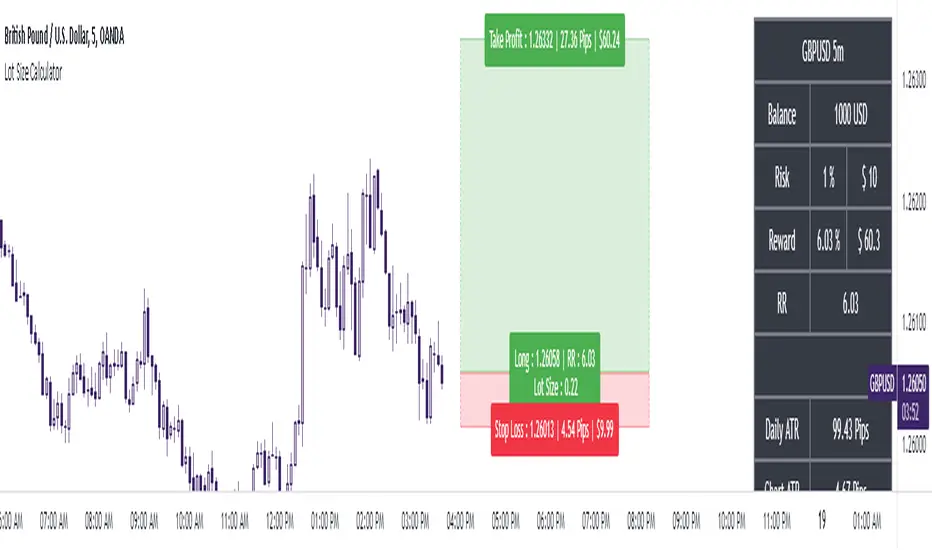
The Ultimate Lot Size Calculator Backstory
I created this Pine Script tool to calculate lot sizes with precision. While there are many lot size calculators available on TradingView, I found that most had significant flaws. I started teaching myself Pine Script over three and a half years ago with the sole purpose of building this tool. My first version was messy and lacked accuracy, so I never published it. I wanted it to be better than any other available tool, but my limited knowledge back then held me back.
Recently, I received a request to create a similar tool, as the current options still fail to deliver the precision and reliability traders need. This inspired me to revisit my original idea. With improved skills and a better understanding of Pine Script, I redesigned the tool from scratch, making it as precise, reliable, and efficient as possible.
This tool features built-in error detection to minimize mistakes and ensure accuracy in lot size calculations. I've spent more time on this project than on any other, focusing on delivering a solution that stands out on TradingView. While I plan to add more features based on user feedback, the current version is already a powerful, dependable, and easy-to-use tool for traders who value precision and efficiency in their lot size calculations.
How to use the tool ?
At first it might seem complicated, but it is quite easy to use the tool. There are two modes: auto and manual. By default, the tool is set on manual mode. When you apply the tool on the chart, it will ask you to choose the entry price, then the stop-loss price, and at last the take-profit price. Select all of them one by one. These values can be changed later.
Settings
There are various setting given for making the tool as flexible as possible. Here is the explanation for some of most important settings. Play with them and make yourself comfortable.
General settings
Auto mode : Use this mode if you want the the risk reward to be fixed and stop loss to be based on ATR. However the stop loss can be changed to be based on user input.
Manual mode : Use this mode if you want full control over entry, stop loss and take profit.
Contract Size : The tool works perfectly for all forex pairs including gold and silver but as the contract size is different for different assets it is difficult to add every single asset into the script manually so i have provided this option. In case you want to calculate lot size for a asset other then forex, gold or silver make sure to change this. Contract size = Quantity of the asset in 1 standerd lot.
Account settings
Automatic mode settings and ATR stop settings
Manual mode settings
Table and risk-reward box settings are pretty much self-explanatory i guess.
Error handling
A lot size calculator is a complex program. There are numerous points where it may fail and produce incorrect results. To make it robust and accurate, these issues must be addressed and managed properly, which practically all existing lot size calculator scripts fail to do.
Golden tip
When the symbol is changed it will display a symbol change warning as the entry, stop loss and take profit price won't change.
There are 2 ways to get fix this. Either manually enter all three values which i hate the most or remove the script from the chart and re-apply the script on chart again.
So to re-apply the indicator in most easy way follow the following instructions:
Note : If you encounter any other error then read the instruction to fix it and if it is an unknow error pleas report it to me in comments or DM.
Static price-range projection by symbolThis indicator shows you a predefined range to the right of the last candle of your chart. This range is custom and can be changed for a handful of symbols that you can choose. This scale will help you determining if the market is providing a reasonable range before you enter a trade or if the market isn't actually moving as much as you might think. This is particularly useful if you are into scalping and have to consider commission or spread in your trades.
Since all symbols have different price ranges in which they move this indicator doesn't make sense to just have "a one size fits all" approach. That's why you can choose up to 6 symbols and set the range that you want to have shown for each when you pull it up on the chart. Using my default values that means for when the NQ (Nasdaq future) is on the chart you will see a range of 20 handles projected. When you change the the ES (S&P500 future) you will instead see 5 handles. While the number is different that is somewhat of an equal move in both symbols.
There also is an option to set a default price range for all other symbols that are not selected if it is needed. However the display of the scale on anything else than the 6 selected symbols can also be turned off.
There are options provided on how exactly you want to indicator to determine if the chart symbol matches one of the selected symbols.
You can enable it to make sure the exchange/broker is the exact same as selected.
It can check for only the symbol root to match the selection. Specifically for futures this means that while ES1! might be selected, anything ES (ES1!, ES2!, ESH2025, ESM2025, ESM2022, ...) will be a match to the selection)
On the painted scale it is possible to not just show this range extended into each direction once. Per default you will have 3 segments of it in each direction. This can be reduced to just 1 or increased.
If you chose a high number of segments or a large range make sure to use the "Scale price chart only" option on your chart scale to not have the symbols price candles squished together by the charts auto scaling.
And last but not least the indicator options provide some possibilities to change the appearance of the printed price range scale in case you disagree with my design.

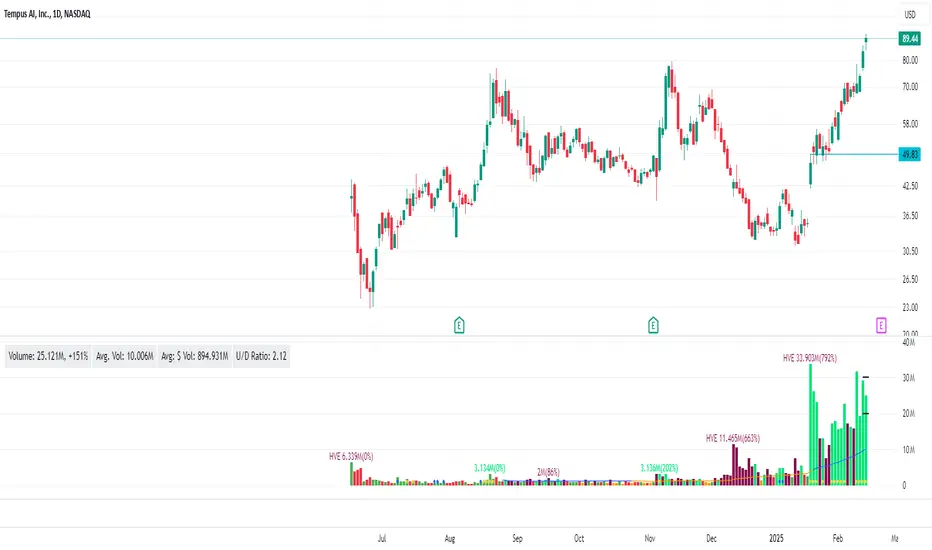
IPO Date ScreenerThis script, the IPO Date Screener, allows traders to visually identify stocks that are relatively new, based on the number of bars (days) since their IPO. The user can set a custom threshold for the number of days (bars) after the IPO, and the script will highlight new stocks that fall below that threshold.
Key Features:
Customizable IPO Days Threshold: Set the threshold for considering a stock as "new." Since Pine screener limits number bars to 500, it will work for stocks having trading days below 500 since IPO which almost 2 years.
Column Days since IPO: Sort this column from low to high to see newest to oldest STOCK with 500 days of trading.
Since a watchlist is limited to 1000 stocks, use this pines script to screen stocks within the watch list having trading days below 500 or user can select lower number of days from settings.
This is not helpful to add on chart, this is to use on pine screener as utility.
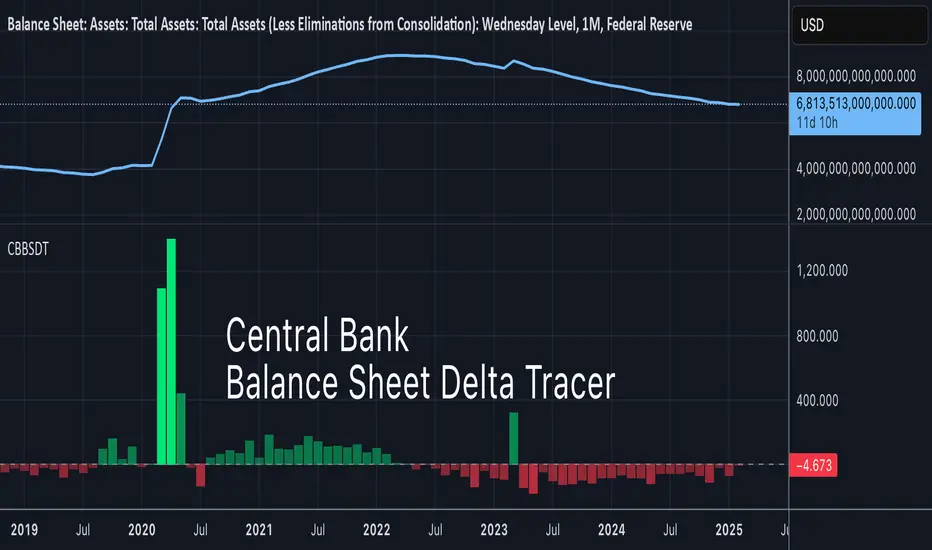
Central Bank BS Delta TracerCentral Bank BS Delta Tracer is a new way of looking at liquidity on TradingView.
CBBSDT (for short) shows bars for popular central bank balance sheets. The default is the US, but other countries can be viewed or compared as well.
You can combine multiple central bank balances, and all are calculated in USD using currency pairs so that the units match up. Combining can also show differentials, such as if the ECB did more QT than the US in a given time frame.
Warning: Time frames lower than a month may be inaccurate. Many central banks do not report their BS on a frequent basis, so do know ahead of time that data is usually outdated by a variable amount depending on the data source. Check with the particular sources of central bank BS before making assumptions about deltas using this indicator.
Debt is the dark energy of the economy. Therefore we must know how much of it is pumping or draining.
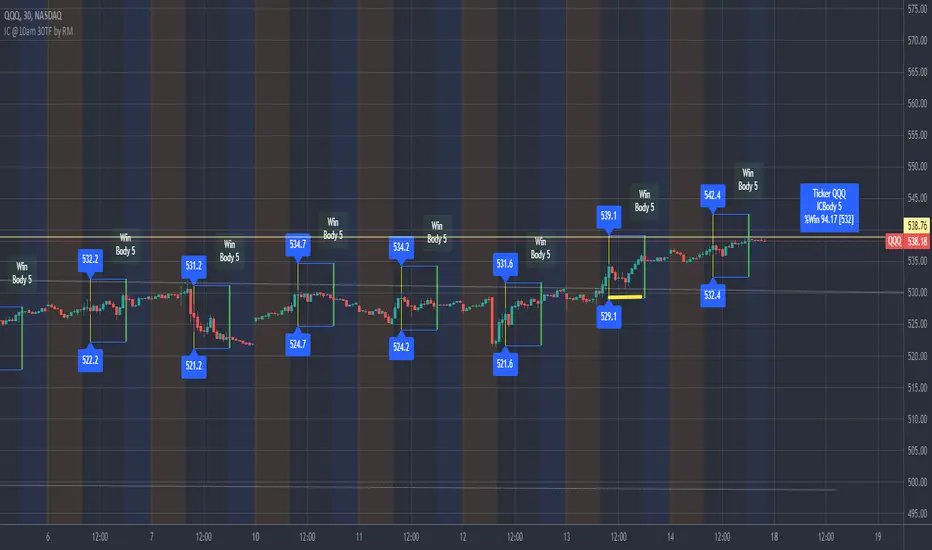
IronCondor 10am 30TF by RMThe IronCondor 10am 30TF indicator shows Iron Condor trades win rate over a large number of days.
The default ETFs in this indicators are "QQQ", "SPY", "RUT" , "CBTX" and "SPX", other entries have not been tested.
Iron Condor quick explanation:
- Iron Condors trades have four options, generally, are based around a Midpoint price (Current Market Price Strike) and
- Two equally distances Strikes for the SELL components (called the Body of the Iron Condor)
- Further away from the two SELLs, another Two BUYs for protection (not considered in this indicator)
- Iron Condors are used for Passive Income based on small gains most of the time.
The IronCondor 10am 30TF has its logic created based on the premises that:
- Most days the market prices stay within a range.
- As example the S&P market prices would stay within 1% on about 80% of the time
- The moving markets (bullish or bearish) occur about 20% of the time
- The biggest market price volatility generally occurs before market opens and then around the first hour or so of trade in the day.
- After the first hour or so of the market the prices would be most likely to stay within a range.
The operation is simple:
- At the Trade Star time in the day (say 10:30 Hrs.) draws a vertical yellow line, then
- Creates two blue horizontal lines for the SELL limits in the Iron Condor Body, at +/- 1% price boundary (check Ticker list below for values)
- At the Trade End time (say 16:00 Hrs.) checks that none of the SELL limits have been broken by highs or lows during the trade day
(The check is done calculating at Trade End time the high/lows 10 bars back for 30 min TF - timeframe)
- There is a label at each Trade End time with Win/Loss and Body value.
- There is one final label with overall calculated past performance in Win percentage out of 'n' trades
Defaults and User Entries:
- The User can modify the Midpoint price called 'IronCondor Midpoint STRIKE' (default is the Candle Close at the selected time)
- The User can modify the Body value called 'IronCondor Body' (default is the Ticker's selected value as per list below)
"QQQ" or "SPY" Body = 5
"RUT" or "CBTX" Body = 20
"SPX" Body = 60
* Disclaimer: This is not a Financial tool, it cannot used as any kind of advice to invest or risk moneys in any market,
Markets are volatile in nature - with little or no warning - and will drain your account if you are not careful.
Use only as an academic demonstrator => * Use at your own risk *
Broad Market MOEX non normalazeBroad Market MOEX - Relative Strength Indicator for MOEX Stocks
This indicator allows you to compare the price dynamics of major Moscow Exchange stocks relative to the selected asset during the trading session.
Features:
• Tracks 10 key MOEX stocks: Sberbank, Rosneft, Lukoil, Gazprom Neft, NOVATEK, Nornickel, Polyus, Tatneft, Surgutneftegas, Severstal
• Shows the percentage price change of each stock relative to the base price at the start of trading (default 9:00 MSK)
• Allows you to customize the base time for reference
• Clearly displays the strength and weakness of individual stocks relative to each other
• Helps identify leaders and laggards during the trading session
How to use:
1. Add the indicator to any MOEX stock chart
2. Adjust the base time if needed (default 9:00)
3. Monitor the relative dynamics of stocks
4. Use for:
- Finding strong/weak stocks
- Identifying sector rotation
- Intraday trading
- Correlation analysis
Color coding of lines helps easily identify each stock on the chart.
The indicator is useful for intraday traders and anyone monitoring the relative strength of stocks on the Moscow Exchange.

US vs EU Interest Rate SpreadThis script plots the difference (Spread) between the US-Interest Rate (Symbol USINTR) and the EU Interest Rate (Symbol: EUINTR) and plots it in a seperate pane. Areas where the background is green are times were the spread was positive (US interest rate higher than EU interest rate), a red background indicates a higher EU interest rate than US interest rate.

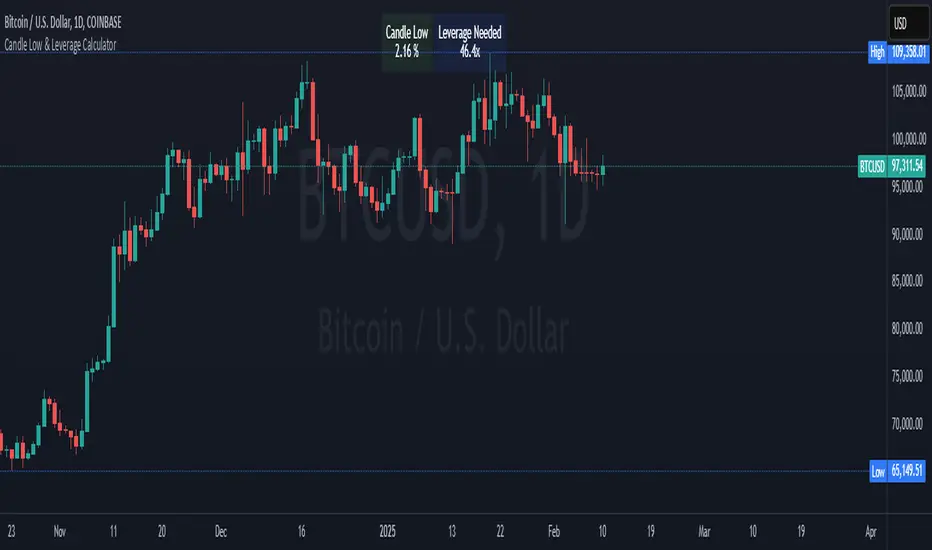
Crypto Candle Low Leverage TrackerCrypto Candle Low Leverage Tracker
The Candle Low Leverage Indicator is a powerful tool for long position traders seeking to manage risk effectively when using leverage. By evaluating the current candle's low price, this indicator helps traders make more informed decisions about potential entry points, stop losses, and leverage levels. The indicator matches the low of the candle to the leverage needed for liquidation, giving you a clear view of how leverage impacts your position.
This indicator provides two critical insights:
% from Candle Low: Tracks how much the price has moved from the low of the current candle. For long position traders, this percentage is crucial for understanding how far the price has come off the low and deciding whether it’s safe to enter a position or if further price action is needed.
Leverage Needed: Estimates the leverage required to reach the candle's low as the liquidation price. Long traders can use this information to adjust leverage to a safer level, ensuring they don’t overexpose themselves to liquidation risks by matching leverage to the candle’s low.
Key Features:
Customizable table positioning (top, middle, bottom).
Toggle options to show/hide % from Candle Low and Leverage Needed.
Visual indicators with color changes: green for positive change, red for negative change, and blue for leverage requirements.
Ideal for long traders, this tool helps evaluate market conditions, manage risks, and calculate the best leverage to use in long trades, ensuring that leverage aligns with the candle’s low to prevent unnecessary liquidations.
Gap Detection Indicator V.1This indicator is designed to detect gaps between candles on the chart. It detects all gaps that are higher than the specified percentage setting, draws a line passing through only the starting and ending points of the last gap, and paints between these lines.
If any candle closes above the gap starting level, the lines between the lines are colored green; If any candle closes below the gap starting level, the lines between the lines are colored red.
UPDATE1:
In addition, two more gap levels were added. A date range was added to enable control within the specified date range.

Triad Trade MatrixOverview
Triad Trade Matrix is an advanced multi-strategy indicator built using Pine Script v5. It is designed to simultaneously track and display key trading metrics for three distinct trading styles on a single chart:
Swing Trading (Swing Supreme):
This mode captures longer-term trends and is designed for trades that typically span several days. It uses customizable depth and deviation parameters to determine swing signals.
Day Trading (Day Blaze):
This mode focuses on intraday price movements. It generates signals that are intended to be executed within a single trading session. The parameters for depth and deviation are tuned to capture more frequent, shorter-term moves.
Scalping (Scalp Surge):
This mode is designed for very short-term trades where quick entries and exits are key. It uses more sensitive parameters to detect rapid price movements suitable for scalping strategies.
Each trading style is represented by its own merged table that displays real-time metrics. The tables update automatically as new trading signals are generated.
Key Features
Multi-Style Tracking:
Swing Supreme (Large): For swing trading; uses a purple theme.
Day Blaze (Medium): For day trading; uses an orange theme.
Scalp Surge (Small): For scalping; uses a green theme.
Real-Time Metrics:
Each table displays key trade metrics including:
Entry Price: The price at which the trade was entered.
Exit Price: The price at which the previous trade was exited.
Position Size: Calculated as the account size divided by the entry price.
Direction: Indicates whether the trade is “Up” (long) or “Down” (short).
Time: The time when the trade was executed (formatted to hours and minutes).
Wins/Losses: The cumulative number of winning and losing trades.
Current Price & PnL: The current price on the chart and the profit/loss computed relative to the entry price.
Duration: The number of bars that the trade has been open.
History Column: A merged summary column that shows the most recent trade’s details (entry, exit, and result).
Customizability:
Column Visibility: Users can toggle individual columns (Ticker, Timeframe, Entry, Exit, etc.) on or off according to their preference.
Appearance Settings: You can customize the table border width, frame color, header background, and text colors.
History Toggle: The merged history column can be enabled or disabled.
Chart Markers: There is an option to show or hide chart markers (labels and lines) that indicate trade entries and exits on the chart.
Trade History Management:
The indicator maintains a rolling history (up to three recent trades per trading style) and displays the latest summary in the merged table.
This history column provides a quick reference to recent performance.
How It Works
Signal Generation & Trade Metrics
Trade Entry/Exit Calculation:
For each trading style, the indicator uses built-in functions (such as ta.lowestbars and ta.highestbars) to analyze price movements. Based on a customizable "depth" and "deviation" parameter, it determines the point of entry for a trade.
Swing Supreme: Uses larger depth/deviation values to capture swing trends.
Day Blaze: Uses intermediate values for intraday moves.
Scalp Surge: Uses tighter parameters to pick up rapid price changes.
Metrics Update:
When a new trade signal is generated (i.e., when the trade entry price is updated), the indicator calculates:
The current PnL as the difference between the current price and the entry price (or vice versa, depending on the trade direction).
The duration as the number of bars since the trade was opened.
The position size using the formula: accountSize / entryPrice.
History Recording:
Each time a new trade is triggered (i.e., when the entry price is updated), a summary string is created (showing entry, exit, and win/loss status) and appended to the corresponding trade history array. The merged table then displays the latest summary from this history.
Table Display
Merged Table Structure:
Each trading style (Swing Supreme, Day Blaze, and Scalp Surge) is represented by a table that has 15 columns. The columns are:
Trade Type (e.g., Swing Supreme)
Ticker
Timeframe
Entry Price
Exit Price
Position Size
Direction
Time of Entry
Account Size
Wins
Losses
Current Price
Current PnL
Duration (in bars)
History (the latest trade summary)
User Customization:
Through the settings panel, users can choose which columns to display.
If a column is toggled off, its cells will remain blank, allowing traders to focus on the metrics that matter most to them.
Appearance & Themes:
The table headers and cell backgrounds are customizable via color inputs. The trading style names are color-coded:
Swing Supreme (Large): Uses a purple theme.
Day Blaze (Medium): Uses an orange theme.
Scalp Surge (Small): Uses a green theme.
How to Use the Indicator
Add the Indicator to Your Chart:
Once published, add "Triad Trade Matrix" to your TradingView chart.
Configure the Settings:
Adjust the Account Size to match your trading capital.
Use the Depth and Deviation inputs for each trading style to fine-tune the signal sensitivity.
Toggle the Chart Markers on if you want visual entry/exit markers on the chart.
Customize which columns are visible via the column visibility toggles.
Enable or disable the History Column to show the merged trade history in the table.
Adjust the appearance settings (colors, border width, etc.) to suit your chart background and preferences.
Interpret the Tables:
Swing Supreme:
This table shows metrics for swing trades.
Look for changes in entry price, PnL, and trade duration to monitor longer-term moves.
Day Blaze:
This table tracks day trading activity.It will update more frequently, reflecting intraday trends.
Scalp Surge:
This table is dedicated to scalping signals.Use it to see quick entry/exit data and rapid profit/loss changes.
The History column (if enabled) gives you a snapshot of the most recent trade (e.g., "E:123.45 X:124.00 Up Win").
Use allerts:
The indicator includes alert condition for new trade entries(both long and short)for each trading style.
Summary:
Triad Trade Matrix provides an robust,multi-dimensional view of your trading performance across swing trading, day trading, and scalping.
Best to be used whith my other indicators
True low high
Vma Ext_Adv_CustomTbl
This indicator is ideal for traders who wish to monitor multiple trading styles simultaneously, with a clear, technical, and real-time display of performance metrics.
Happy Trading!

Ultimate Volatility Scanner by NHBprod - Requested by Client!Hey Everyone!
I created another script to add to my growing library of strategies and indicators that I use for automated crypto and stock trading! This strategy is for BITCOIN but can be used on any stock or crypto. This was requested by a client so I thought I should create it and hopefully build off of it and build variants!
This script gets and compares the 14-day volatility using the ATR percentage for a list of cryptocurrencies and stocks. Cryptocurrencies are preloaded into the script, and the script will show you the TOP 5 coins in terms of volatility, and then compares it to the Bitcoin volatility as a reference. It updates these values once per day using daily timeframe data from TradingView. The coins are then sorted in descending order by their volatility.
If you don't want to use the preloaded set of coins, you have the option of inputting your own coins AND/OR stocks!
Let me know your thoughts.

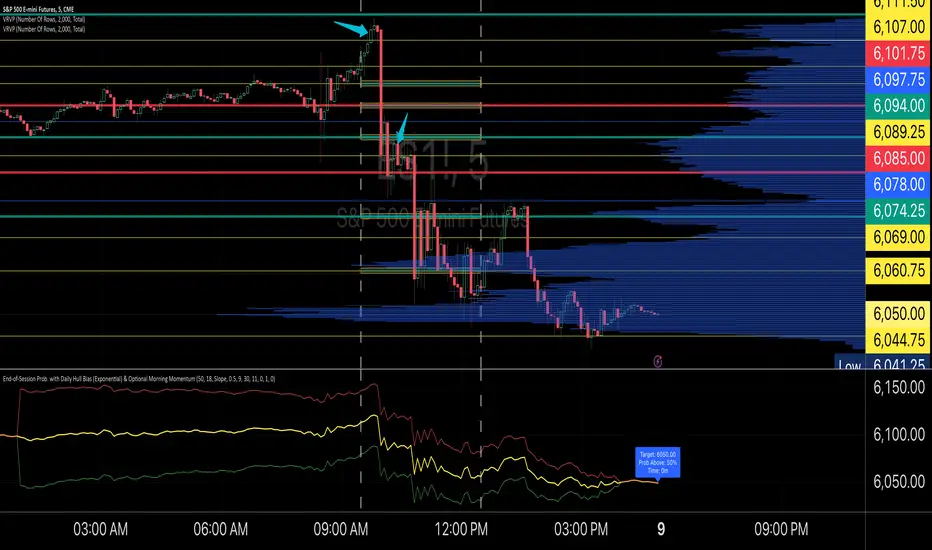
End-of-Session ProbabilityThis indicator estimates the probability that the market will finish the session above a specified target price. It blends a statistical probability model with directional bias and optional morning momentum weighting to help traders gauge end-of-day market expectations.
Key Features:
• Statistical Probability Model:
Uses a normal distribution (with a custom normal CDF approximation) scaled by the square-root-of-time rule. The indicator dynamically adjusts the standard deviation for the remaining session time to compute a z‑score and ultimately the probability that the session close exceeds the target.
• Directional Bias via Daily HullMA (Exponential):
A daily Hull Moving Average (calculated using an exponential method) is used as a big-picture trend indicator. The model allows you to select your bias method—either by comparing the current price to the daily HullMA (Price method) or by using the HullMA’s slope (Slope method). A drift multiplier scales this bias, which then shifts the mean used in the probability calculations.
• Optional Morning Momentum Weight:
For traders who believe that early session moves provide useful clues about the day’s momentum, you can enable an optional weighting. The indicator captures the percentage change from the morning open (within a user-defined time window) and adjusts the expected move accordingly. A multiplier lets you control the strength of this adjustment.
• Visual Outputs:
The indicator plots quantile lines (approximately the 25%, 50%, and 75% levels) for the expected price distribution at session end. An abbreviated on-chart label displays key information:
• Target: The target price (current price plus a user-defined offset)
• Prob Above: The probability (in percentage) that the session close will exceed the target price
• Time: The time remaining in the session (in minutes)
How to Use:
1. Set Your Parameters:
• Expected Session Move: Input your estimated standard deviation for the full-session move in price units.
• Daily Hull MA Settings: Adjust the period for the daily HullMA and choose the bias method (Price or Slope). Modify the drift multiplier to tune the strength of the directional bias.
• Target Offset: Specify an offset from the current price to set your target level.
• Morning Momentum (Optional): Enable the morning momentum weight if you want the indicator to adjust the expected move based on early session price changes. Define the morning session window and set the momentum multiplier.
2. Interpret the Output:
• Quantile Lines: These represent the range of possible end-of-session prices based on your model.
• Abbreviated Label: Provides a quick snapshot of the target price, probability of finishing above that target, and time remaining in the session.
3. Trading Application:
Use the probability output as a guide to assess if the market is likely to continue in the current direction or reverse by session close. The indicator can help you decide on trade entries, exits, or adjustments based on your overall strategy and risk management approach.
This tool is designed to offer a dynamic, statistically driven snapshot of the market’s expected end-of-day behavior, combining both longer-term trend bias and short-term momentum cues.